. 2022 Jun 3;145(5):1785-1804.
doi: 10.1093/brain/awab375.

Personalized brain models identify neurotransmitter receptor changes in Alzheimer's disease

Affiliations

Personalized brain models identify neurotransmitter receptor changes in Alzheimer's disease

Ahmed Faraz Khan et al. Brain. .

Abstract

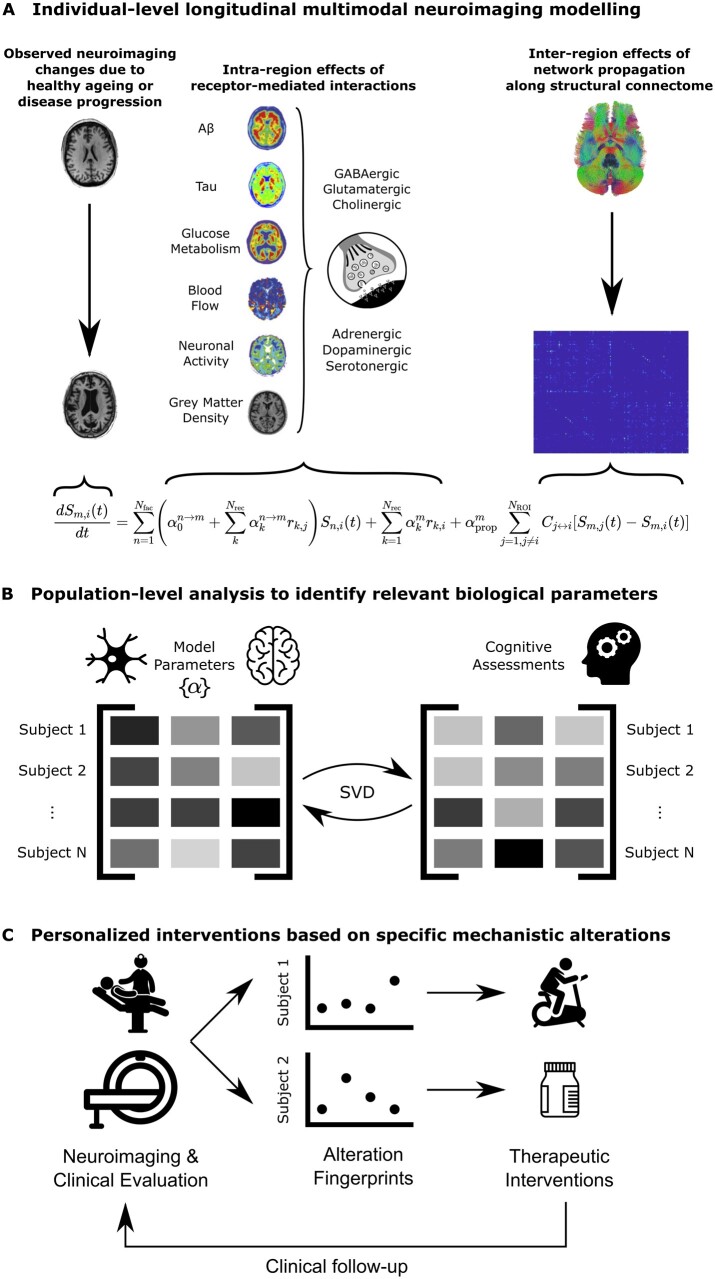
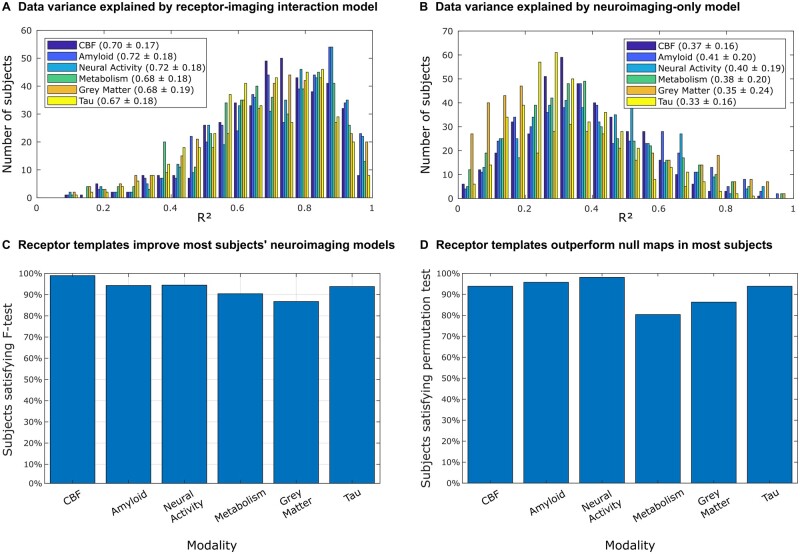
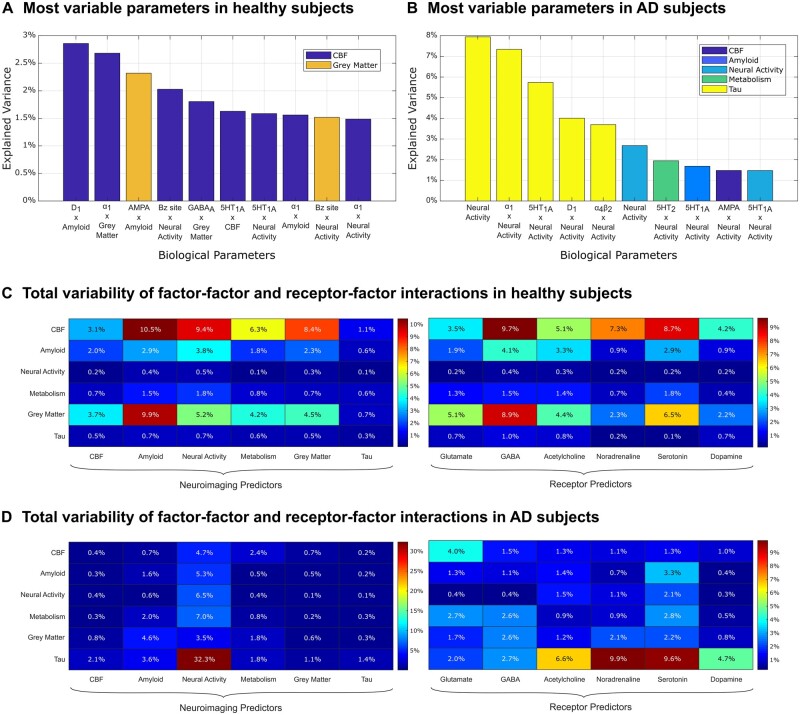
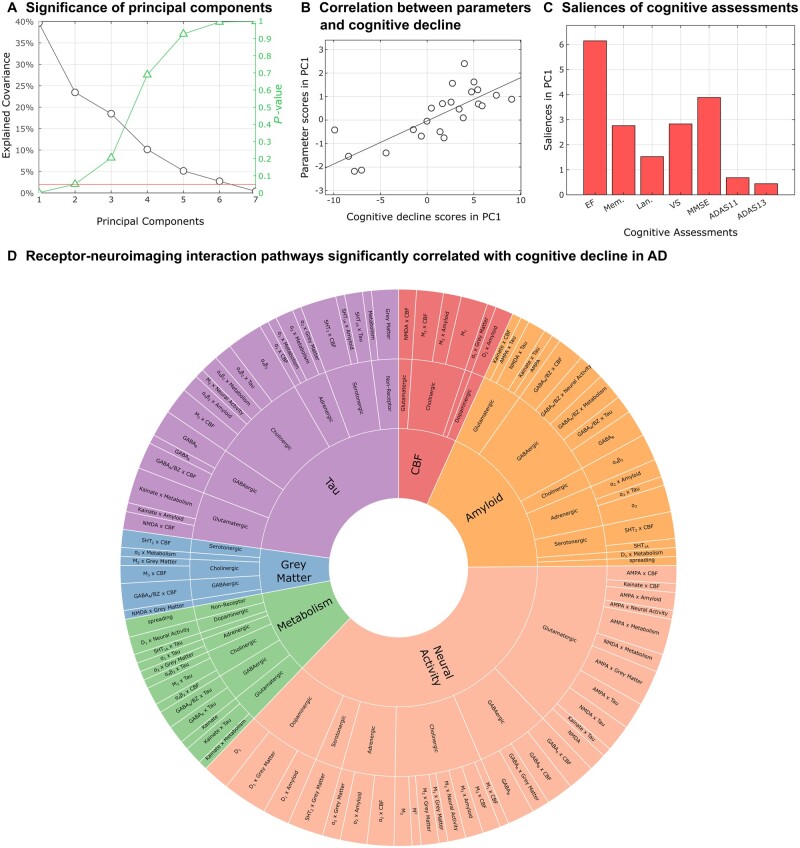
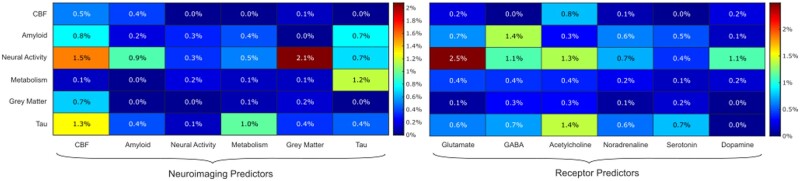
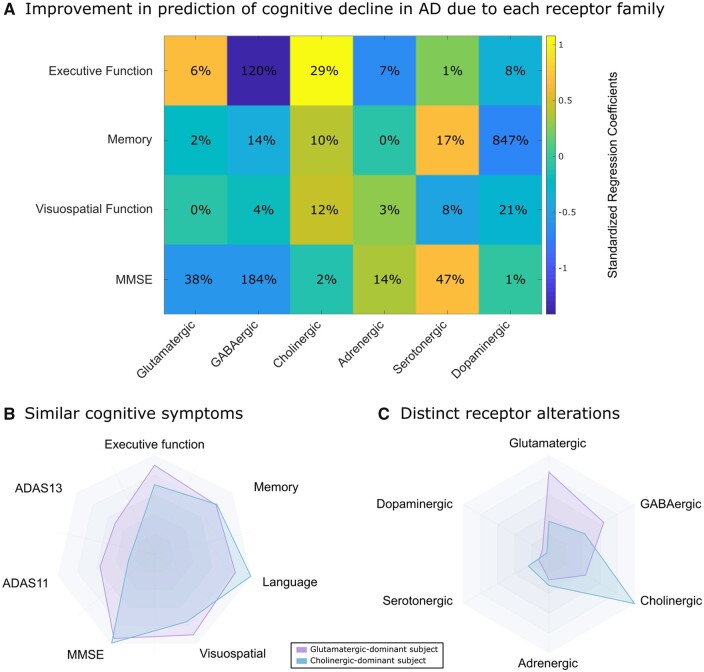
Alzheimer's disease involves many neurobiological alterations from molecular to macroscopic spatial scales, but we currently lack integrative, mechanistic brain models characterizing how factors across different biological scales interact to cause clinical deterioration in a way that is subject-specific or personalized. As important signalling molecules and mediators of many neurobiological interactions, neurotransmitter receptors are promising candidates for identifying molecular mechanisms and drug targets in Alzheimer's disease. We present a neurotransmitter receptor-enriched multifactorial brain model, which integrates spatial distribution patterns of 15 neurotransmitter receptors from post-mortem autoradiography with multiple in vivo neuroimaging modalities (tau, amyloid-β and glucose PET, and structural, functional and arterial spin labelling MRI) in a personalized, generative, whole-brain formulation. In a heterogeneous aged population (n = 423, ADNI data), models with personalized receptor-neuroimaging interactions showed a significant improvement over neuroimaging-only models, explaining about 70% (±20%) of the variance in longitudinal changes to the six neuroimaging modalities. In Alzheimer's disease patients (n = 25, ADNI data), receptor-imaging interactions explained up to 39.7% (P < 0.003, family-wise error-rate-corrected) of inter-individual variability in cognitive deterioration, via an axis primarily affecting executive function. Notably, based on their contribution to the clinical severity in Alzheimer's disease, we found significant functional alterations to glutamatergic interactions affecting tau accumulation and neural activity dysfunction and GABAergic interactions concurrently affecting neural activity dysfunction, amyloid and tau distributions, as well as significant cholinergic receptor effects on tau accumulation. Overall, GABAergic alterations had the largest effect on cognitive impairment (particularly executive function) in our Alzheimer's disease cohort (n = 25). Furthermore, we demonstrate the clinical applicability of this approach by characterizing subjects based on individualized 'fingerprints' of receptor alterations. This study introduces the first robust, data-driven framework for integrating several neurotransmitter receptors, multimodal neuroimaging and clinical data in a flexible and interpretable brain model. It enables further understanding of the mechanistic neuropathological basis of neurodegenerative progression and heterogeneity, and constitutes a promising step towards implementing personalized, neurotransmitter-based treatments.

Keywords: Alzheimer’s disease; multimodal neuroimaging; neurotransmitter receptors; personalized medicine; whole-brain computational model.


Figures

Figure 1
Figure 1
Neurotransmitter receptor-enriched multifactorial causal modelling. (A) For each subject with longitudinal neuroimaging data, changes between subsequent samples in each neuroimaging modality are decomposed into local synergistic effects due to (i) the direct influence of all neuroimaging-quantified biological factors; (ii) receptor density distributions; and (iii) multi-scale receptor–imaging interactions; and (iv) global network-mediated intra-brain propagation. Combining this data across (nROI = 88) brain regions and multiple neuroimaging samples results in a multivariate regression problem to identify the subject-specific parameters {α}. (B) At a group level, these personalized model parameters are then compared to subjects’ cognitive assessments (specifically, the rates of decline for seven composite cognitive scores described in the ‘Cognitive scores’ section) using a singular value decomposition (SVD) procedure on the cross-covariance matrix, to identify multi-scale receptor-neuroimaging interactions that are robustly correlated with the severity of cognitive symptoms in Alzheimer’s disease (outlined in the ‘Biological parameters and relationship with cognition’ section). (C) In the context of personalized applications, inter-subject variability in receptor–imaging interactions can be used as clinical ‘fingerprints’ of molecular alterations representing different disease mechanisms. Patients can then receive individually tailored treatment plans to address their underlying aetiology, based on their specific fingerprints. For example, patients with greater vascular alterations may benefit more from lifestyle interventions such as physical exercise, whereas patients with greater receptor alterations may require neurotransmitter-based medication (depending on the most affected receptor). Furthermore, treatment plans can be continually adjusted with follow-up visits.
Figure 2
Figure 2
Receptor density templates and multi-scale receptor-neuroimaging interactions significantly improve individual longitudinal neuroimaging models. The improvement in neuroimaging modelling was evaluated in terms of (i) including direct receptor terms and receptor-neuroimaging interactions in the model; and (ii) using true receptor density maps compared to randomized, spatially permuted maps. The histograms in A and B show the distribution of the coefficient of determination (R2) of n = 423 individual models of neuroimaging changes including (A) and excluding (B) receptor predictors. Subject-specific linear models fit neuroimaging changes reasonably well, with a significant improvement by including receptor terms. This is confirmed by the F-test between subject models with and without receptor densities and receptor–imaging interactions (113 and 8 parameters, respectively). The proportion of subjects for whom the F-statistic is above the critical threshold is shown in (C). This critical threshold corresponds to a statistically significant (P < 0.05) improvement due to the receptor terms in the re-MCM model, accounting for the increase in adjustable model parameters. Furthermore, to validate the benefit of the receptor templates over randomized null maps, re-MCM models were fit with 1000 spatially shuffled receptor maps for each subject. The P-value of the model fit (R2) using true receptor templates compared to the distribution of R2 of models using randomized templates was calculated for each subject. The proportion of subjects for whom the true receptor maps resulted in a statistically significant improvement in model fit (P < 0.05) is shown in D. The results of these two analyses in C and D validate the use of averaged receptor templates in personalized neuroimaging models.
Figure 3
Figure 3
Variability of biological parameters across healthy and Alzheimer’s disease participants. (A and B) PCA-based sources of variability in the 678 re-MCM parameters across healthy subjects (n = 112) and Alzheimer’s disease patients (n = 25), respectively. The first principal component (PC1) captured 97.3% of the variance across parameters in healthy subjects, and 26.2% in Alzheimer’s disease patients. The top 10 biological parameters and their contributions to PC1 are plotted (with their target neuroimaging models in the legend), highlighting the receptor–imaging interactions that characterize the main axis of variability in each clinical subgroup. In healthy subjects, a multifactorial combination of receptor–imaging interactions affecting atrophy and CBF changes were the most variable parameters along PC1. Notably, for Alzheimer’s disease patients, the top parameters were direct or receptor-mediated effects of neural activity on various (but especially tau) imaging models. (C and D) To evaluate the relative importance of receptor– and factor–factor interactions, we then aggregated the importance of all direct or interaction terms involving a given predictor class (factor or receptor type) along PC1, for (C) healthy subjects and (D) for Alzheimer’s disease patients, respectively. Note that the percentage variation across all parameters is shown. As such, there is an overlap in terms between the two heat maps (receptor–factor interaction terms contribute to both) and they should be interpreted separately.
Figure 4
Figure 4
Significant neurotransmitter receptor–imaging interactions underlying Alzheimer’s disease clinical severity. (A) The latent cross-correlation components are ranked by the fraction of cognitive decline variance explained by re-MCM biological parameters (along with the reported P-values based on the permutation analysis; see the ‘Biological parameters and relationship with cognition’ section). In this case, only a single latent component was significant (39.7% variance explained, P < 0.004, FWE-corrected). (B) A notable correlation (r = 0.80; P < 10−8) between the projections of statistically stable re-MCM parameters and rates of cognitive decline in the principal component space was observed, with the removal of an outlier subject more than three median absolute deviations from the median. (C) Saliences of cognitive decline to this first latent component, providing a relative ranking of cognitive domains. These saliences are proportional to the contribution of each term relative to every other term, for example showing that executive dysfunction is most correlated with alterations to receptor–imaging interactions in Alzheimer's disease. (D) Receptor-imaging pathways that are significantly correlated with cognitive decline, arranged by neuroimaging model and receptor type (Supplementary Table 5). The angle of each sector is proportional to the contribution of the corresponding parameter to explaining the variance in the rates of cognitive decline. The inner sectors represent the six neuroimaging modalities that together comprise each personalized re-MCM model. Within each modality, the intermediate sectors represent the neurotransmitter system involved, while the outer sector consists of the specific two-way receptor-neuroimaging interactions or direct predictor terms in the model. Notably, while receptors appear only as predictors in the outer sector, neuroimaging modalities appear both as predictors and as model outputs in the inner sectors. Thus, the relative importance of each neuroimaging modality to explaining cognitive differences is not fully represented by the angle of each inner sector.
Figure 5
Figure 5
Contributions of mechanistic pathways to the severity of cognitive decline in Alzheimer’s disease. To better visualize the importance of neuroimaging factors and neurotransmitter receptor systems, heatmaps of the cumulative cognitive variance explained by each predictor category in each neuroimaging model are shown. These variances are the percentages of total cognitive variance that are explained by significant biological parameters of each category via the first significant SVD component. As such, the rows of the heat map on the left replicate the inner sector of Fig. 4D, while the columns show the importance of each imaging modality or receptor family as predictors, with CBF and tau predictors explaining the most variance in cognitive decline.
Figure 6
Figure 6
Receptor alterations underlying inter-individual disease heterogeneity. (A) In Alzheimer’s disease patients (n = 25), we quantified the relative effect sizes of standardized Mahalanobis distances of receptor mechanisms on different cognitive domains. We also standardized the regression coefficients within each cognitive domain before visualizing to facilitate comparison across cognitive domains, and the percentage improvement in model fit (R2) due to each receptor system is also shown. For example, the explanation of inter-subject variability in executive function decline by glutamatergic, cholinergic, adrenergic, serotonergic and dopaminergic Mahalanobis distances is improved by 120% (i.e. more than doubled) by the inclusion of GABAergic Mahalanobis distance as well. (B and C) We show two Alzheimer’s disease participants, with similar symptoms across a variety of cognitive domains. For these participants, we calculated the Mahalanobis distance to the distribution of all healthy subjects (n = 112), along mechanisms involving each receptor family. The subjects show distinct receptor alterations based on their longitudinal neuroimaging changes, despite their shared designation as Alzheimer’s disease patients and similar cognitive profiles.

Similar articles

Cited by

References

    1. Francis PT, Ramírez MJ, Lai MK.. Neurochemical basis for symptomatic treatment of Alzheimer’s disease. Neuropharmacology. 2010;59(4-5):221–229. - PubMed
    1. Jack CR Jr, Knopman DS, Jagust WJ.. Hypothetical model of dynamic biomarkers of the Alzheimer’s pathological cascade. Lancet Neurol. 2010;9(1):119–128. - PMC - PubMed
    1. Lam B, Masellis M, Freedman M, Stuss DT, Black SE.. Clinical, imaging, and pathological heterogeneity of the Alzheimer’s disease syndrome. Alzheimer’s Res Ther. 2013;5(1):1. - PMC - PubMed
    1. Iturria-Medina Y, Carbonell FM, Evans AC.. Multimodal imaging-based therapeutic fingerprints for optimizing personalized interventions: Application to neurodegeneration. NeuroImage. 2018;179:40–50. - PubMed
    1. Kosik KS. Personalized medicine for effective Alzheimer disease treatment. JAMA Neurol. 2015;72(5):497–498. - PubMed

Publication types