. 2022 Jun;77(6):1797-1814.
doi: 10.1111/all.15124. Epub 2021 Oct 22.

Large-scale provocation studies identify maladaptive responses to ubiquitous aeroallergens as a correlate of severe allergic rhinoconjunctivitis and asthma

Affiliations

Large-scale provocation studies identify maladaptive responses to ubiquitous aeroallergens as a correlate of severe allergic rhinoconjunctivitis and asthma

Alisha M Smith et al. Allergy. 2022 Jun.

Abstract

Background: Allergic asthma (AA) and allergic rhinoconjunctivitis (ARC) are common comorbid environmentally triggered diseases. We hypothesized that severe AA/ARC reflects a maladaptive or unrestrained response to ubiquitous aeroallergens.

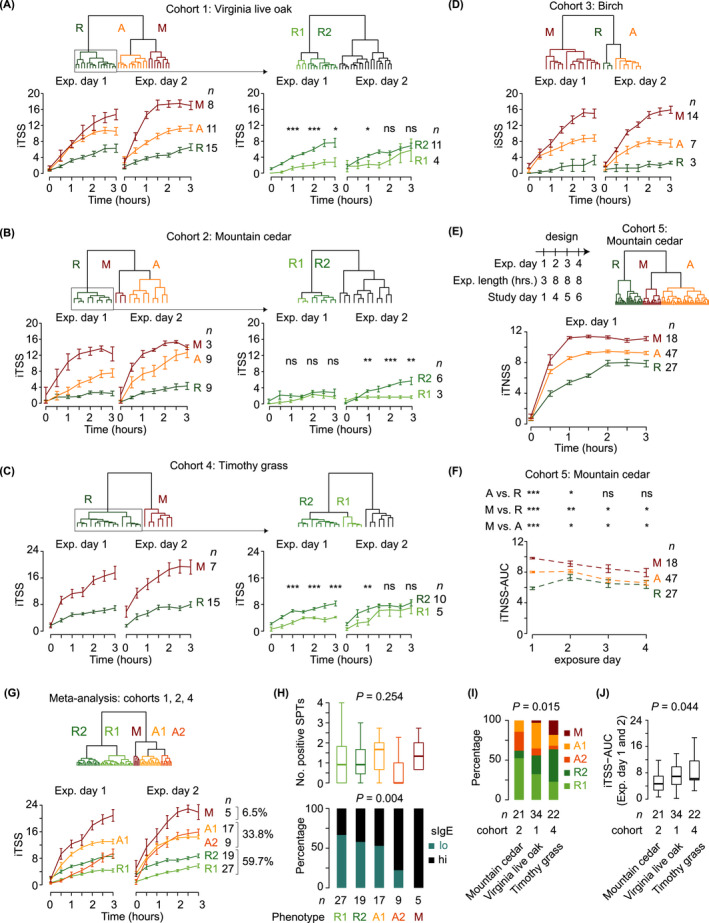
Methods: We performed provocation studies wherein six separate cohorts of persons (total n = 217) with ARC, with or without AA, were challenged once or more with fixed concentrations of seasonal or perennial aeroallergens in an aeroallergen challenge chamber (ACC).

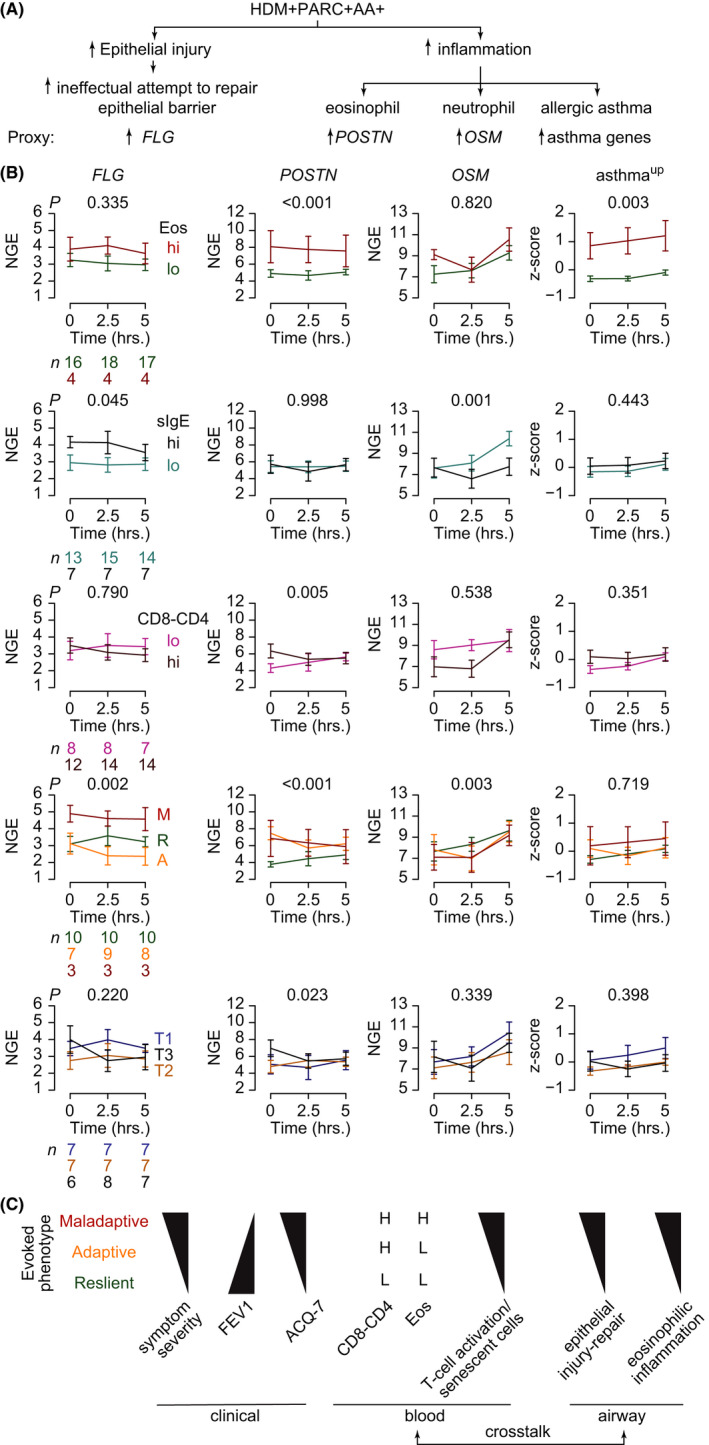
Results: Aeroallergen challenges elicited fully or partially restrained vs. unrestrained evoked symptom responsiveness, corresponding to the resilient and adaptive vs. maladaptive AA/ARC phenotypes, respectively. The maladaptive phenotype was evoked more commonly during challenge with a non-endemic versus endemic seasonal aeroallergen. In an AA cohort, symptom responses evoked after house dust mite (HDM) challenges vs. recorded in the natural environment were more accurate and precise predictors of asthma severity and control, lung function (FEV1), and mechanistic correlates of maladaptation. Correlates included elevated levels of peripheral blood CD4+ and CD8+ T-cells, eosinophils, and T-cell activation, as well as gene expression proxies for ineffectual epithelial injury/repair responses. Evoked symptom severity after HDM challenge appeared to be more closely related to levels of CD4+ and CD8+ T-cells than eosinophils, neutrophils, or HDM-specific IgE.

Conclusions: Provocation studies support the concept that resilience, adaptation, and maladaptation to environmental disease triggers calibrate AA/ARC severity. Despite the ubiquity of aeroallergens, in response to these disease triggers in controlled settings (ie, ACC), most atopic persons manifest the resilient or adaptive phenotype. Thus, ARC/AA disease progression may reflect the failure to preserve the resilient or adaptive phenotype. The triangulation of CD8+ T-cell activation, airway epithelial injury/repair processes and maladaptation in mediating AA disease severity needs more investigation.

Keywords: T-cells; aeroallergen challenge chamber; allergy; asthma; phenotypes.


Conflict of interest statement

RLJ is the owner of the Biogenics Research Chamber. The rest of the authors declare that they have no relevant conflicts of interest.

Figures

FIGURE 1
FIGURE 1
Models, cohorts and study design. (A) Cross‐sectional vs. evoked phenotypes. (B) Evoked phenotypes by cross‐sectional phenotypes. (C) Cohorts studied. (D) HDM+PARC+AA+ (cohort 6) study design and time windows for phenotype assessments. A, adaptive; AA, allergic asthma; ACC, aeroallergen challenge chamber; ACQ‐7, asthma control questionnaire‐7; ARC, allergic rhinoconjunctivitis; FEV1, forced expiratory volume within one second; HDM, house dust mite; hr, hour; M, maladaptive; MC, mountain cedar; R, resilient; sIgE, house dust mite‐specific IgE; SSS, summated symptom scores; t, timepoint; TNSS, total nasal symptom scores; TSS, total symptom scores; VLO, Virginia live oak
FIGURE 2
FIGURE 2
Evoked phenotypes during exposures to seasonal aeroallergens in an aeroallergen challenge chamber. (A–D) Top: Instantaneous total symptom score (iTSS) or summated symptom score (iSSS) clusters. Bottom: Mean (SEM) iTSS or iSSS at 30‐min intervals during exposure (Exp.) days 1 and 2 by phenotypes (resilient [R], adaptive [A], maladaptive [M]). Cohort and exposures are indicated. (A–C, right) Post hoc analysis performed on the resilient (R) phenotype cluster; resilient‐subclusters are R1 and R2. (E) Top left: Study design. Top right: Instantaneous total nasal symptom score (iTNSS) clusters. Bottom: Mean (SEM) iTNSS at 30‐min intervals during exposure (Exp.) day 1 by phenotypes (R, A, M). (F) Mean (SEM) iTNSS‐area under the curve (iTNSS‐AUC) during exposure days 1, 2, 3, and 4 in cohort 5 participants by R, A, and M phenotypes. (G–J) Meta‐analysis using iTSS data from cohorts 1, 2 and 4. (G) Top: Clusters. Bottom: Mean (SEM) iTSS at 30‐min intervals during exposure (Exp.) days 1 and 2 by clusters. The resilient and adaptive subclusters are indicated by suffixes 1 and 2. (H) Top: Boxplots (MIQ) of the number of positive skin prick tests (SPTs), adjusted by cohort, by evoked phenotypes (panel G). p, by negative binomial GLM with likelihood ratio test (LRT) (adjusted by cohort). Bottom: Proportion of persons with sIgElo or sIgEhi by meta‐analysis evoked phenotypes (panel G). p, by logistic regression with LRT (adjusted by cohort). Cutoff for sIgEhi vs. sIgElo: 0.35 kU/L (Appendix S1). (I) Proportion of the indicated clusters in cohorts 2 (mountain cedar), 1 (Virginia live oak), or 4 (Timothy grass). (J) Boxplots of mean iTSS‐AUC of exposure (Exp.) days 1 and 2 by cohort. p, by LRT or Fisher's exact test; *p < .05, **p < .01, ***p < .001, ns, non‐significant
FIGURE 3
FIGURE 3
Evoked phenotypes in persons with house dust mite (HDM)‐associated perennial allergic rhinoconjunctivitis with asthma (HDM+PARC+AA+) identified during exposure to HDMs in an aeroallergen challenge chamber (ACC). (A) Left: Mean (SEM) instantaneous summated symptom scores (iSSS) at 30‐min intervals in HDM+PARC+AA+ participants during a 5‐h exposure to HDMs; triangles indicate sampling timepoints. Right: Clusters and phenotypes (resilient [R], adaptive [A], maladaptive [M]). (B) Top: Study design schema. All data are based on the symptom metrics and FEV1 according to the evoked phenotypes that were identified during the HDM exposure. Bottom (plots): First row: Mean (SEM) reflective summated symptom score (rSSS) and instantaneous SSS (iSSS) at the indicated timepoints by HDM+PARC+AA+ phenotypes before (run‐in), during, and after (natural setting) the ACC challenge. Second row: Mean rSSS (SEM) in the 4‐day run‐in and natural settings, and iSSS‐area under the curve (AUC) in the ACC. Third row: Mean (SEM) FEV1 at the indicated timepoints by HDM+PARC+AA+ phenotypes before (run‐in), during, and after (natural setting) the ACC challenge. Fourth row: Mean FEV1 (SEM) in the 4‐day run‐in and natural setting, and FEV1‐AUC in the ACC. p, by likelihood ratio test (LRT). (C) Proportion of HDM+PARC+AA+ participants with the R, A, or M phenotypes who required treatment during the ACC due to a decline in FEV1 ≥12% (Appendix S1). p, by Fisher's exact test. AA, allergic asthma; FEV1, forced expiratory volume within one second; L, liters.; PARC, perennial allergic rhinoconjunctivitis
FIGURE 4
FIGURE 4
Symptom severity and adequacy of asthma control according to evoked versus cross‐sectional phenotypes in HDM+PARC+AA+ persons exposed to house dust mites (HDM) in an aeroallergen challenge chamber (ACC). (A) Mean (SEM) (top) instantaneous total symptom score (iTSS) and (bottom) instantaneous total asthma symptom score (iTASS) at the indicated timepoints in the ACC by phenotypes (resilient [R], adaptive [A], maladaptive [M]). p, by likelihood ratio test (LRT). (B) Schema of level of symptom severity, forced expiratory volume within one second (FEV1), and asthma control questionnaire (ACQ)‐7 score by evoked phenotypes (R, A, M) and cross‐sectional phenotypes [defined by tertiles (T) of run‐in reflective summated symptom scores (rSSS); T3 is the tertile with the upper‐third values of the average‐rSSS]. ns, non‐significant. (C) Proportion of evoked phenotypes represented in cross‐sectional phenotypes. p, by Fisher's exact test. (D) Mean (SEM) (top) instantaneous SSS (iSSS) and (bottom) FEV1 at the indicated timepoints in the ACC according to run‐in rSSS tertiles. p, by LRT. T, tertile. (E) Boxplots of (left to right) iSSS‐area under the curve (AUC), iTASS‐AUC, iTSS‐AUC, and FEV1 (L)‐AUC in the ACC by evoked phenotypes and cross‐sectional phenotypes. p, by GEE model with an exchangeable correlation structure. L, liters. (F) ACQ‐7 scores at visit 2 stratified by (left to right) evoked phenotypes, cross‐sectional phenotypes, CD8‐CD4 balance clusters (described in Figure 5A), and eosinophil (Eos), neutrophil (Neut), and HDM‐specific IgE (sIgE) strata. Strata cutoffs in Appendix S1. p, by LRT. (G) Left: Proportion of HDM+PARC+AA− (Ref. 8 ) and HDM+PARC+AA+ (cohort 6) persons with the evoked phenotypes (R, A, and M). p, by Fisher's exact test. Right: Mean iTSS‐AUC in the ACC in HDM+PARC+AA− (Ref. 8 ) and HDM+PARC+AA+ (cohort 6) persons overall and by R, A, and M phenotypes. p, by LRT. AA, allergic asthma; Hi, higher; Lo, lower; PARC, perennial allergic rhinoconjunctivitis
FIGURE 5
FIGURE 5
Cellular traits associated with symptom severity and evoked phenotypes in HDM+PARC+AA+ persons exposed to house dust mites (HDMs) in an aeroallergen challenge chamber (ACC). (A) Left: Two CD8‐CD4 balance clusters identified by unsupervised hierarchical clustering of baseline (timepoint t = 0 in ACC exposure) CD8+ T‐cell counts and CD4:CD8 T‐cell ratio levels. Right: Baseline CD8+ and CD4+ T‐cell counts and CD4:CD8 T‐cell ratio levels by CD8‐CD4 balance cluster I (CD8‐CD4lo) and cluster II (CD8‐CD4hi). Y‐axes depicted as exponentiation of log2 scale. p, by linear model with likelihood ratio test (LRT) using log2‐transformed values. Hi, higher; Lo, lower. (B) Proportion of evoked phenotypes (resilient [R], adaptive [A], maladaptive [M]) with the indicated peripheral blood trait strata. p, by Fisher's exact test. (C) Mean (SEM) instantaneous summated symptom scores (iSSS) during the ACC exposure by (left to right) CD8‐CD4 balance clusters (CD8‐CD4), eosinophil (Eos), neutrophil (Neut), and house dust mite‐specific IgE (sIgE) strata. Strata cutoffs in Appendix S1. p, by linear GEE model with an autoregressive 1 correlation structure and adjusted by time (in minutes). (D–E) Boxplots of mean reflective SSS (rSSS) in the 4‐day run‐in and post‐ACC phases, and iSSS‐area under the curve (AUC) in the ACC in HDM+PARC+AA+ participants stratified by (D) CD8‐CD4 balance clusters, and (E) Eos strata. p, by linear model with LRT. (F) Coefficient of determination (r 2) with iSSS‐AUC as the dependent variable and CD8‐CD4hi/lo, Eoshi/lo, Neuthi/lo, or sIgEhi/lo strata as the independent variable. p, by LRT. AA, allergic asthma; HDM, house dust mites; PARC, perennial allergic rhinoconjunctivitis
FIGURE 6
FIGURE 6
Peripheral blood T‐cell traits by evoked phenotypes, peripheral blood trait strata, and cross‐sectional phenotypes in HDM+PARC+AA+ participants challenged with house dust mites (HDMs) in an aeroallergen challenge chamber (ACC). Mean (SEM) of (left to right) CD4+HLA‐DR+ effector memory, CD8+HLA‐DR+ effector memory, CD8+CD28−, and CD8+ TEMRA T‐cells before and after (pre vs. post) ACC exposure stratified by (top to bottom) evoked phenotypes (resilient [R], adaptive [A], maladaptive [M]), CD8‐CD4 balance clusters, eosinophils (Eos), and HDM‐specific IgE (sIgE) strata, and cross‐sectional phenotypes (run‐in rSSS tertiles T1 to T3 (T3 is the tertile with the upper‐third values of the average‐rSSS). p, by linear generalized estimating equation model with an exchangeable correlation structure and adjusted by time as a factorial variable with an analysis of variance (ANOVA). AA, allergic asthma; HDM, house dust mites; PARC, perennial allergic rhinoconjunctivitis
FIGURE 7
FIGURE 7
Nasal cell gene expression profiles in HDM+PARC+AA+ participants and summary mechanistic models. (A) Model of proxies for pathways influencing HDM‐associated perennial allergic rhinoconjunctivitis with asthma (HDM+PARC+AA+) disease severity. (B) Gene expression of (left to right) FLG, POSTN, and OSM [log2‐normalized gene expression (NGE)] and the asthmaup gene signature (z‐scores) in nasal brushings at the indicated timepoints (t = 0, 2.5, and 5 h [hrs.]) in the ACC stratified by (top to bottom) eosinophil (Eos), HDM‐specific IgE (sIgE), and CD8‐CD4 balance cluster, evoked phenotypes (resilient [R], adaptive [A], maladaptive [M]), and cross‐sectional phenotypes [run‐in rSSS tertiles; T3 is the tertile with the upper‐third values of the average‐rSSS]. p, for NGE derived by a generalized estimating equation generalized linear model (GEE‐GLM) based on the gamma distribution with an analysis of variance (ANOVA). p, for z‐scores derived by a GEE‐GLM based on the normal distribution and adjusted by time as a categorical variable with an exchangeable correlation structure with ANOVA. (C) Summary of traits (clinical, blood, and airway) associated with evoked phenotypes in HDM+PARC+AA+ persons. AA, allergic asthma; H, higher; HDM, house dust mites; L, lower; PARC, perennial allergic rhinoconjunctivitis

References

    1. Bousquet J, Khaltaev N, Cruz AA, et al. Allergic Rhinitis and its Impact on Asthma (ARIA) 2008 update (in collaboration with the World Health Organization, GA(2)LEN and AllerGen). Allergy. 2008;63(Suppl 86):8‐160. 10.1111/j.1398-9995.2007.01620.x - DOI - PubMed
    1. Togias A, Gergen PJ, Hu JW, et al. Rhinitis in children and adolescents with asthma: Ubiquitous, difficult to control, and associated with asthma outcomes. J Allergy Clin Immunol. 2019;143(3):1003. 10.1016/j.jaci.2018.07.041 - DOI - PMC - PubMed
    1. Platts‐Mills TAE, Erwin EA, Heymann PW, Woodfolk JA. Pro: the evidence for a causal role of dust mites in asthma. Am J Respir Crit Care Med. 2009;180:109‐113; discussion 120‐101, 10.1164/rccm.200811-1756PR - DOI - PubMed
    1. Murrison LB, Brandt EB, Myers JB, Hershey GKK. Environmental exposures and mechanisms in allergy and asthma development. J Clin Invest. 2019;129:1504‐1515. 10.1172/JCI124612 - DOI - PMC - PubMed
    1. Jacobs RL, Harper N, He W, et al. Effect of confounding cofactors on responses to pollens during natural season versus pollen challenge chamber exposure. J Allergy Clin Immunol. 2014;133:1340‐1346. 10.1016/j.jaci.2013.09.051 - DOI - PubMed

Publication types