

Correction of oxidative stress enhances enzyme replacement therapy in Pompe disease
- PMID: 34606154
- PMCID: PMC8573602
- DOI: 10.15252/emmm.202114434
Correction of oxidative stress enhances enzyme replacement therapy in Pompe disease
Abstract
Pompe disease is a metabolic myopathy due to acid alpha-glucosidase deficiency. In addition to glycogen storage, secondary dysregulation of cellular functions, such as autophagy and oxidative stress, contributes to the disease pathophysiology. We have tested whether oxidative stress impacts on enzyme replacement therapy with recombinant human alpha-glucosidase (rhGAA), currently the standard of care for Pompe disease patients, and whether correction of oxidative stress may be beneficial for rhGAA therapy. We found elevated oxidative stress levels in tissues from the Pompe disease murine model and in patients' cells. In cells, stress levels inversely correlated with the ability of rhGAA to correct the enzymatic deficiency. Antioxidants (N-acetylcysteine, idebenone, resveratrol, edaravone) improved alpha-glucosidase activity in rhGAA-treated cells, enhanced enzyme processing, and improved mannose-6-phosphate receptor localization. When co-administered with rhGAA, antioxidants improved alpha-glucosidase activity in tissues from the Pompe disease mouse model. These results indicate that oxidative stress impacts on the efficacy of enzyme replacement therapy in Pompe disease and that manipulation of secondary abnormalities may represent a strategy to improve the efficacy of therapies for this disorder.
Keywords: N-acetylcysteine; Pompe disease; alpha-glucosidase; enzyme replacement therapy; oxidative stress.
© 2021 The Authors Published under the terms of the CC BY 4.0 license.
Conflict of interest statement
G.P. received honoraria or travel reimbursement from TAKEDA, Sanofi‐Genzyme, and Orchard therapeutics. This work was supported in part by Spark Therapeutic Inc.
Figures
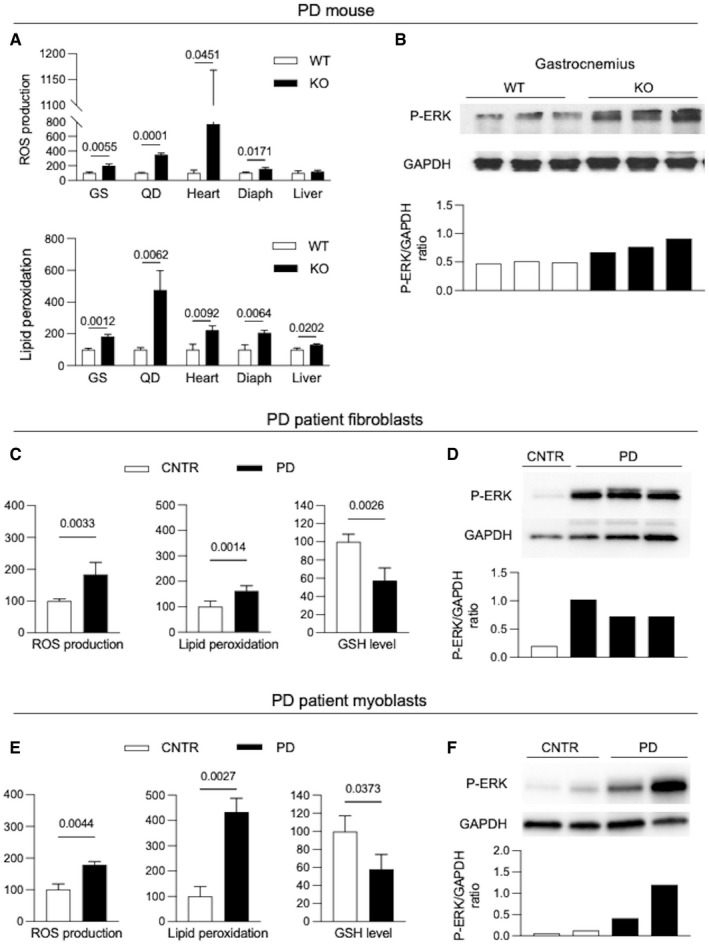
- A, B
Oxidative stress biochemical markers (lipid peroxidation, ROS production) (A) and p‐ERK expression (B) in tissues from 3‐month‐old PD mice (KO) (n = 3) and from wild‐type (WT) mice.
- C, D
Oxidative stress biochemical markers (lipid peroxidation, ROS production, GSH levels) (C) and p‐ERK expression (D) in PD and control (CNTR) fibroblasts (n = 6).
- E, F
Oxidative stress biochemical markers (lipid peroxidation, ROS production, GSH levels) (E) and p‐ERK expression (F) in PD and control (CNTR) myoblasts (n = 4).
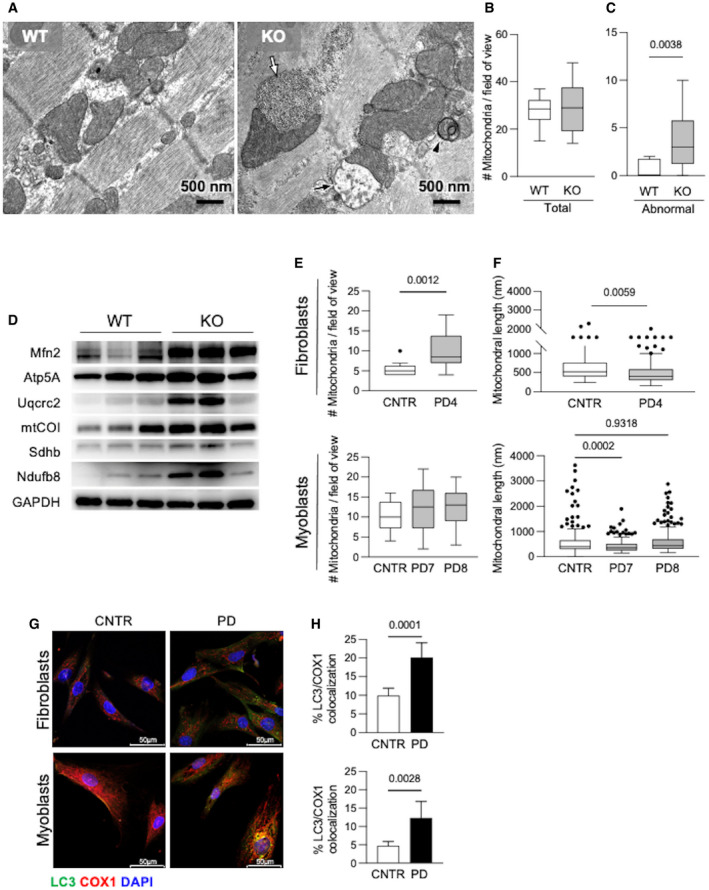
- A
Ultrastructural analysis of gastrocnemii from the Gaa KO mouse showed intra‐lysosomal glycogen storage (white arrow), active mitophagy (arrowhead), abnormal mitochondria (black arrow).
- B, C
Quantitative analysis of the number of mitochondria (B) and of morphologically abnormal mitochondria (C) in 15 low‐magnification (16×) electron microscopy fields showing significantly increased number of abnormal mitochondria (P = 0.0038) in Gaa KO compared to wild‐type animals. Data presented as mean ± SD of at least 12 fields for each mouse muscle. Student’s t‐test was applied.
- D
Western blot analysis of the levels of OXPHOS complexes in mitochondrial preparations from the Gaa KO gastrocnemii, showing increased levels of the markers tested.
- E, F
Number of mitochondria (E) and mitochondrial length (F) in PD fibroblasts and myoblasts compared to, respectively, control cells. Data presented as mean ± SD of at least 15 fields for each cell line. A Student’s t‐test was applied.
- G, H
Co‐staining of COX1 with LC3 (G) and quantitative analysis (H) showing significantly increased colocalization of these markers in PD cells compared to control cells under standard culture conditions. Data presented as mean ± SD of five images for each cell line. A Student’s t‐test was applied. Confocal 63× images; scale bar 50 µm; contrast +15%; brightness +25%.
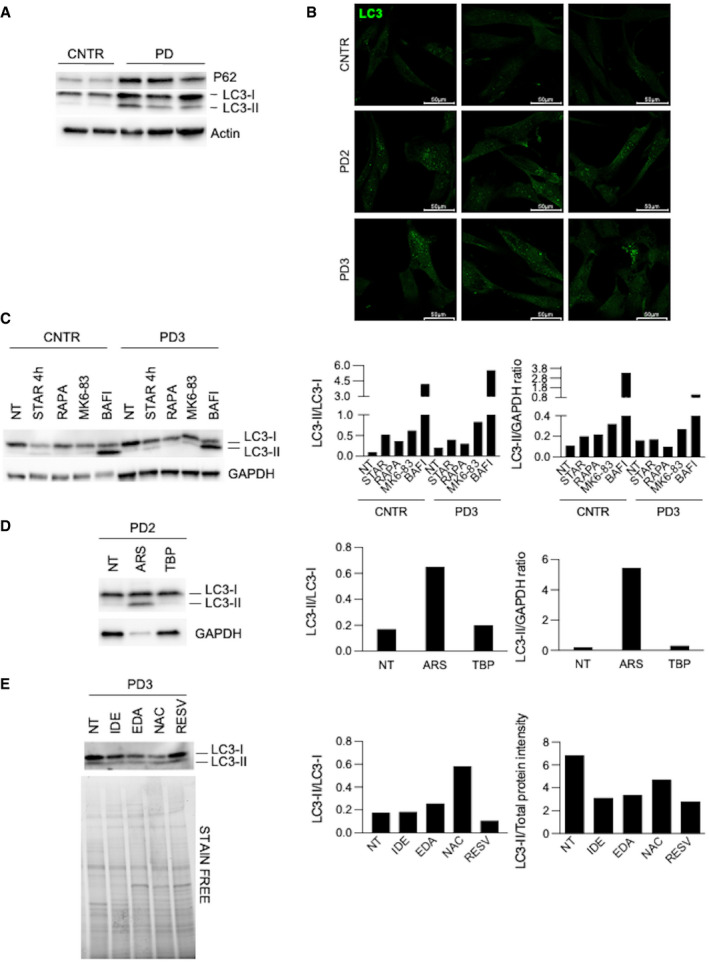
Western blot analysis of p62 and LC3 in control (CNTR) (n = 2) and Pompe disease (PD) (n = 3) fibroblasts.
Immunofluorescence analysis of LC3 in cultured CNTR and PD fibroblasts. Confocal 63× images; scale bar 50 µm; brightness +25%; contrast +20%.
Western blot and quantitative analyses of autophagy marker LC3 in CNTR and in a PD cell line. The analysis was performed in untreated cells and after different treatments to modulate autophagy (starvation, STAR; rapamycin, RAPA; MK6‐83; bafilomycin, BAFI).
Western blot and quantitative analyses of autophagy marker LC3 in a PD cell line. The analysis was performed in untreated cells and after different treatments to induce stress (sodium arsenite, ARS; tert‐butyl‐peroxide, TBP).
Western blot and quantitative analyses of autophagy marker LC3 in a PD cell line. The analysis was performed in untreated cells and after antioxidant treatments.
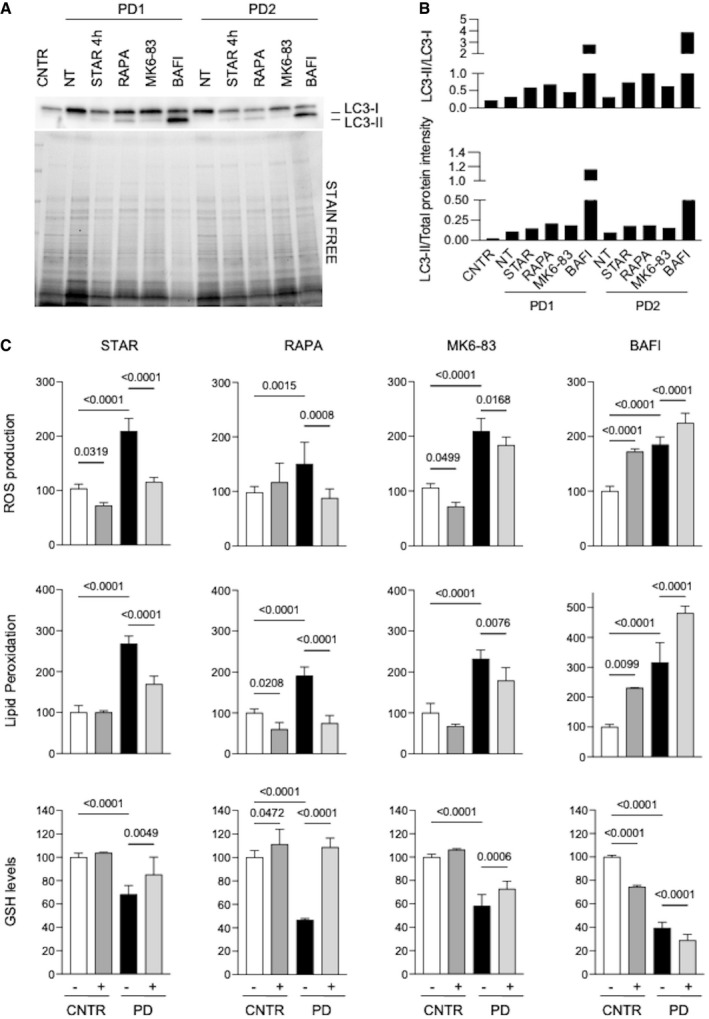
- A, B
Western blot analysis of the autophagy marker LC3 (A) and quantitative analyses (B) in untreated control fibroblasts (CNTR) and in 2 PD fibroblasts cell lines (PD1, PD2). PD cells were untreated (NT) or subjected to different treatments to modulate autophagy (starvation, STAR; rapamycin, RAPA; MK6‐83; bafilomycin, BAFI). Results obtained in a third cell line (PD3) and in a control fibroblast cell line subjected to the same autophagy‐modulating treatments are shown in Fig EV2.
- C
ROS production, lipid peroxidation, and GSH levels in PD fibroblasts (n = 3). CNTR (white bars), CNTR after treatment (dark gray bars), PD samples (black bars), and PD after treatment (light gray bars). Physiological or pharmacological enhancement of autophagy resulted in correction of oxidative stress in PD cells, while bafilomycin treatment further increased stress in CNTR and PD cells.
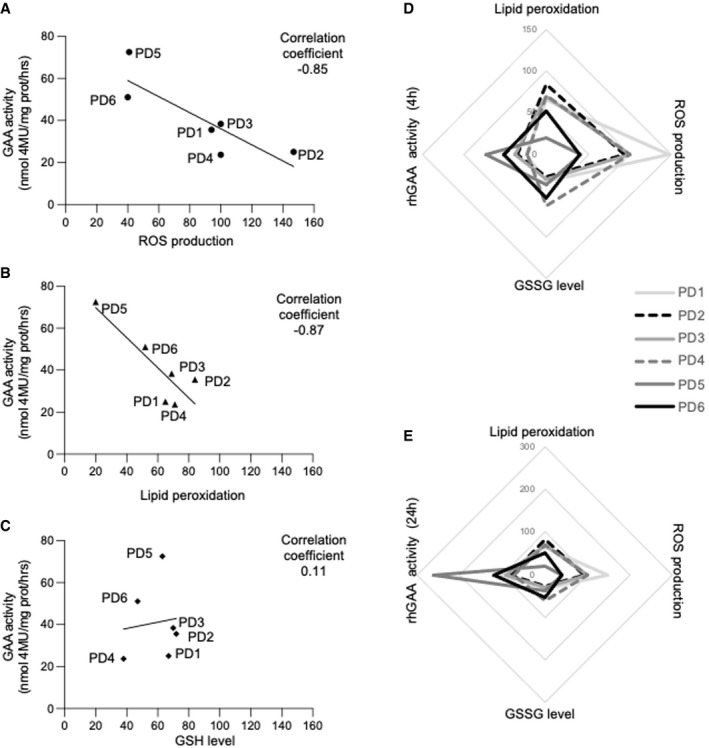
- A–C
Correlations between the levels of single stress indicators and correction of GAA activity by rhGAA in 6 different PD fibroblasts. ROS production and lipid peroxidation inversely correlate with the GAA levels attained in cells after incubation with rhGAA for 4 h. The analysis of correlation was calculated, and the coefficient of Pearson is indicated.
- D, E
Spider web charts show the trend of the four variables in each of the 6 PD cell lines analyzed after 4 (D) and 24 h (E) of incubation with rhGAA and support the inverse relationships between the stress levels and correction of GAA activity. Multiple correlation coefficient was calculated; the increase in oxidized glutathione (GSSG level) that is complementary to the reduction of reduced glutathione (GSH) is indicated.
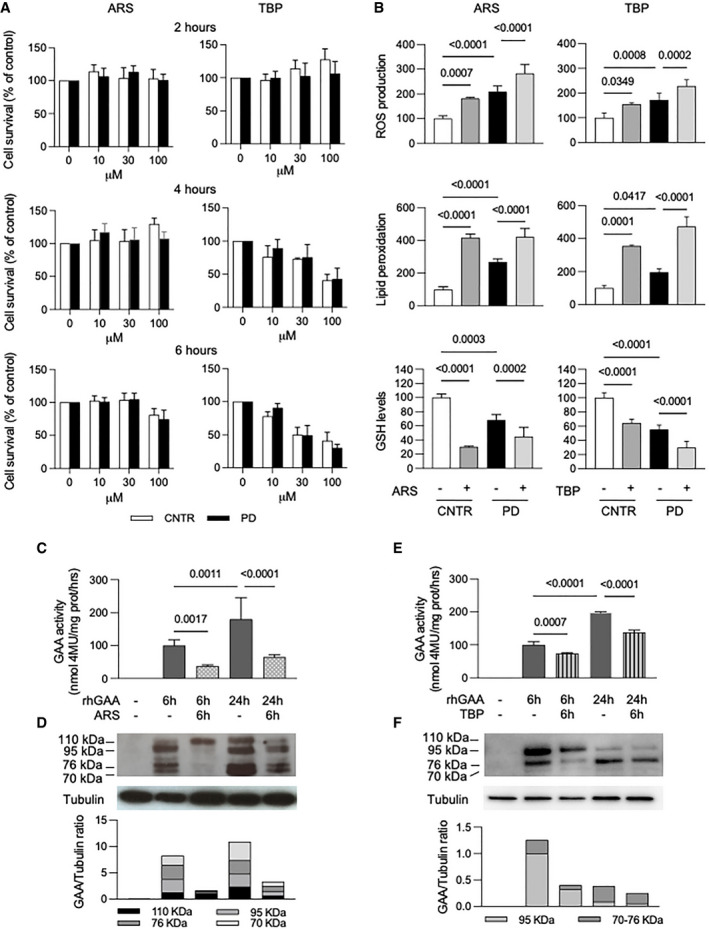
- A
Cell viability in control and PD fibroblasts (three different cell lines) measured by MTT assay in the presence of increased concentrations (0–100 µM) of either sodium arsenite (ARS) or tert‐butyl‐peroxide (TBP) at different time points. Data presented as a mean ± SD.
- B
ROS production, lipid peroxidation, and GSH levels in fibroblasts (3 different cell lines) after 6 h of treatment with 100 µM ARS and or 10 µM TBP. Both oxidative agents induced increase in oxidative stress in control (CNTR) and in PD cells. Data presented as a mean ± SD. Significance was calculated by one‐way ANOVA followed by Sidak's multiple comparisons test.
- C–F
(C, E) GAA activity in PD fibroblasts (3 different cell lines) treated with rhGAA (gray bars), with rhGAA+ARS (dotted bars) and rhGAA+TBP (stripped bars). Data presented as a mean ± SD. Significance was calculated by one‐way ANOVA followed by Tukey's multiple comparison test. (D, F) Western blot analysis of GAA isoforms and quantitative analysis of the different enzyme isoforms (in a representative patient). The results indicate that ARS and TBP treatment reduces the amount of rhGAA internalized by cells and its processing into the mature forms (most evident at 6 h).
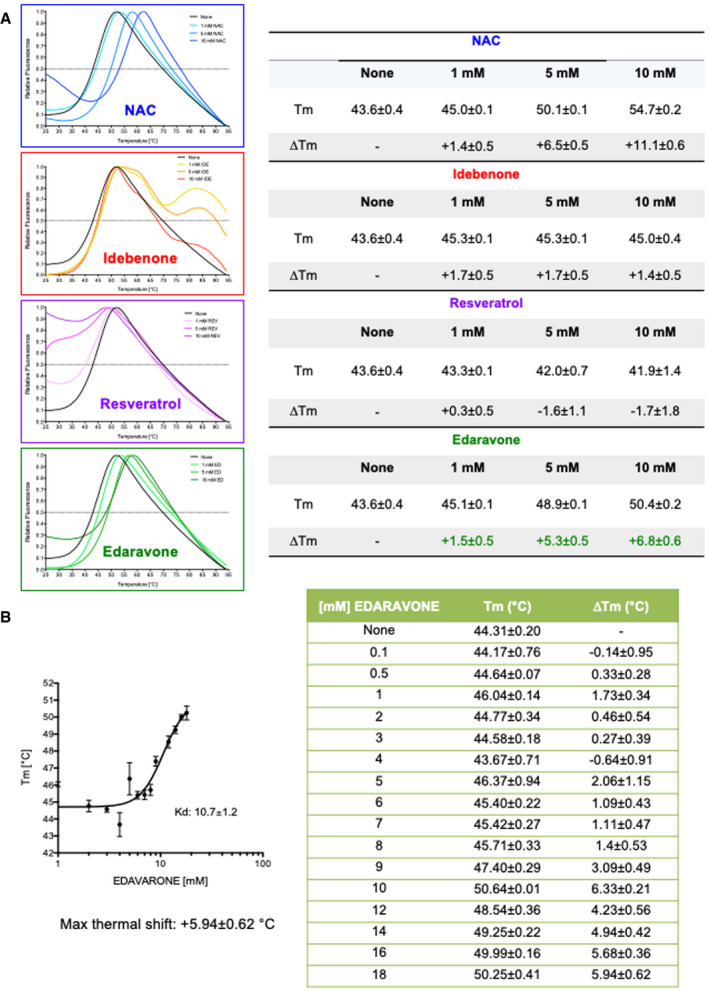
Thermal scans of rhGAA in the presence of the pharmacological chaperone NAC and antioxidants. The table shows the melting temperatures and their relative shifts in the absence and in the presence of antioxidants.
Determination of rhGAA‐edaravone interaction by differential scanning fluorimetry. The table shows the melting temperatures and their relative shifts in absence and in the presence of increasing concentrations of edaravone. Data presented as mean ± SD of data obtained in three different PD fibroblast cell lines. In each cell line, the analysis was performed in triplicate.
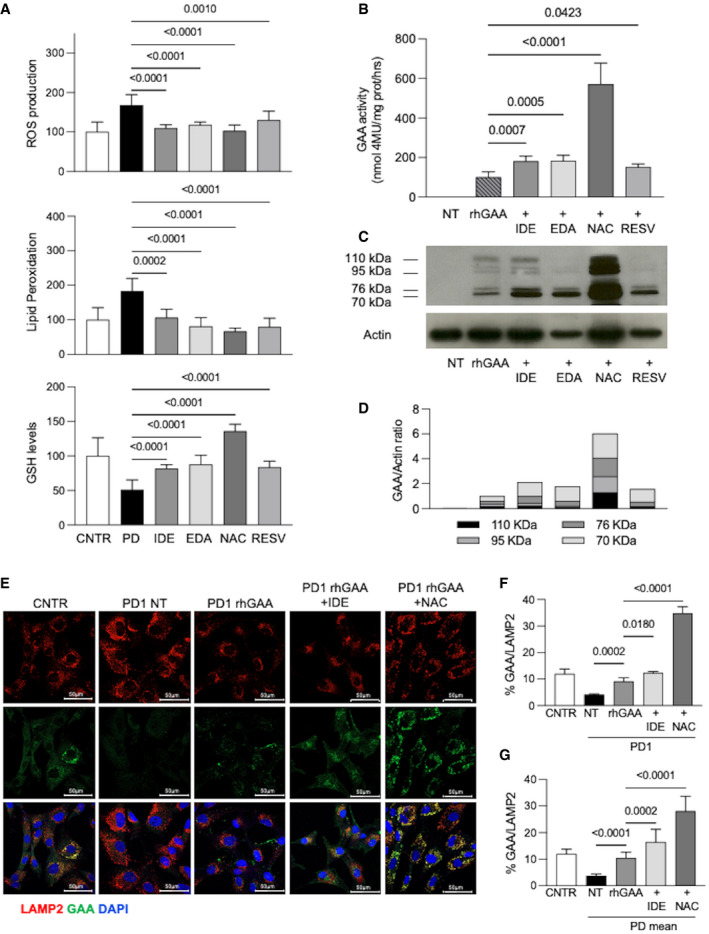
- A
Effect of antioxidants on ROS production, lipid peroxidation, and GSH levels in PD fibroblasts (three different cell lines for each treatment, each cell line assayed at least in duplicate). Cells were incubated for 24 h with idebenone (IDE) 0.5 µM; edaravone (EDA) 50 µM; N‐acetylcysteine (NAC) 0.5 mM; and resveratrol (RESV) 30 µM. Mean of control (CNTR) values was taken as equal to 100. The results are shown as mean ± SD.
- B
Relative GAA activity increase in PD fibroblasts (three different cell lines, each cell line assayed in duplicate) treated with rhGAA alone and with rhGAA in combination with antioxidants. The effects of rhGAA alone are taken as 100. The results are expressed as means ± SD.
- C, D
Western blot analysis of GAA isoforms and quantitative analysis of the different enzyme isoforms. The image shown is representative of three independent experiments in different PD patients.
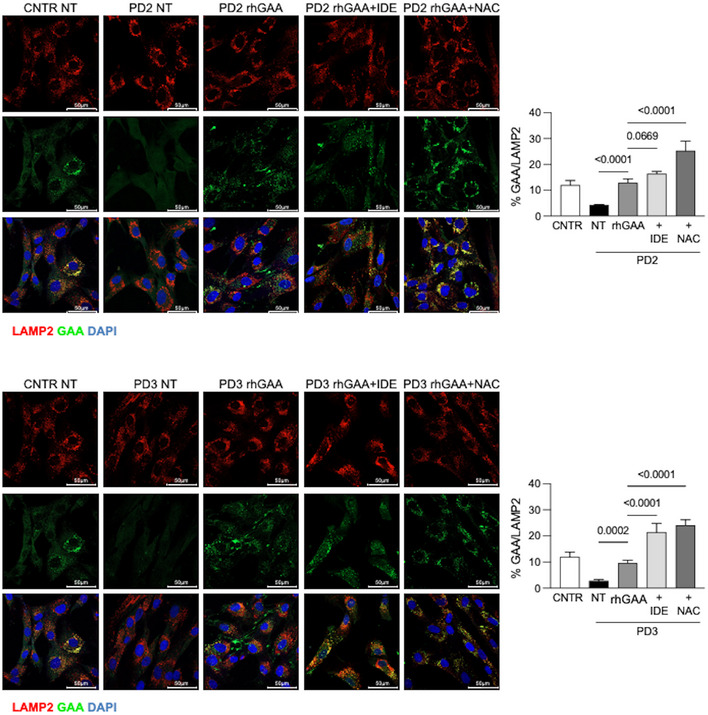
- E
Confocal immunofluorescence analysis of GAA and LAMP2; representative fibroblast cell lines (PD1). Confocal 63× images; Scale bar 50 µm; Brightness +20%. Data obtained in 2 other cell lines (PD2, PD3) are reported in Fig EV4.
- F
Percent of GAA/LAMP2 colocalization in PD1. The results are expressed as means ± SD of five images for each condition.
- G
Percent of GAA/LAMP2 colocalization; mean of the analyses performed in 3 PD fibroblast cell lines. For each PD patient, five images for each condition were quantified. The results are expressed as means ± SD of five images for each condition.
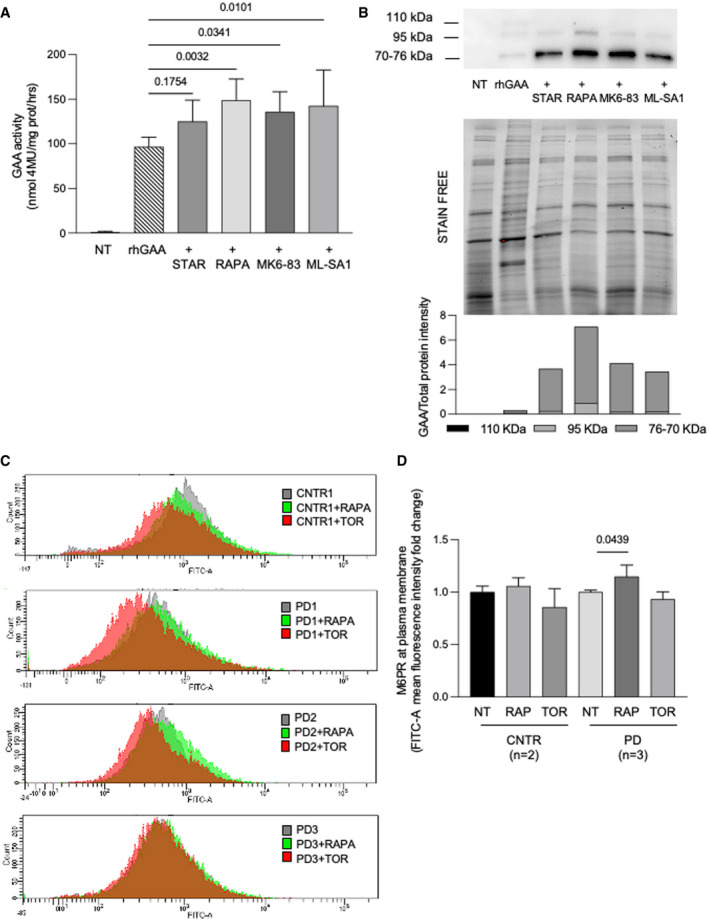
Relative GAA activity increase in PD fibroblasts (cell lines n = 3) treated with rhGAA alone and with rhGAA in combination with autophagy activators (starvation, STAR; rapamycin, RAPA; MK6‐83; ML‐SA1). The effects of rhGAA alone are taken as 100%. The results are expressed as means ± SD. ANOVA was applied followed by Dunnett’s multicomparison test.
Western blot analysis of GAA isoforms and quantitative analysis of the different enzyme isoforms (top) normalized to stain free (middle). All drugs improved the amounts of rhGAA‐related polypeptides and the processing of rhGAA into the active isoforms (76–70 kDa). The image shown is representative of at least three independent experiments in different PD patients.
FACS analysis of control and PD fibroblast shows the M6PR amount at plasma membrane before and after treatments with autophagy activators (rapamycin and torin1).
Mean of results obtained in control (n = 2 cell lines) and PD fibroblast (n = 3 cell lines). For each cell line, the amount of M6PR‐positive cells was normalized, taking that observed in non‐treated fibroblasts as 1. Data presented as mean ± SD. ANOVA was applied followed by Sidak's multicomparison test.
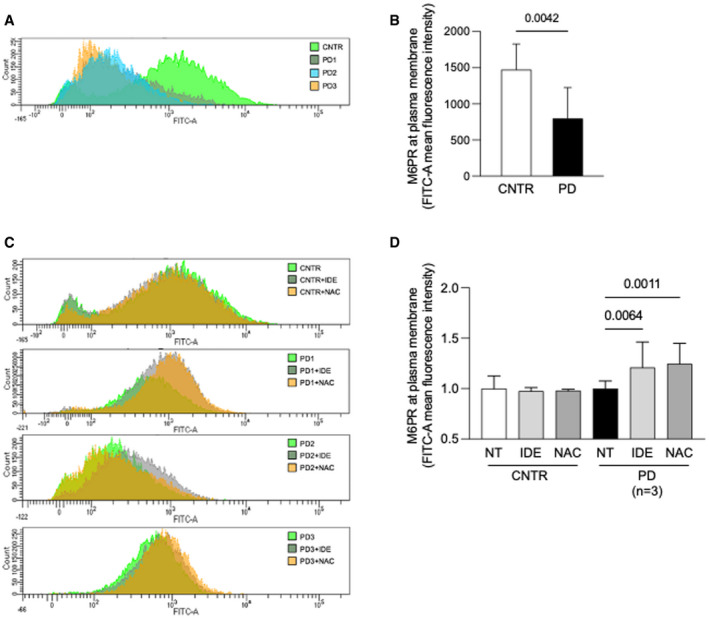
- A, B
Fluorescence activated cell sorter (FACS) analysis of control and PD fibroblasts (n = 3). A representative experiment (A) and mean values of three independent experiments (B). Data presented as mean ± SD. A Student’s t‐test was applied for statistical analysis.
- C
FACS analysis of control and PD fibroblast show the M6PR amount at plasma membrane before and after antioxidants treatments (NAC and IDE).
- D
Mean of results obtained in control (two cell lines in duplicate) and PD fibroblast (three different cell lines, each cell line tested in duplicate in three different experiments). For each cell line, the amount of M6PR‐positive cells was normalized, taking that observed in non‐treated fibroblasts as 1. Data presented as mean ± SD.
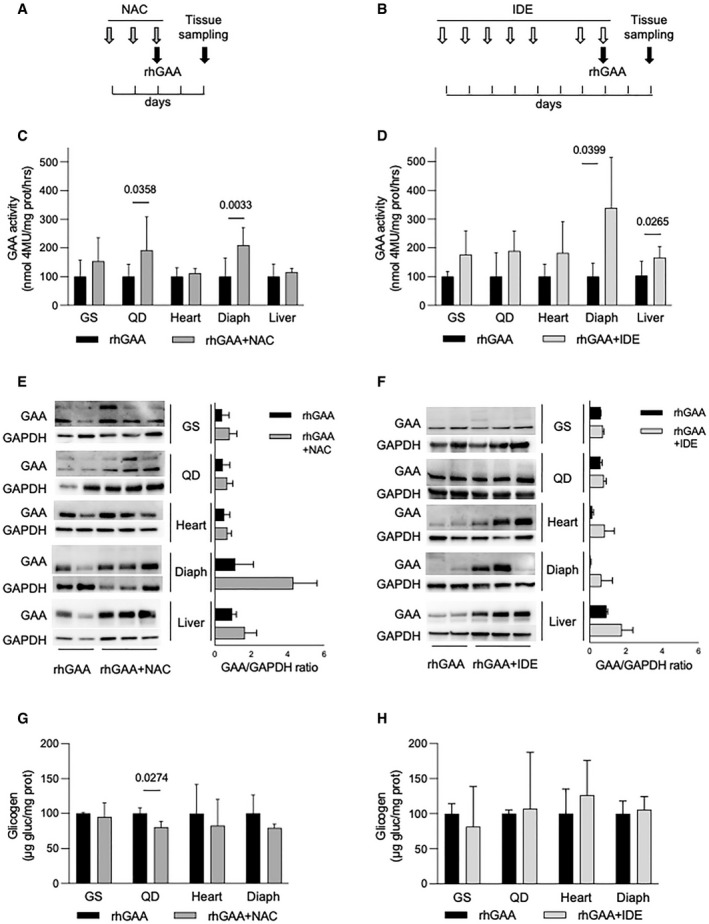
- A, B
Co‐dosing schedule of rhGAA and NAC (A) and rhGAA and IDE (B).
- C
GAA activity in tissues from the Gaa KO mouse after treatment with rhGAA alone (black bars) (n of mice = 10) and with co‐dosing of rhGAA and 2 g/kg/day NAC (n of mice = 7, dark gray bars). Data presented as mean ± SD. Values obtained in tissues treated with rhGAA alone for each treatment are taken as 100. A Student’s t‐test was applied to compare the results in each of the tissues.
- D
GAA activity in tissues from the Gaa KO mouse after treatment with rhGAA alone (black bars) (n of mice = 4) and with co‐dosing of rhGAA and 100 mg/kg/day IDE (n of mice = 6, light gray bars). Data presented as mean ± SD. Values obtained in tissues treated with rhGAA alone for each treatment are taken as 100. A Student’s t‐test was applied to compare the results in each of the tissues.
- E, F
Western blot analyses of GAA and quantitative analyses of the enzyme in representative tissues from the Gaa KO mouse after treatment with rhGAA alone (n of mice = 2) or in combination with NAC (n of mice = 3) (E) or IDE (n of mice = 3) (F). In F, data are presented as mean ± SD.
- G
Glycogen assay in tissues from the Gaa KO mouse after treatment with rhGAA alone (n of mice = 3) or in combination with NAC (n of mice = 3).
- H
Glycogen assay in tissues from the Gaa KO mouse after treatment with rhGAA alone (n of mice = 4) or in combination with IDE (n of mice = 6).
References
-
- Ballabio A, Bonifacino JS (2020) Lysosomes as dynamic regulators of cell and organismal homeostasis. Nat Rev Mol 21: 101–118 - PubMed
-
- van der Beek NA, van Capelle CI, van der Velden‐van Etten KI, Hop WC, van den Berg B, Reuser AJ, van Doorn PA, van der Ploeg AT, Stam H (2011) Rate of progression and predictive factors for pulmonary outcome in children and adults with Pompe disease. Mol Genet Metab 104: 129–136 - PubMed
-
- Buyse GM, Goemans N, van den Hauwe M, Thijs D, de Groot IJ, Schara U, Ceulemans B, Meier T, Mertens L (2011) Idebenone as a novel, therapeutic approach for Duchenne muscular dystrophy: results from a 12 month, double‐blind, randomized placebo‐controlled trial. Neuromuscul Dis 21: 396–405 - PubMed
Publication types
MeSH terms
Substances
LinkOut - more resources
Full Text Sources
Other Literature Sources
Medical
Molecular Biology Databases
