. 2021 Dec;12(1):8845-8862.
doi: 10.1080/21655979.2021.1987089.

Identification and validation of potential novel biomarkers for oral squamous cell carcinoma

Affiliations

Identification and validation of potential novel biomarkers for oral squamous cell carcinoma

Mengxue Zhang et al. Bioengineered. 2021 Dec.

Abstract

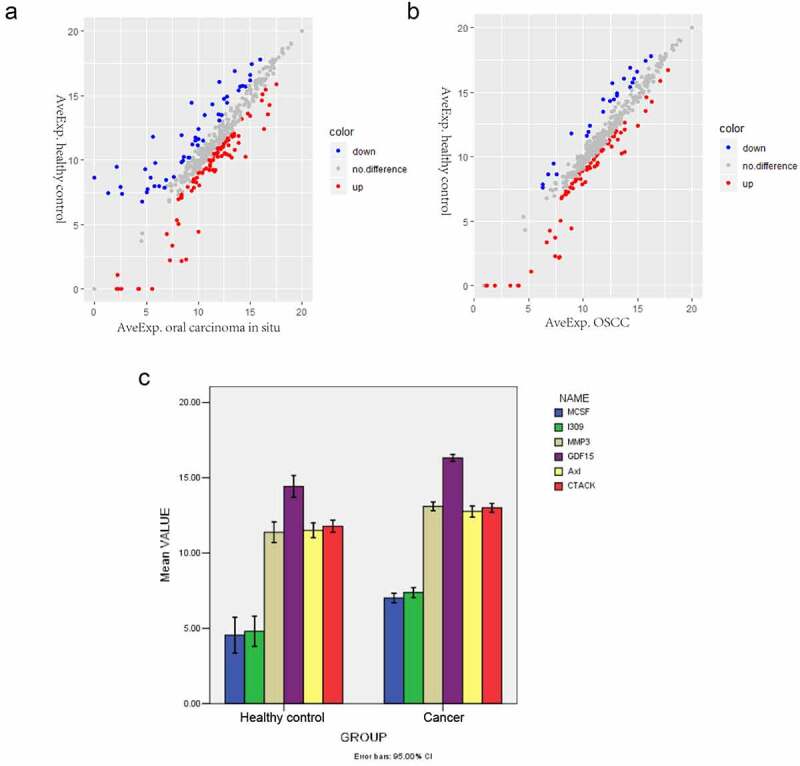
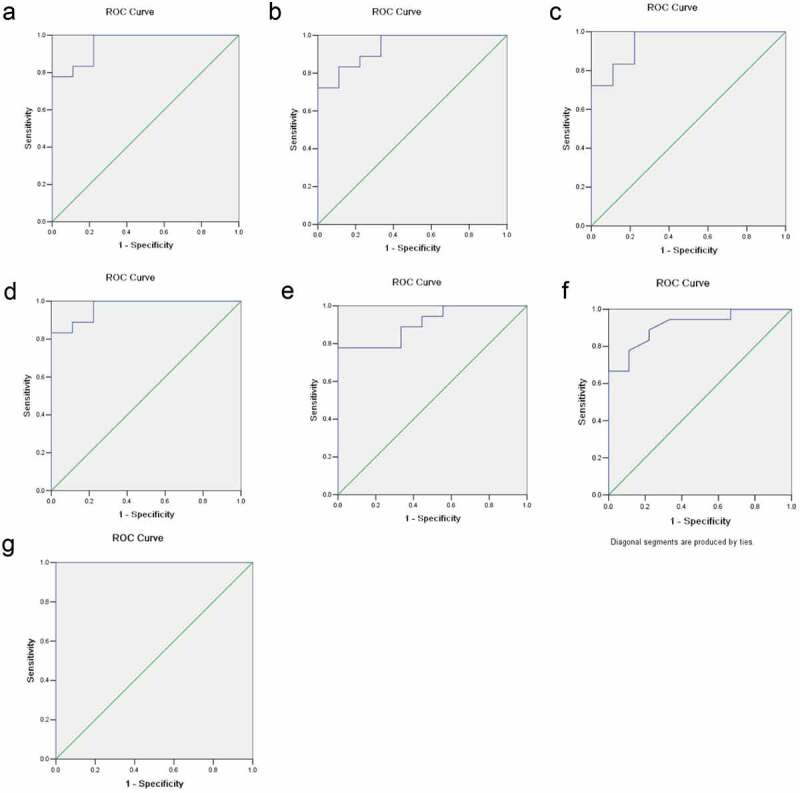
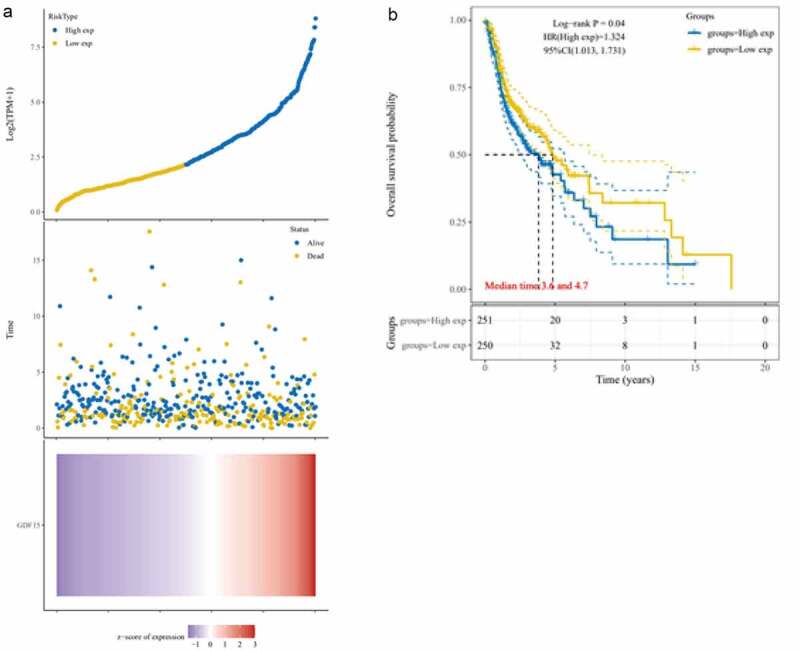
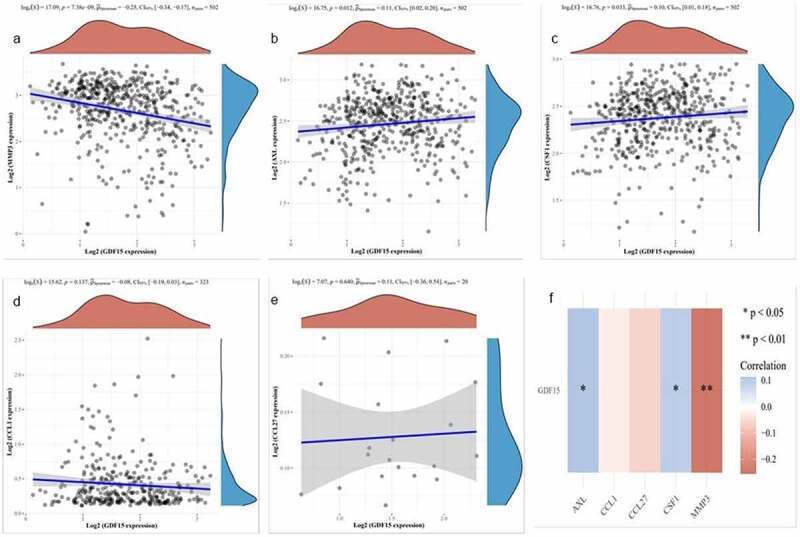
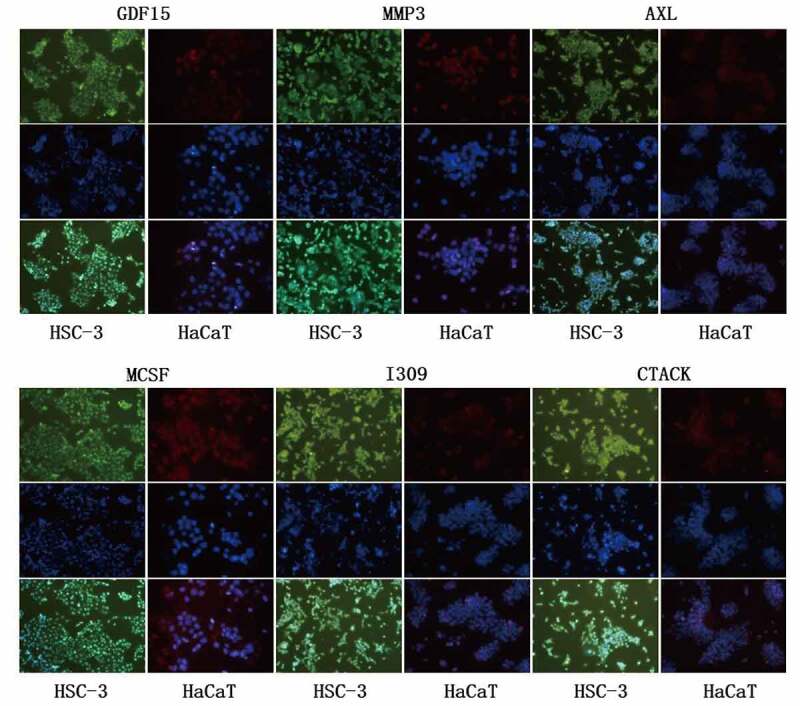
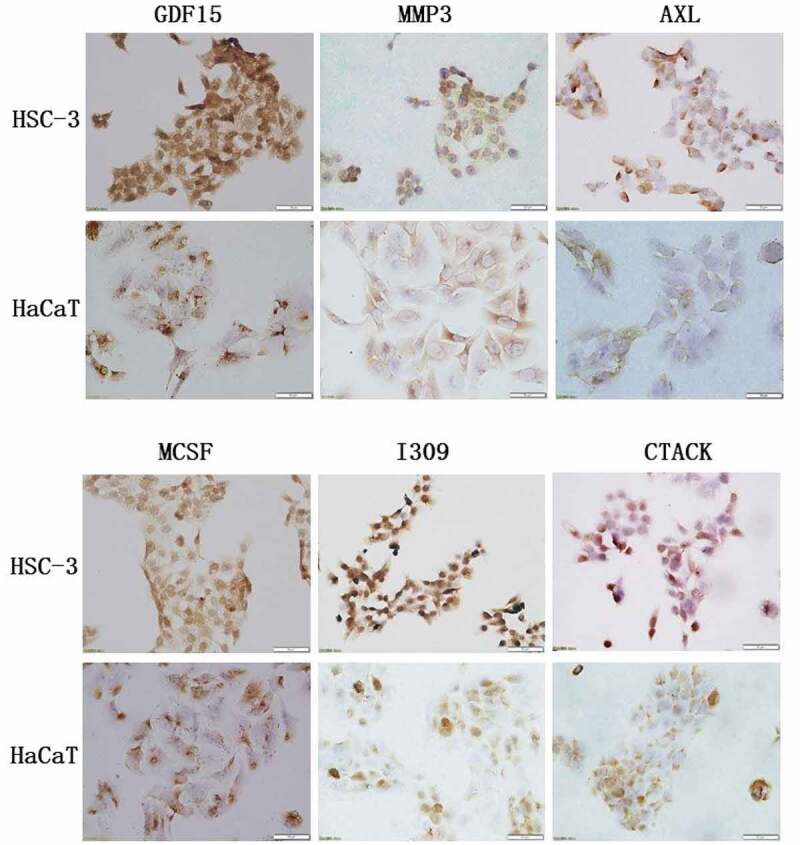
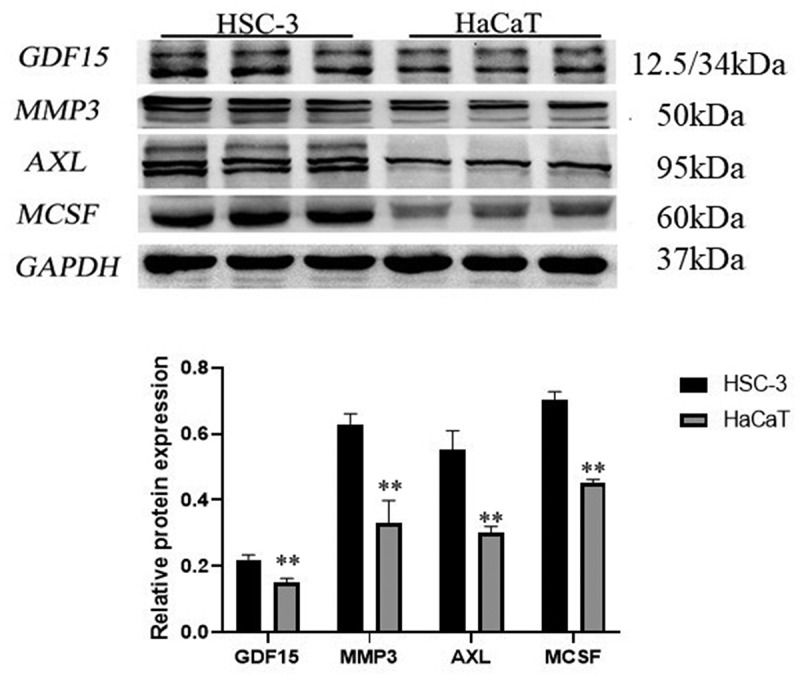
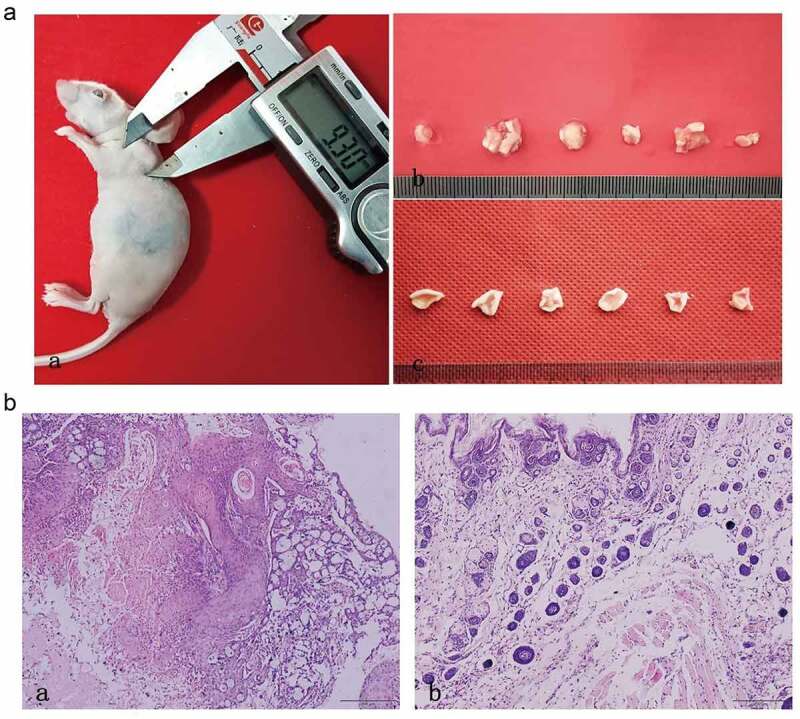
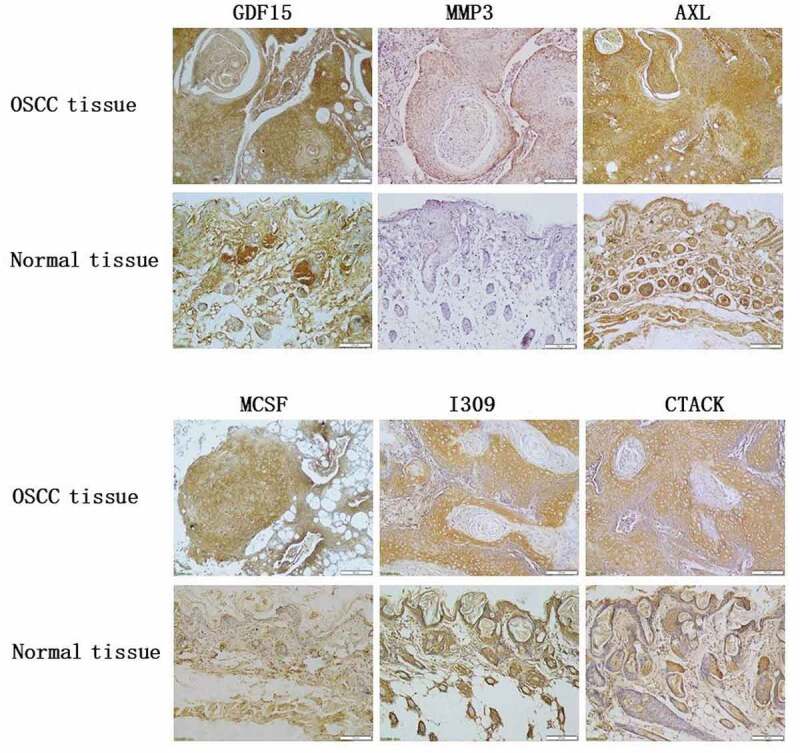
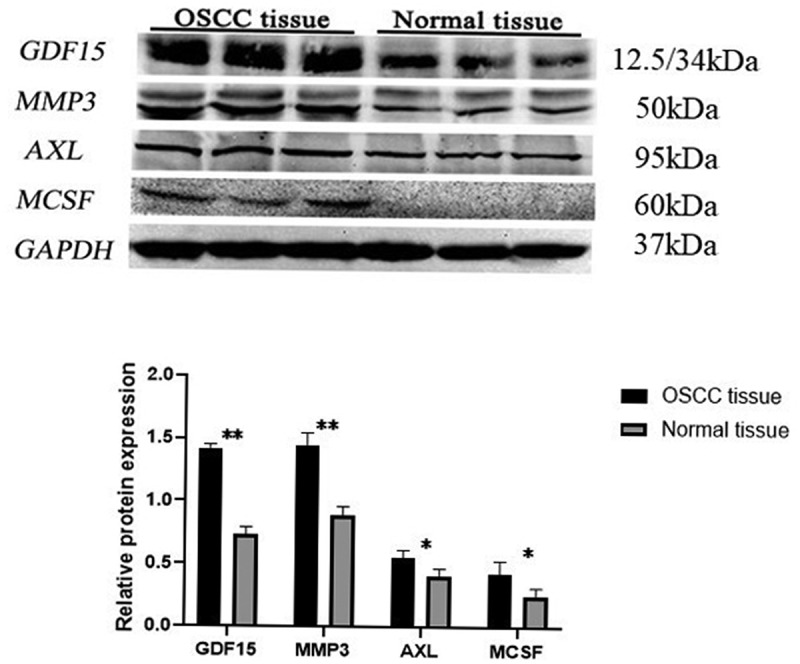
Our study aimed to explore potential new diagnostic biomarkers in patients with oral squamous cell carcinoma (OSCC) to find new target molecules involved in the progression of OSCC. Potential novel biomarkers of OSCC were identified using a protein microarray assay. Compared with the healthy control group, there were five proteins (I309, GDF15, AXL, MMP3, and CTACK) in the serum of in situ oral cancer group. However, there were four differentially expressed proteins (MCSF, I309, MMP3, and CTACK) in the serum of the OSCC group. Receiver operating characteristic (ROC) curve analysis results suggested that these six proteins (I309, GDF15, AXL, MMP3, CTACK, and MCSF) had diagnostic value for OSCC. Based on The Cancer Genome Atlas (TCGA) database, we found that only GDF15 expression was associated with the prognosis of OSCC. Subsequently, we verified the expression levels of six proteins in HSC-3 and HaCaT cells, and the results showed that the level of these six proteins was significantly higher in HSC-3 cells than in normal HaCaT cells. Similarly, in the OSCC nude mouse model, the expression levels of these proteins were significantly upregulated in OSCC tumor tissue compared to the normal tissue. GDF15, MMP3, AXL, MCSF, I309, and CTACK may be used as biomarkers for OSCC diagnosis and provide a novel study direction for the treatment of OSCC.

Keywords: Oral squamous cell carcinoma; biomarkers; diagnosis; protein microarray assay; serum.


Conflict of interest statement

No potential conflict of interest was reported by the author(s).

Figures

Figure 1.
Figure 1.
Differentially expressed proteins in oral carcinoma in situ and OSCC. (a) Scatter plots of differentially expressed proteins between the oral carcinoma in situ group and the healthy control group. Red and Blue color indicated up- and down-regulation, respectively. (b) Scatter plots of differentially expressed proteins between the OSCC and the healthy control group. Red and Blue color indicated up- and down-regulation, respectively. (c) Comparison of the mean values of the significantly changed proteins between the cancer group and control normal group. The x-axis shows healthy control and cancer groups and y-axis shows mean values
Figure 2.
Figure 2.
ROC curve analyses. The x-axis indicated specificity and y-axis indicated sensitivity. (a) GDF15. (b) MCSF. (c) I309. (d) MMP3. (f) CTACK. (e) AXL. (g) The combination of these six proteins
Figure 3.
Figure 3.
Kaplan-Meier analysis in TCGA dataset. (a) Risk score distribution, survival overview, and hierarchical clustering for OSCC patients in TCGA cohort. (b) The overall survival curves of the GDF15 high expression and low expression groups in TCGA cohort
Figure 4.
Figure 4.
Correlation analysis in TCGA dataset. (a) MMP3. (b) AXL. (c) MCSF. (d) I309. (e) CTACK. The X axis represents the expression distribution of GDF15, and the Y axis ordinate represents the expression distribution of MMP3, AXL, MCSF (CSF), I309 and CTACK, respectively. The density curve on the upper side is the distribution trend of GDF15, and the density curve on the right represents the distribution trend of MMP3, AXL, MCSF (CSF), I309 (CCL1) and CTACK (CCL27), respectively. (f) Correlation analysis between each gene and GDF15. Red represents a positive correlation, blue represents a negative correlation, the darker the color is, the stronger the correlation between the two, *P < 0.05, **P < 0.01
Figure 5.
Figure 5.
Immunofluorescence staining of key proteins in HSC-3 and HaCaT cells. The cytoplasm of HSC-3 cells was stained with green fluorescence, and the cytoplasm of HaCaT cells was stained with red fluorescence. The nuclei were stained blue with DAPI
Figure 6.
Figure 6.
Immunohistochemical analysis of key proteins in HSC-3 and HaCaT cells
Figure 7.
Figure 7.
Western blot of key proteins in HSC-3 and HaCaT cells. The expression level of GDF15, MCSF, I309, MMP3, CTACK and AXL was detected by western blotting and its quantification in HSC-3 and HaCaT cells
Figure 8.
Figure 8.
In vivo tumorigenesis assay and histological evaluation. (a) In vivo tumorigenesis assay: (a) Tumor formation of nude mouse in experimental group. (b) The general view of tissue sampling in nude mouse. (c) The general view of tissue sampling in control group. (B) Histological evaluation: (a) HE staining of OSCC tumor tissues in nude mouse. (b) HE staining of normal tissues in control group. (n = 6)
Figure 9.
Figure 9.
Immunohistochemical analysis of key proteins in OSCC nude mouse
Figure 10.
Figure 10.
Western blot of key proteins in OSCC nude mouse. The expression level of GDF15, MCSF, I309, MMP3, CTACK and AXL was detected by western blotting and its quantification in OSCC nude mouse tumor tissue and normal tissue

References

    1. Sathiyasekar AC, Chandrasekar P, Pakash A, et al. Overview of immunology of oral squamous cell carcinoma. J Pharm Bioallied Sci. 2016;8:S8–s12. - PMC - PubMed
    1. Huang GZ, Wu QQ, Zheng ZN, et al. Identification of candidate biomarkers and analysis of prognostic values in oral squamous cell carcinoma. Front Oncol. 2019;9:1054. - PMC - PubMed
    1. Cao R, Wu Q, Li Q, et al. A 3-mRNA-based prognostic signature of survival in oral squamous cell carcinoma. PeerJ. 2019;7:e7360. - PMC - PubMed
    1. Feng X, Luo Q, Wang H, et al. MicroRNA-22 suppresses cell proliferation, migration and invasion in oral squamous cell carcinoma by targeting NLRP3. J Cell Physiol. 2018;233(9):6705–6713. - PubMed
    1. Zhao X, Sun S, Zeng X, et al. Expression profiles analysis identifies a novel three-mRNA signature to predict overall survival in oral squamous cell carcinoma. Am J Cancer Res. 2018;8:450–461. - PMC - PubMed

Publication types

MeSH terms

Substances