. 2022 Mar;41(3):571-581.
doi: 10.1109/TMI.2021.3117246. Epub 2022 Mar 2.

Integrating Domain Knowledge Into Deep Networks for Lung Ultrasound With Applications to COVID-19

Integrating Domain Knowledge Into Deep Networks for Lung Ultrasound With Applications to COVID-19

Oz Frank et al. IEEE Trans Med Imaging. 2022 Mar.

Abstract

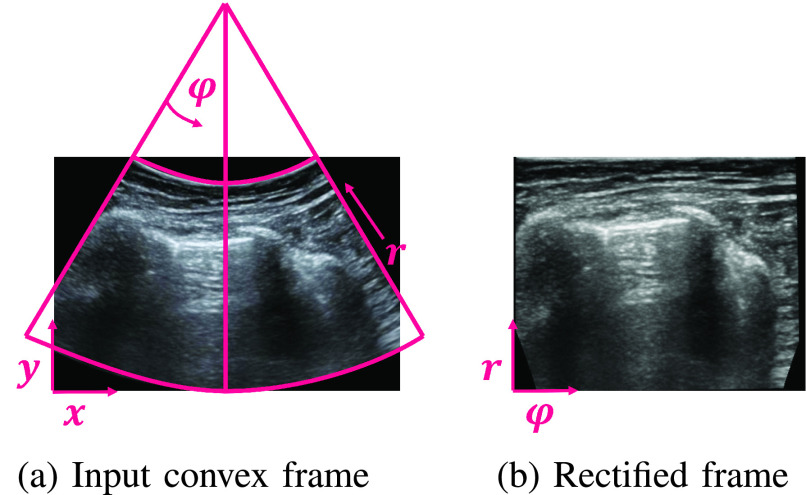
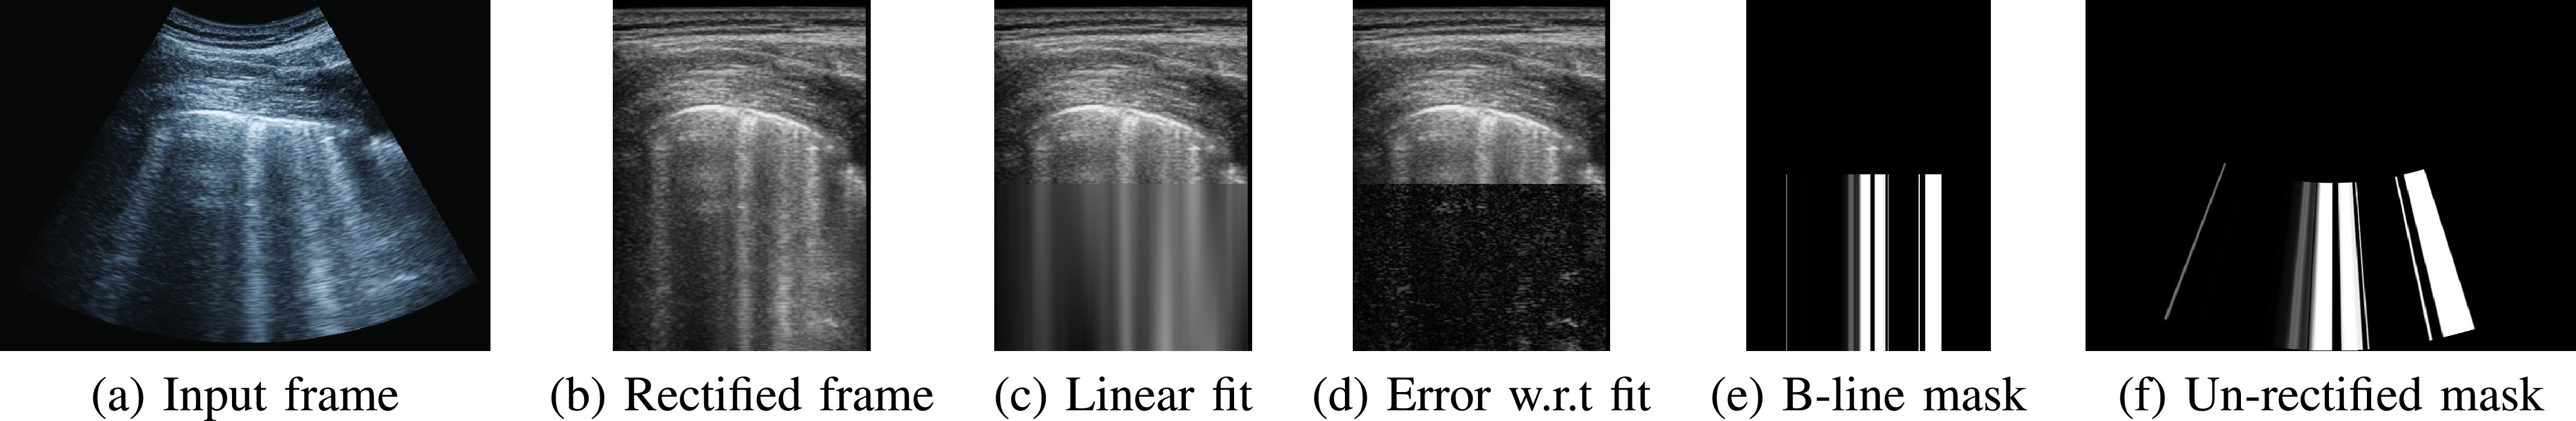
Lung ultrasound (LUS) is a cheap, safe and non-invasive imaging modality that can be performed at patient bed-side. However, to date LUS is not widely adopted due to lack of trained personnel required for interpreting the acquired LUS frames. In this work we propose a framework for training deep artificial neural networks for interpreting LUS, which may promote broader use of LUS. When using LUS to evaluate a patient's condition, both anatomical phenomena (e.g., the pleural line, presence of consolidations), as well as sonographic artifacts (such as A- and B-lines) are of importance. In our framework, we integrate domain knowledge into deep neural networks by inputting anatomical features and LUS artifacts in the form of additional channels containing pleural and vertical artifacts masks along with the raw LUS frames. By explicitly supplying this domain knowledge, standard off-the-shelf neural networks can be rapidly and efficiently finetuned to accomplish various tasks on LUS data, such as frame classification or semantic segmentation. Our framework allows for a unified treatment of LUS frames captured by either convex or linear probes. We evaluated our proposed framework on the task of COVID-19 severity assessment using the ICLUS dataset. In particular, we finetuned simple image classification models to predict per-frame COVID-19 severity score. We also trained a semantic segmentation model to predict per-pixel COVID-19 severity annotations. Using the combined raw LUS frames and the detected lines for both tasks, our off-the-shelf models performed better than complicated models specifically designed for these tasks, exemplifying the efficacy of our framework.


Figures

Fig. 1.
Fig. 1.
COVID-19 Severity scores. LUS frames exemplifying the severity score of from healthy (score formula image, left) to severe (score formula image, right). One can observe the peural line (green), A-lines (blue), subpleural consolidations (red) and vertical artifacts (e.g., B-lines and “white lung”) (yellow). While the pleural line and consolidations are anatomical features, the A-lines and vertical artifacts are sonographic echoes.
Fig. 2.
Fig. 2.
Our framework for integrating domain knowledge into deep neural networks (DNN) for LUS. Top: Input frame (a) is augmented with two additional channels containing LUS domain specific knowledge: (b) Automatically detected vertical artifacts (e.g., B-lines, “white lung”). (c) A signed distance mask from the pleural line. Bottom: The concatenation of these three channels (viewed as RGB image) are used as input for the DNN, enhancing the relevant frame regions.
Fig. 3.
Fig. 3.
Relative location and interpretation. Visually similar regions in LUS frames may account for very different findings if located above the pleural line (green arrow) or below it. For instance, the blue region below the pleural line shows A-lines, while the red region above the pleural line shows muscle tissue.
Fig. 4.
Fig. 4.
Rectifying convex frames. (a) Original frame in Cartesian formula image- formula image coordinates and the induced polar formula image- formula image coordinates. (b) The rectified frame according to its polar coordinate system. The transformation from one coordinate system to the other is invertible given the focal point of the transducer. This process is detailed in the Appendix.
Fig. 5.
Fig. 5.
Detecting vertical artifacts as bright columns. (a) Input. (b) Rectified convex frame according to its polar coordinates (Fig. 4). (c) Fit of the intensities of the lower half of each column with a linear function: formula image. (d) Error between the actual intensity and the linear fit. B-lines, “white lung” and similar vertical artifacts have low error. (e) Columns whose linear fit is above threshold formula image and the error is below threshold formula image are marked as vertical artifacts. (f) Un-rectify masks of convex frames back to their Cartesian coordinates.
Fig. 6.
Fig. 6.
Visualizing predictions using GradCAM. Visualizing regions in the frame that most influence the model’s prediction. Top row: Overlay of the raw input frame and our estimated pleural line and vertical artifacts masks. Middle row: visualization of correct classifications by our framework– when all input masks are used. Bottom row: visualization of misclassifications by – the same DNN architecture when only the raw input frame is used without the additional input masks.
Fig. 7.
Fig. 7.
Performance as a function of training set size: F1 scores of ResNet-18 backbone trained with all masks (blue), vs. trained using the raw frames only (orange), as a function of training set size. Extrapolating the trend shows the gap between the two approaches diminishes as significantly more training data is introduced.
Fig. 8.
Fig. 8.
Semantic segmentation: Pixels indicating score formula image are annotated blue, score formula image in yellow, score formula image in orange and score formula image are annotated red. Note that the gray pixels outside the LUS scan are ignored. (a) Input frame and the additional channels computed by our framework. (b) Semantic segmentation results of DeepLabV3++ model utilizing only the raw input frames (as in [23]), Cat. Dice formula image. (c) Segmentation results of the same DeepLabV3++ architecture utilizing all three input channels, Cat. Dice formula image. (d) Ground truth annotations.

References

    1. Bourcier J.-E.et al., “Performance comparison of lung ultrasound and chest X-ray for the diagnosis of pneumonia in the ED,” Amer. J. Emergency Med., vol. 32, no. 2, pp. 115–118, Feb. 2014. - PubMed
    1. Diniz J. O.et al., “Segmentation and quantification of COVID-19 infections in CT using pulmonary vessels extraction and deep learning,” Multimedia Tools Appl., vol. 80, no. 19, pp. 29367–29399, Aug. 2021. - PMC - PubMed
    1. Júnior D. A. D.et al., “Automatic method for classifying COVID-19 patients based on chest X-ray images, using deep features and PSO-optimized XGBoost,” Expert Syst. Appl., vol. 183, Nov. 2021, Art. no. 115452. - PMC - PubMed
    1. Lichtenstein D., Goldstein I., Mourgeon E., Cluzel P., Grenier P., and Rouby J.-J., “Comparative diagnostic performances of auscultation, chest radiography, and lung ultrasonography in acute respiratory distress syndrome,” J. Amer. Soc. Anesthesiol., vol. 100, no. 1, pp. 9–15, 2004. - PubMed
    1. Smargiassi A.et al., “Lung ultrasound for COVID-19 patchy pneumonia: Extended or limited evaluations?” J. Ultrasound Med., vol. 40, no. 3, pp. 521–528, 2020. - PubMed

Publication types