. 2022 Jan;28(1):259-269.
doi: 10.1109/TVCG.2021.3114786. Epub 2021 Dec 24.

Scope2Screen: Focus+Context Techniques for Pathology Tumor Assessment in Multivariate Image Data

Scope2Screen: Focus+Context Techniques for Pathology Tumor Assessment in Multivariate Image Data

Jared Jessup et al. IEEE Trans Vis Comput Graph. 2022 Jan.

Abstract

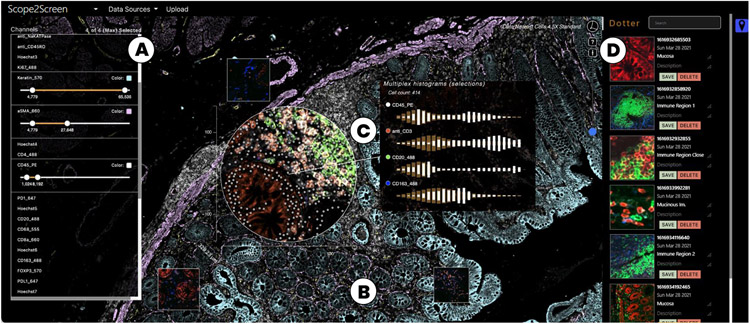
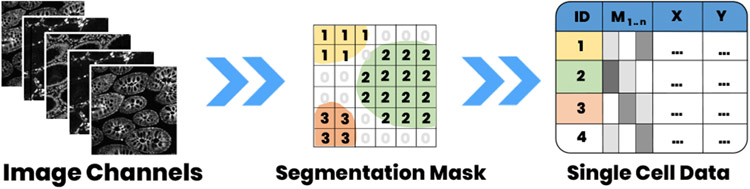
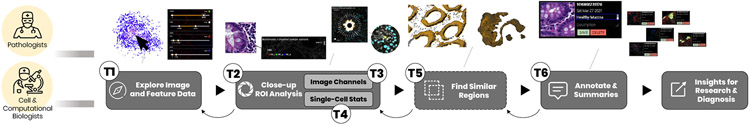
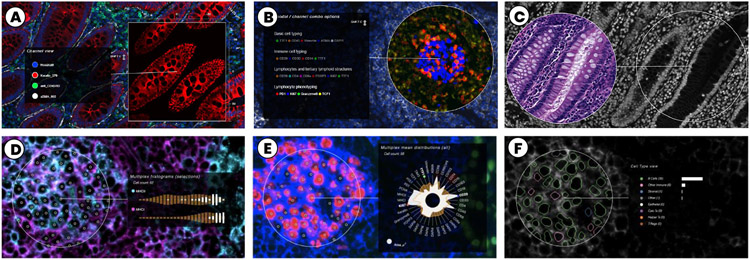
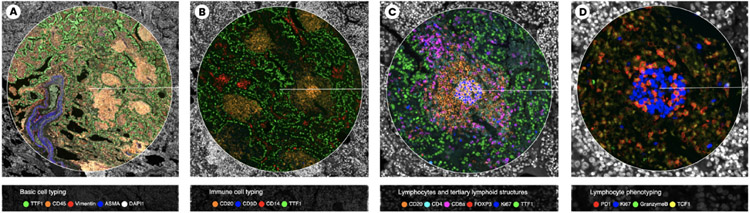
Inspection of tissues using a light microscope is the primary method of diagnosing many diseases, notably cancer. Highly multiplexed tissue imaging builds on this foundation, enabling the collection of up to 60 channels of molecular information plus cell and tissue morphology using antibody staining. This provides unique insight into disease biology and promises to help with the design of patient-specific therapies. However, a substantial gap remains with respect to visualizing the resulting multivariate image data and effectively supporting pathology workflows in digital environments on screen. We, therefore, developed Scope2Screen, a scalable software system for focus+context exploration and annotation of whole-slide, high-plex, tissue images. Our approach scales to analyzing 100GB images of 109 or more pixels per channel, containing millions of individual cells. A multidisciplinary team of visualization experts, microscopists, and pathologists identified key image exploration and annotation tasks involving finding, magnifying, quantifying, and organizing regions of interest (ROIs) in an intuitive and cohesive manner. Building on a scope-to-screen metaphor, we present interactive lensing techniques that operate at single-cell and tissue levels. Lenses are equipped with task-specific functionality and descriptive statistics, making it possible to analyze image features, cell types, and spatial arrangements (neighborhoods) across image channels and scales. A fast sliding-window search guides users to regions similar to those under the lens; these regions can be analyzed and considered either separately or as part of a larger image collection. A novel snapshot method enables linked lens configurations and image statistics to be saved, restored, and shared with these regions. We validate our designs with domain experts and apply Scope2Screen in two case studies involving lung and colorectal cancers to discover cancer-relevant image features.


Figures

Fig. 1:
Fig. 1:
Scope2Screen offers (A) Channel & color selection for multi-channel rendering. (B) A WebGL-based viewer capable of rendering 100+GB sized high-plexed and high-resolution (≥ 30k × 30k) image data in real-time. (C) Interactive lensing for close-up analysis - the lens shows a multi-channel immune setting that is different from the global context highlighting basic tissue composition. (D) Dotter panel - stores and organizes snapshots of annotated ROIs to filter, restore, navigate to the image location.
Fig. 2:
Fig. 2:
Our histological tissue image data consists of a multi-channel image stack, a segmentation mask, and extracted tabular marker intensity values (arithmetic mean) for each cell. The tabular data is linked via cell ID and X,Y position.
Fig. 3:
Fig. 3:
The pathological workflow starts with exploratory navigation in the image (T1). ROIs are magnified, measured, and analyzed (T2) by switching and combining image channels (T3) and investigating single-cell marker statistics (T4). Identified regions often appear in patterns across the image. Finding such similar regions (T5) can ease manual search. ROIs are then annotated (T6). These steps build an iterative process where annotations are refined, and further areas are explored. The ROIs are stored or exported to discuss with colleagues or for examination.
Fig. 4:
Fig. 4:
Top: Settings for channel analysis: (A) Single channel option, out of three in the context. (B) Multi-channel lens. (C) Split-screen lens enabling juxtaposed comparison of the same area with different multi-channel settings (here CyCIF-DNA and H&E-RGB). Bottom: Feature augmentation: (D) Single-cell histograms for detailed vertical comparison of selected cell marker distribution (channel-based rendering); (E) Radial single-cell plot a for compact summary of cell marker distribution; (F) Segmentation, cell types and counts showing classification results.
Fig. 5:
Fig. 5:
Magnification options: (A) normal magnifier; (B) fisheye, introducing distortion with an interpolated spherical shape; (C) plateau with 75% preserved resolution and 25% compressed interpolation. High-resolution image quality within the zoom area is achieved by accessing image data from more detailed layers in the image pyramid.
Fig. 6:
Fig. 6:
HistoSearch allows to find regions similar to those covered by the lens, taking into account activated channels. Top: HistoSearch is applied at different scales to find mucosal regions. The search works in two settings, for the current viewport (computation time ≈ 1 second for Full HD) and for the whole image in the highest resolution. Bottom: The spatial histogram similarity search consists of four steps (Sec. 5.3 for details).
Fig. 7:
Fig. 7:
The rich snapshot and annotation process. (A) During close-up analysis, the user focuses on an ROI and takes a snapshot. (B) The snapshot is annotated with title and description. (C) The Dotter panel links snapshots to the image space (left). Lens-settings such as channel combination and colors are preserved. (D) Annotated regions can be reactivated as lenses to explore further or fine-tune.
Fig. 8:
Fig. 8:
Use Case 1. Rich snapshots capture ROIs and important insights: (A) Broad population; (B) Healthy tissue; (C) Immune cell rich; (D) Tumor budding ; (E) Tumor suppression; (F) H&E - lymphocyte.
Fig. 9:
Fig. 9:
Use Case 2, Multi-channel lenses in 4 settings: (A) ‘Basic Cell Typing’ shows tissue composition - stromal, immune, and cancer cells. The dense structure is a result of tumor growth in the lung; (B) ‘Immune Cell Typing’ distinguishes between immune and non-immune cells for a broad overview of immune regions (orange); (C) ‘Lymphocytes and TLS’ combines CD-channels reveal distinct immune types, e.g., cytotoxic T cells attacking the cancer; (D) ‘Lymphocyte Phenotyping’ for finer distinction, showing proliferating B-cells for antibody production (in blue).

References

    1. Lensing, an npm package, https://www.npmjs.com/package/lensing, last accessed: 8/06/2021.
    1. The OME-TIFF format — OME Data Model and File Formats 5.6.3 documentation -https://docs.openmicroscopy.org/ome-model/5.6.3/ome-tiff/, last accessed: 3/31/2021.
    1. OpenSeadragon - An open-source, web-based viewer for high-resolution zoomable images - https://openseadragon.github.io, last accessed: 3/31/2021.
    1. Scope2screen codebase, https://github.com/labsyspharm/scope2screen, last accessed: 8/06/2021.
    1. Sliding window histogram, skimage: image processing in python, v0.18.0 docs - scikit-image.org/docs/stable/auto_examples/features_detection/plot_windo..., last accessed 3/31/2021.

Publication types