. 2021 Oct 14;64(19):14809-14821.
doi: 10.1021/acs.jmedchem.1c01342. Epub 2021 Oct 4.

Inhibitor Combinations Reveal Wiring of the Proteostasis Network in Prostate Cancer Cells

Affiliations

Inhibitor Combinations Reveal Wiring of the Proteostasis Network in Prostate Cancer Cells

Arielle Shkedi et al. J Med Chem. .

Abstract

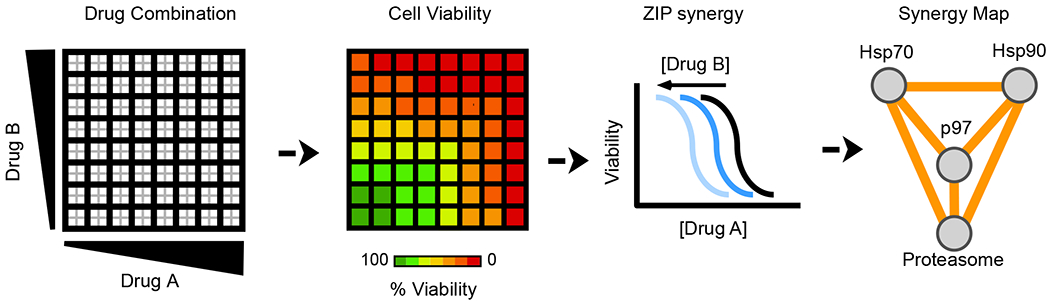
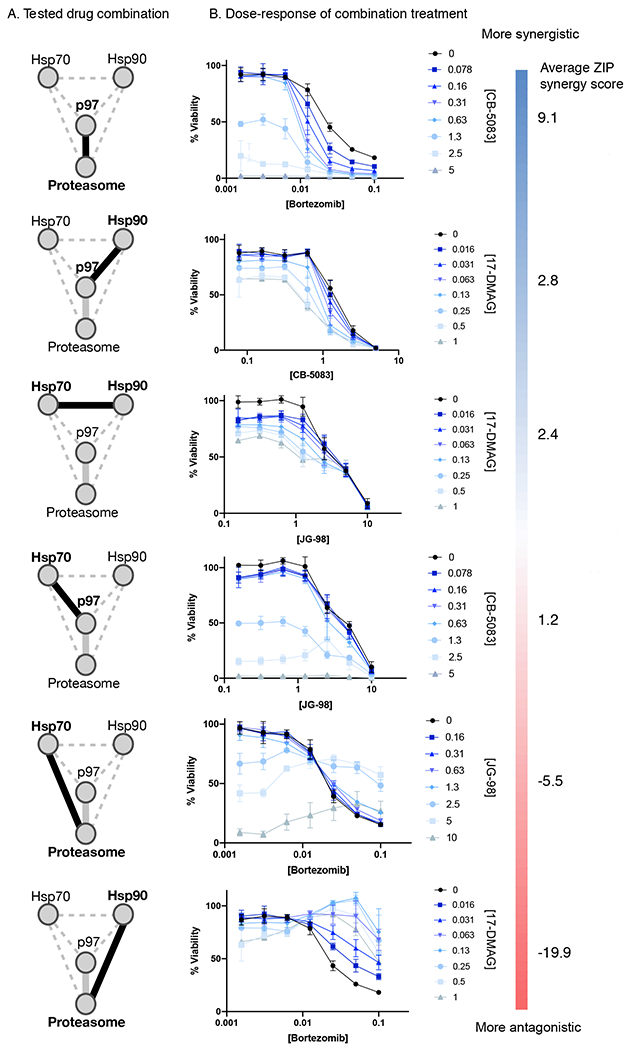
The protein homeostasis (proteostasis) network is composed of multiple pathways that work together to balance protein folding, stability, and turnover. Cancer cells are particularly reliant on this network; however, it is hypothesized that inhibition of one node might lead to compensation. To better understand these connections, we dosed 22Rv1 prostate cancer cells with inhibitors of four proteostasis targets (Hsp70, Hsp90, proteasome, and p97), either alone or in binary combinations, and measured the effects on cell growth. The results reveal a series of additive, synergistic, and antagonistic relationships, including strong synergy between inhibitors of p97 and the proteasome and striking antagonism between inhibitors of Hsp90 and the proteasome. Based on RNA-seq, these relationships are associated, in part, with activation of stress pathways. Together, these results suggest that cocktails of proteostasis inhibitors might be a powerful way of treating some cancers, although antagonism that blunts the efficacy of both molecules is also possible.


Conflict of interest statement

Conflict of Interest Disclosure. J.E.G. is an inventor on patents associated with Hsp70 inhibitors and their use in cancer.

Figures

Figure 1.
Figure 1.
Proteostasis inhibitors, targeting multiple nodes of the proteostasis network, have anti-proliferative effects in 22Rv1 prostate cancer cells. A. A subset of the proteostasis network is shown, highlighting the connections between the major nodes: Hsp70, Hsp90, p97, and the proteasome. Together, these factors guide protein folding and turnover, working together to mediate client “hand-off”. B. Inhibitors of proteostasis nodes limit growth of 22Rv1 cells. In this study, four inhibitors were used: JG-98 (Hsp70 inhibitor), 17-DMAG (Hsp90 inhibitor), bortezomib (proteasome inhibitor) and CB-5083 (p97 inhibitor). Cells were incubated with the indicated compound for 72 hours, and viability measured via Cell Titer Glo (see Methods). Results are the average of experiments performed in quadruplicate and the error bars represent SD. Some error bars are smaller than symbols.
Figure 2.
Figure 2.
Workflow for the measurement of additivity, synergy or antagonism amongst proteostasis inhibitors. Briefly, cells are aliquoted to 384-well plates and allowed to adhere for one day. Then, two drugs (A and B) are added in an 8x8 matrix format, with 7 doses per compound, using 2-fold dilutions (see Methods for tested concentrations) and a DMSO solvent control. Treatments were performed in quadruplicate, with 4 wells per each dose combination (grey squares). After 72-hours of treatment, cell viability was measured using Cell Titer Glo, and synergy determined through the ZIP synergy model. Drug-combination screens were performed twice per cell line, and ZIP synergy score was averaged between replicates. Under this model, addition of Drug B reducing the potency of Drug A (blue lines) would be considered synergy. ZIP scores around zero (between 1.5 and −1.5) were considered additive, while scores above 1.5 were considered synergistic and those below −1.5 were considered antagonistic. To map these relationships onto the proteostasis subnetwork (see Fig 1A), we plotted the nodes and created lines between them to indicate whether the ZIP synergy score was additive, synergistic or antagonistic for each tested cell line (termed a Synergy Map).
Figure 3.
Figure 3.
Combinations were either additive, synergistic or antagonistic in 22Rv1 cells. A. For each combination, a black line and bolded text indicates the tested nodes on the Synergy Map in the highlighted adjacent dose-response panel. B. Dose-response curves from each combination are used to highlight additivity, synergy or antagonism. In each graph, the single-agent (black) and combination treatments (blue curves) are shown. Curves are arranged from top to bottom from the most synergistic to the most antagonistic, with the average ZIP synergy scores shown. For the full matrix landscape of the cell viability and synergy results, see Figure S1. All concentrations are in micromolar.
Figure 4.
Figure 4.
Some combinations reduce androgen receptor levels, but others do not. Effects of proteostasis inhibitor combinations on AR levels in 22Rv1 cells following 6-hour treatment. A. Treatment with the Hsp90 inhibitor 17-DMAG reduces the levels of full length AR, and Hsp70 inhibitor JG-98 treatment reduces levels of both AR and ARv in 22Rv1 cells after 6 hours. The combination was effective at reducing both proteins. B. Neither the p97 nor proteasome inhibitor, or their combination, had an effect on AR or ARv levels at 6 hours. Western blots are representative of experiments performed in triplicate. The blots were quantified in NIH Image J and the average density adjusted to the loading control and DMSO treatment was plotted on the right. Error bars represent SD.
Figure 5.
Figure 5.
RNA-seq data highlights differences in gene expression following single-agent and combination proteostasis inhibitor treatment. 22Rv1 cells were treated with indicated compounds for 6 hours, after which RNA-seq was performed (see Methods). The top 100 variably expressed genes across all conditions were clustered and further analyzed.
Figure 6.
Figure 6.
RNA-seq studies and protein level validation highlight differences in activation of stress response pathways between single-agent and combination proteostasis inhibitor treatments. A. Gene ontology (GO) analysis of clusters 1 and 2 from top variably expressed genes (see Figure 5). Top 8 most significantly enriched GO terms are shown. B. BiP, Hsc70, and Hsp72 levels were probed via Western blot following 24 hours of compound treatment (see Methods for concentrations used). Protein levels at 24 hours closely match transcriptomic data and are differentially expressed across single-agent and combination proteostasis inhibition. Results are representative of experiments performed in triplicate.
Figure 7.
Figure 7.
Expanded screens in additional prostate cancer cell lines reveals both similarities and differences in their responses to combinations of proteostasis inhibitor treatment A. Synergy maps depicting the relationship between proteostasis nodes from the drug-combination screens. Synergy is blue, antagonism is orange, and additivity is gray. Cutoffs defined in Figure 2 were applied here. Screens were performed as described in Figure 2, with each dose-combination performed in quadruplicate. Each screen was performed twice per cell line, and synergy scores were averaged. B. Representative dose-response curves from the antagonistic combination of proteasome-Hsp90 inhibitors. In each example, the proteasome inhibitor (bortezomib) alone is shown in black, while the combinations with the Hsp90 inhibitor 17-DMAG are shown with blue lines. Results are the average of quadruplicate and error bars are SD. Some error bars are smaller than the symbols. C. Hsp72 is upregulated following Hsp90 and proteasome inhibition in all of the cell lines tested, by Western blot. Results are representative of experiments performed in triplicate. See Methods for the concentrations used.

Similar articles

Cited by

References

    1. Powers ET; Morimoto RI; Dillin A; Kelly JW; Balch WE Biological and chemical approaches to diseases of proteostasis deficiency. Annu Rev Biochem 2009, 78, 959–991 - PubMed
    1. Voisine C; Pedersen JS; Morimoto RI Chaperone networks: Tipping the balance in protein folding diseases. Neurobiol Dis 2010, 40, 12–20 - PMC - PubMed
    1. Labbadia J; Morimoto RI The biology of proteostasis in aging and disease. Annu Rev Biochem 2015, 84, 435–464.4539002 - PMC - PubMed
    1. Freilich R; Arhar T; Abrams JL; Gestwicki JE Protein-protein interactions in the molecular chaperone network. Acc Chem Res 2018, 51, 940–949 - PMC - PubMed
    1. Liu Y; Ye Y Proteostasis regulation at the endoplasmic reticulum: A new perturbation site for targeted cancer therapy. Cell Research 2011, 21, 867–883 - PMC - PubMed

Publication types