

Quantification of volumetric morphometry and optical property in the cortex of human cerebellum at micrometer resolution
- PMID: 34607020
- PMCID: PMC8603939
- DOI: 10.1016/j.neuroimage.2021.118627
Quantification of volumetric morphometry and optical property in the cortex of human cerebellum at micrometer resolution
Abstract
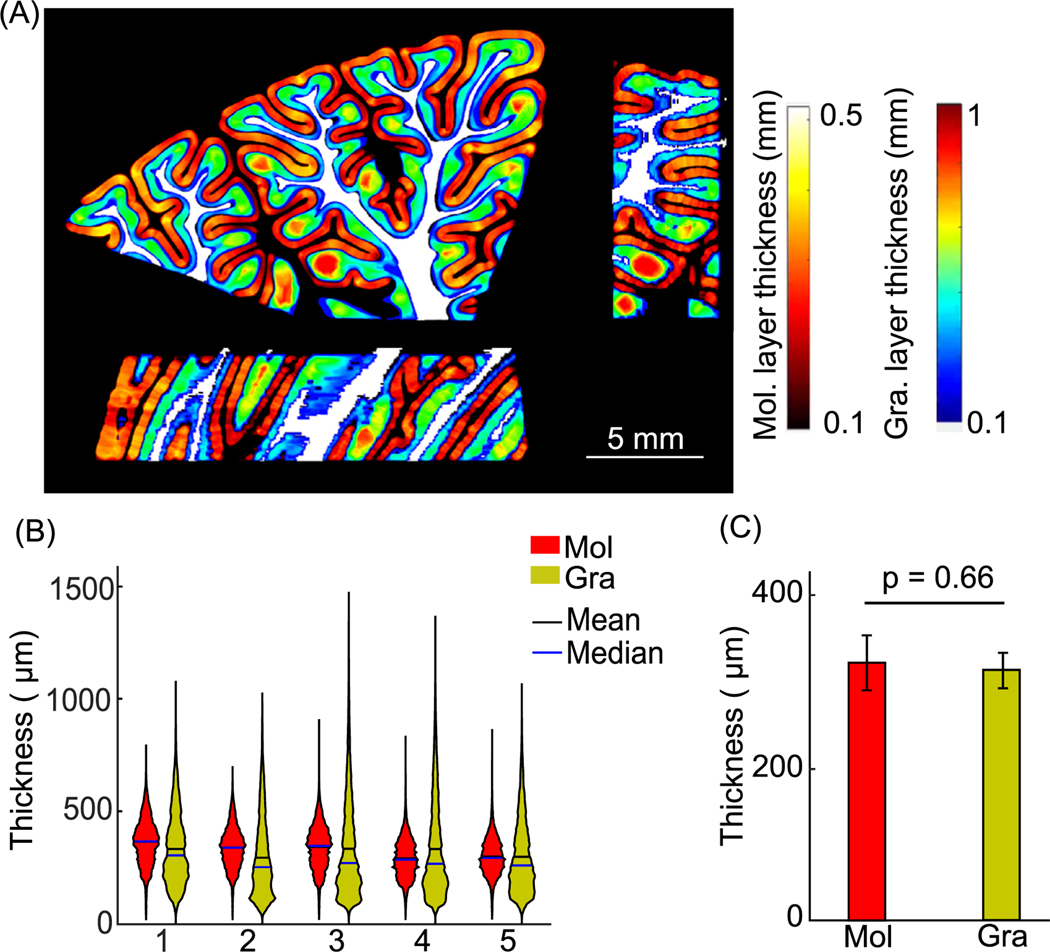
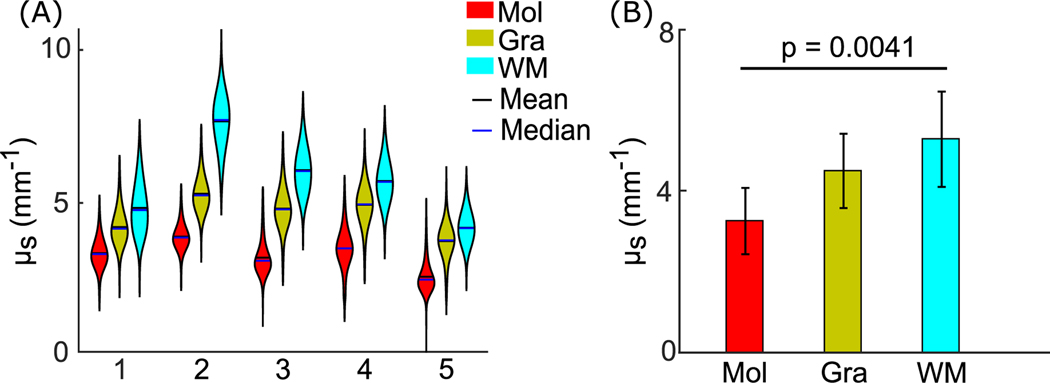
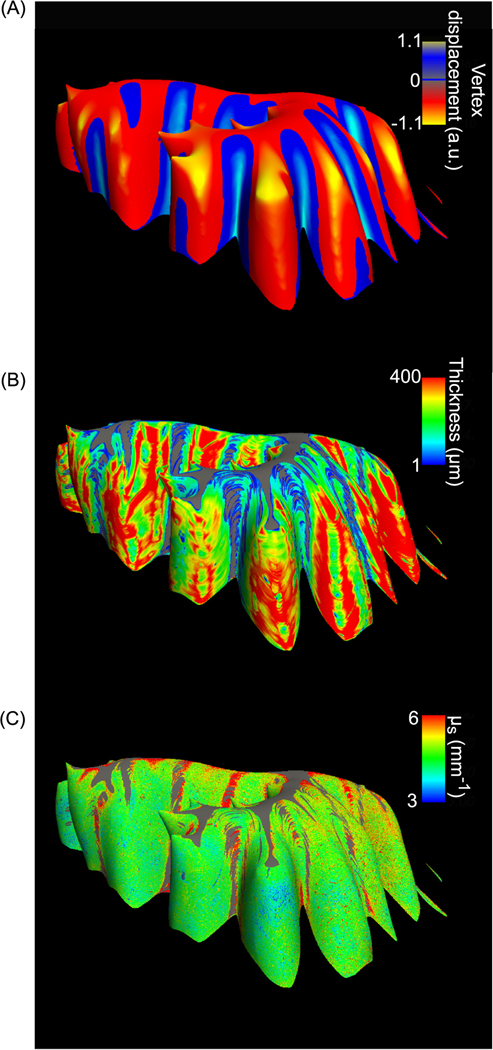
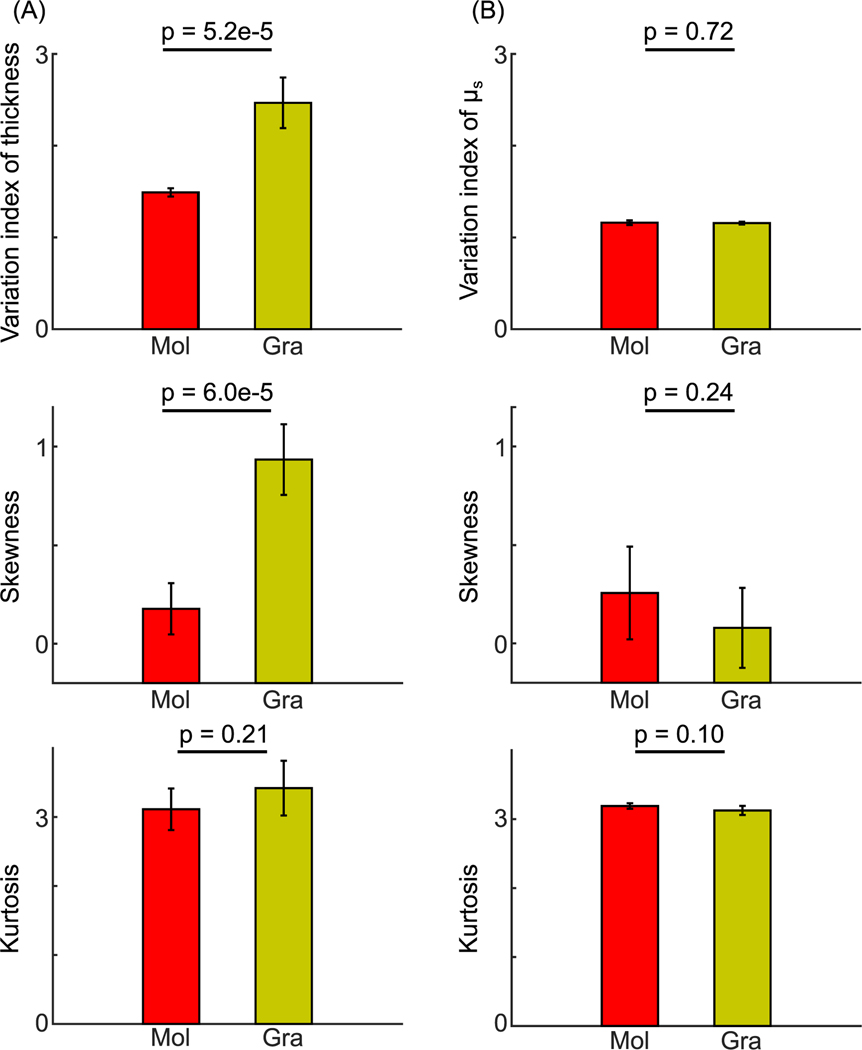
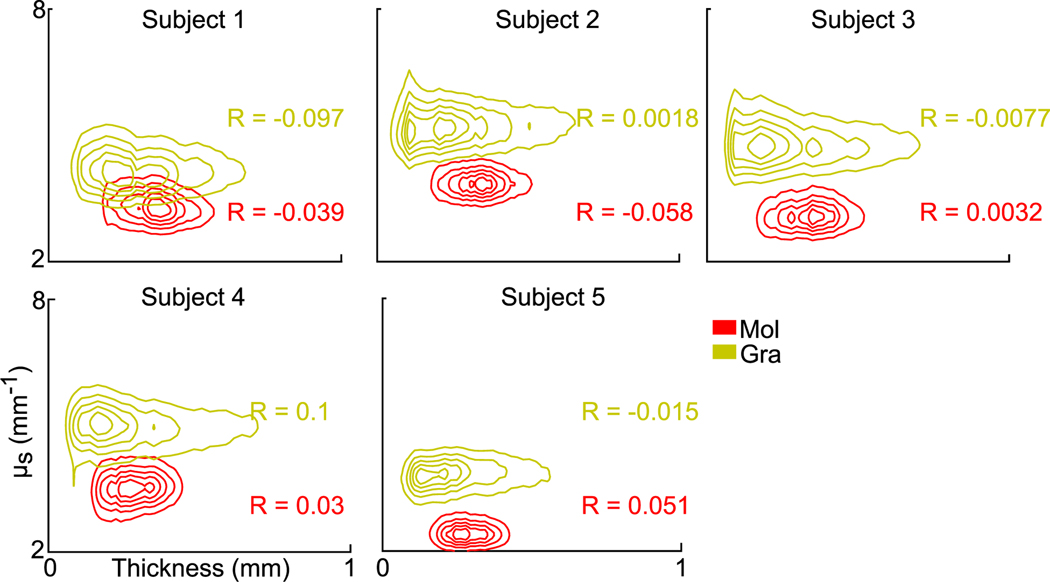
The surface of the human cerebellar cortex is much more tightly folded than the cerebral cortex. Volumetric analysis of cerebellar morphometry in magnetic resonance imaging studies suffers from insufficient resolution, and therefore has had limited impact on disease assessment. Automatic serial polarization-sensitive optical coherence tomography (as-PSOCT) is an emerging technique that offers the advantages of microscopic resolution and volumetric reconstruction of large-scale samples. In this study, we reconstructed multiple cubic centimeters of ex vivo human cerebellum tissue using as-PSOCT. The morphometric and optical properties of the cerebellar cortex across five subjects were quantified. While the molecular and granular layers exhibited similar mean thickness in the five subjects, the thickness varied greatly in the granular layer within subjects. Layer-specific optical property remained homogenous within individual subjects but showed higher cross-subject variability than layer thickness. High-resolution volumetric morphometry and optical property maps of human cerebellar cortex revealed by as-PSOCT have great potential to advance our understanding of cerebellar function and diseases.
Keywords: Cell density; Cerebellum; Cross-subject variability; Layer thickness; Myelin; Polarization-sensitive optical coherence tomography.
Copyright © 2021 The Authors. Published by Elsevier Inc. All rights reserved.
Conflict of interest statement
Disclosures
B.F. has a financial interest in CorticoMetrics, a company whose medical pursuits focus on brain imaging and measurement technologies. B.F.’s interests were reviewed and are managed by MGH and Partners HealthCare in accordance with their conflict of interest policies. J.D.S. is site principal investigator for Biohaven Pharmaceuticals
Figures
References
-
- Amaral MM, Zezell DM, Monte AFG, de Cara ACB, Araújo JCR, Antunes A, Freitas AZ, 2019. General model for depth-resolved estimation of the optical attenuation coefficients in optical coherence tomography. J. Biophoton. 12, e201800402. - PubMed
-
- Apps R, Hawkes R, Aoki S, Bengtsson F, Brown AM, Chen G, Ebner TJ, Isope P, Jörntell H, Lackey EP, Lawrenson C, Lumb B, Schonewille M, Sillitoe RV, Spaeth L, Sugihara I, Valera A, Voogd J, Wylie DR, Ruigrok TJH, 2018. Cerebellar modules and their role as operational cerebellar processing units. Cerebellum 17, 654–682. - PMC - PubMed
-
- Atzeni A, Jansen M, Ourselin S, Iglesias JE, 2018. A probabilistic model combining deep learning and multi-atlas segmentation for semi-automated labelling of histology. In: Frangi AF, Schnabel JA, Davatzikos C, Alberola-López C, Fichtinger G. (Eds.), Medical Image Computing and Computer Assisted Intervention – MICCAI 2018. Springer International Publishing, Cham, pp. 219–227.
-
- Boillat Y, Bazin PL, O’Brien K, Fartaria MJ, Bonnier G, Krueger G, van der Zwaag W, Granziera C, 2018. Surface-based characteristics of the cerebellar cortex visualized with ultra-high field MRI. Neuroimage 172, 1–8. - PubMed
Publication types
MeSH terms
Grants and funding
- R21 EB018907/EB/NIBIB NIH HHS/United States
- R56 AG068261/AG/NIA NIH HHS/United States
- RF1 MH123195/MH/NIMH NIH HHS/United States
- RF1 MH121885/MH/NIMH NIH HHS/United States
- R01 NS105820/NS/NINDS NIH HHS/United States
- R01 EB023281/EB/NIBIB NIH HHS/United States
- R01 AG008122/AG/NIA NIH HHS/United States
- R00 EB023993/EB/NIBIB NIH HHS/United States
- R01 EB019956/EB/NIBIB NIH HHS/United States
- P41 EB030006/EB/NIBIB NIH HHS/United States
- U01 MH093765/MH/NIMH NIH HHS/United States
- R01 NS070963/NS/NINDS NIH HHS/United States
- U01 NS086625/NS/NINDS NIH HHS/United States
- R01 AG064027/AG/NIA NIH HHS/United States
- R01 AG016495/AG/NIA NIH HHS/United States
- S10 RR019307/RR/NCRR NIH HHS/United States
- R01 AG070988/AG/NIA NIH HHS/United States
- P30 AG066546/AG/NIA NIH HHS/United States
- RF1 AG068261/AG/NIA NIH HHS/United States
- R56 AG064027/AG/NIA NIH HHS/United States
- U01 EB026996/EB/NIBIB NIH HHS/United States
- U01 MH117023/MH/NIMH NIH HHS/United States
- R21 NS072652/NS/NINDS NIH HHS/United States
- S10 RR023043/RR/NCRR NIH HHS/United States
- K01 DK101631/DK/NIDDK NIH HHS/United States
- R21 HD106038/HD/NICHD NIH HHS/United States
- R01 EB006758/EB/NIBIB NIH HHS/United States
- P41 EB015896/EB/NIBIB NIH HHS/United States
- R01 NS083534/NS/NINDS NIH HHS/United States
- S10 RR023401/RR/NCRR NIH HHS/United States
LinkOut - more resources
Full Text Sources
