

Osteoclast-mediated bone loss observed in a COVID-19 mouse model
- PMID: 34607050
- PMCID: PMC8486589
- DOI: 10.1016/j.bone.2021.116227
Osteoclast-mediated bone loss observed in a COVID-19 mouse model
Abstract
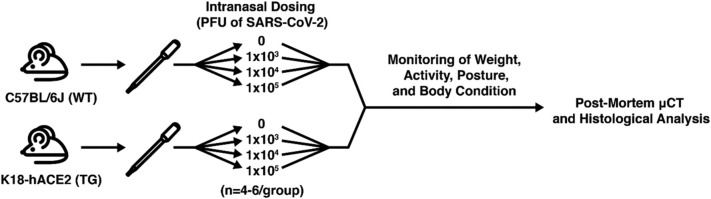
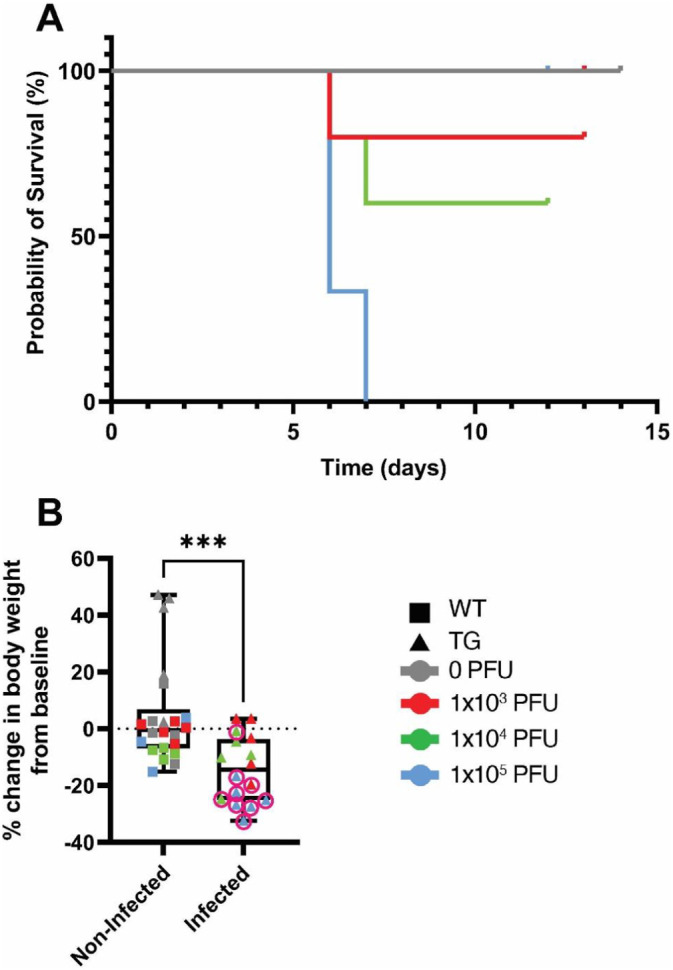
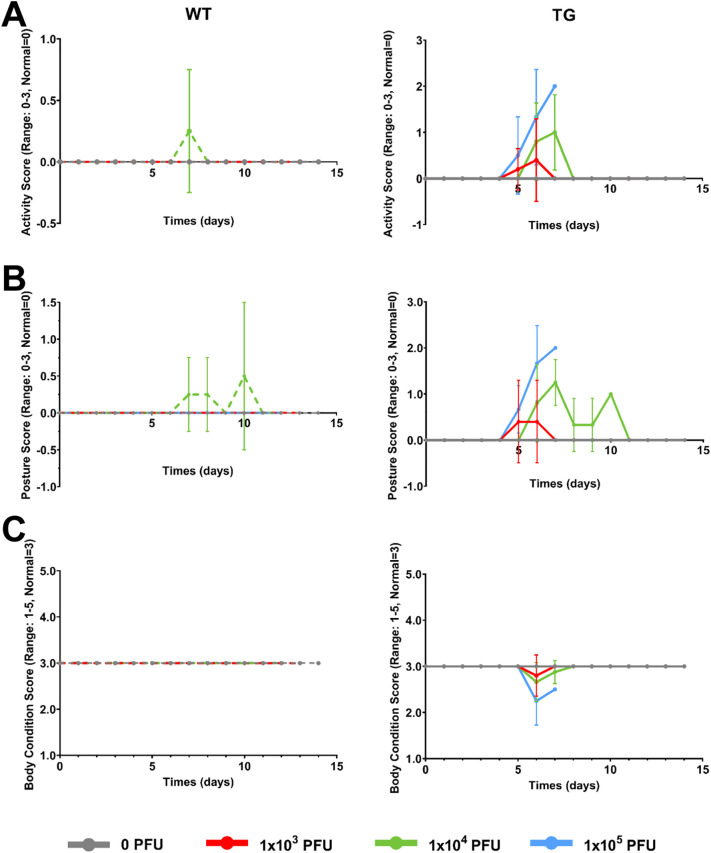
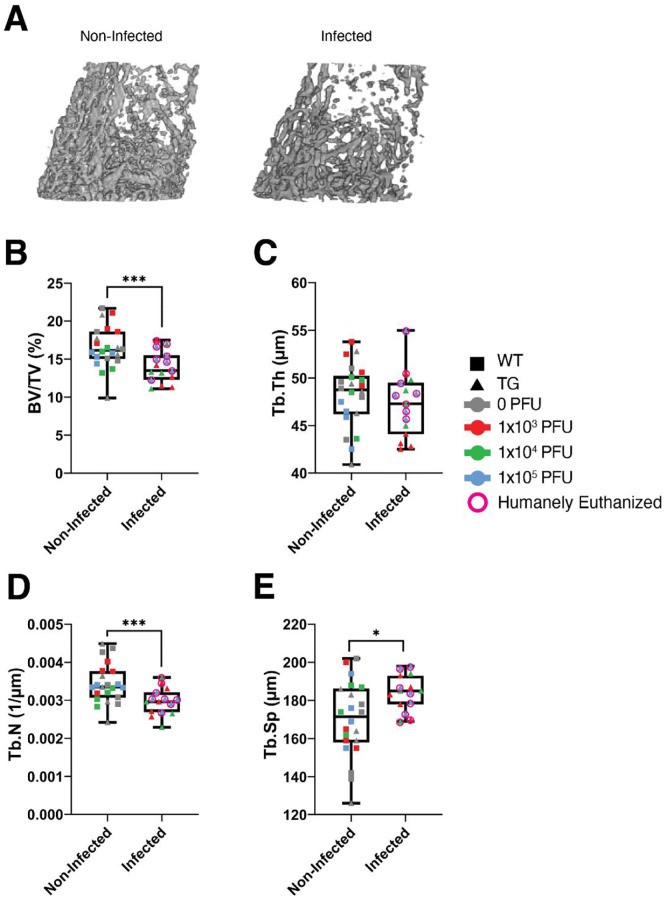
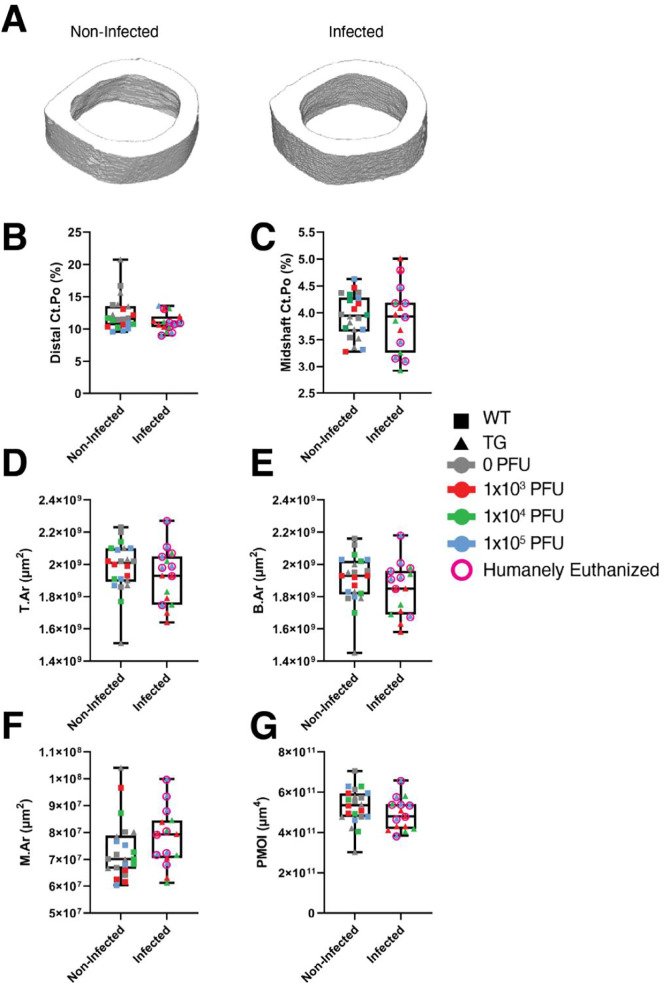
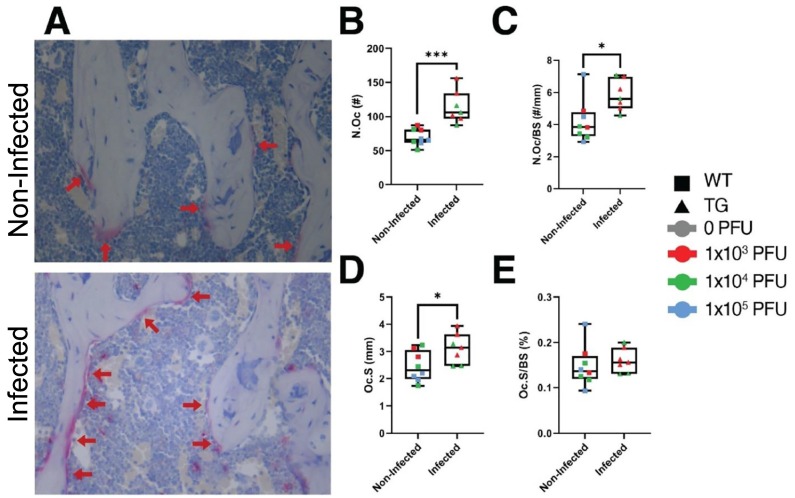
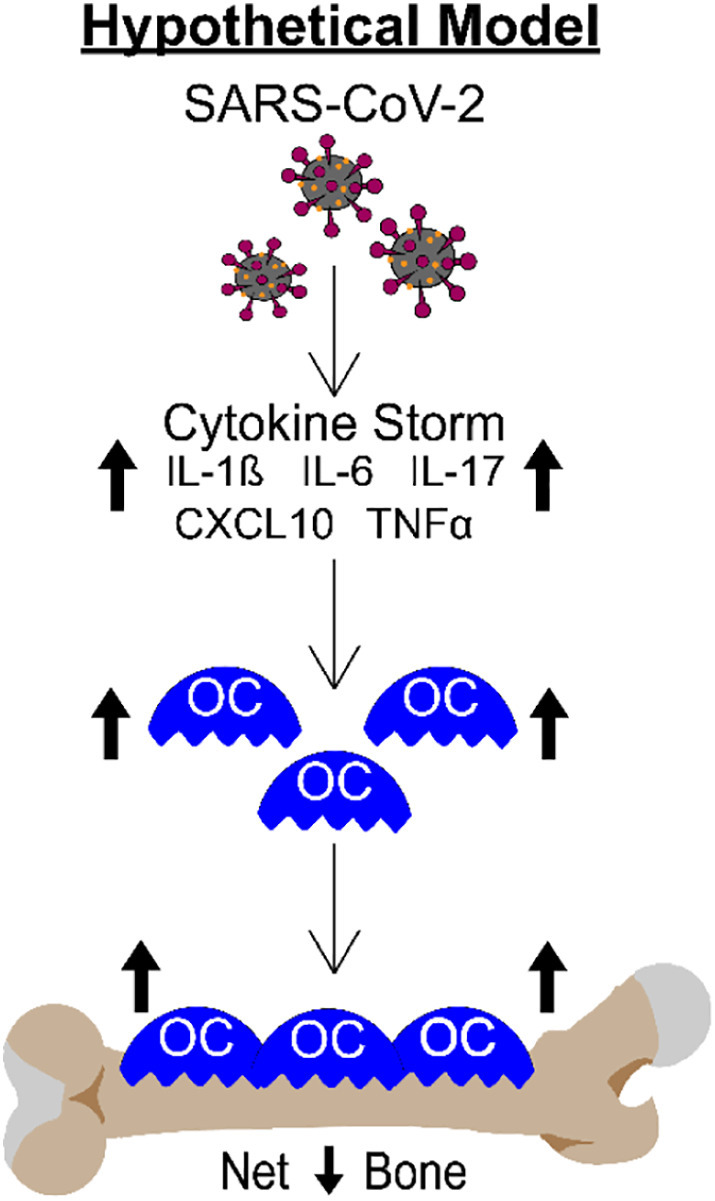
The consequences of SARS-CoV-2 infection on the musculoskeletal system represent a dangerous knowledge gap. Aging patients are at added risk for SARS-CoV-2 infection; therefore, a greater understanding of the resulting musculoskeletal sequelae of SARS-CoV-2 infection may help guide clinical strategies. This study examined fundamental bone parameters among mice treated with escalating viral loads. Male C57BL/6J (WT, n = 17) and B6.Cg-Tg(K18-ACE2)2Prlmn/J mice (K18-hACE2 transgenic mice, n = 21) expressing human ACE2 (TG) were divided into eight groups (n = 4-6/group) and subjected to intranasal dosing of 0, 1 × 10³, 1 × 10⁴, and 1 × 10⁵ PFU (plaque forming units) of human SARS-CoV-2. Animal health was assessed daily by veterinary staff using established and validated scoring criteria (activity, posture, body condition scores and body weight). We report here that mock and WT infected mice were healthy and completed the study, surviving until 12-14 days post infection (dpi). In contrast, the TG mice infected with 1 × 10⁵ PFU all experienced severe health declines that necessitated early euthanasia (6-7 dpi). For TG mice infected with 1 × 10⁴ PFU, 2 mice were also euthanized after 7 dpi, while 3 mice showed signs of moderate disease at day 6 dpi, but recovered fully by day 11 dpi. Four of the 5 TG mice that were infected with 1 × 10³ PFU remained healthy throughout the study. This suggests that our study mimics what is seen during human disease, where some patients develop severe disease resulting in death, while others have moderate to severe disease but recover, and others are asymptomatic. At necropsy, femurs were extracted and analyzed by μCT. No difference was found in μCT determined bone parameters among the WT groups. There was, however, a significant 24.4% decrease in trabecular bone volume fraction (p = 0.0009), 19.0% decrease in trabecular number (p = 0.004), 6.2% decrease in trabecular thickness (p = 0.04), and a 9.8% increase in trabecular separation (p = 0.04) among surviving TG mice receiving any viral load compared to non-infected controls. No differences in cortical bone parameters were detected. TRAP staining revealed surviving infected mice had a significant 64% increase in osteoclast number, a 27% increase in osteoclast surface, and a 38% increase in osteoclasts per bone surface. While more studies are needed to investigate the long-term consequences of SARS-CoV-2 infection on skeletal health, this study demonstrates a significant reduction in several bone parameters and corresponding robust increases in osteoclast number observed within 2 weeks post-infection in surviving asymptomatic and moderately affected mice.
Keywords: Bone mass; COVID-19; Infection; Musculoskeletal health; Osteoclasts; SARS-CoV-2.
Copyright © 2021 Elsevier Inc. All rights reserved.
Figures

Similar articles
-
Severe Acute Respiratory Syndrome Coronavirus 2 Variant Infection Dynamics and Pathogenesis in Transgenic K18-hACE2 and Inbred Immunocompetent C57BL/6J Mice.Viruses. 2025 Mar 30;17(4):500. doi: 10.3390/v17040500. Viruses. 2025. PMID: 40284943 Free PMC article.
-
The effect of sample site and collection procedure on identification of SARS-CoV-2 infection.Cochrane Database Syst Rev. 2024 Dec 16;12(12):CD014780. doi: 10.1002/14651858.CD014780. Cochrane Database Syst Rev. 2024. PMID: 39679851 Free PMC article.
-
Measures implemented in the school setting to contain the COVID-19 pandemic.Cochrane Database Syst Rev. 2022 Jan 17;1(1):CD015029. doi: 10.1002/14651858.CD015029. Cochrane Database Syst Rev. 2022. Update in: Cochrane Database Syst Rev. 2024 May 2;5:CD015029. doi: 10.1002/14651858.CD015029.pub2. PMID: 35037252 Free PMC article. Updated.
-
SARS-CoV-2-neutralising monoclonal antibodies to prevent COVID-19.Cochrane Database Syst Rev. 2022 Jun 17;6(6):CD014945. doi: 10.1002/14651858.CD014945.pub2. Cochrane Database Syst Rev. 2022. PMID: 35713300 Free PMC article.
-
Signs and symptoms to determine if a patient presenting in primary care or hospital outpatient settings has COVID-19.Cochrane Database Syst Rev. 2022 May 20;5(5):CD013665. doi: 10.1002/14651858.CD013665.pub3. Cochrane Database Syst Rev. 2022. PMID: 35593186 Free PMC article.
Cited by
-
COVID-19 and Bone Loss: A Review of Risk Factors, Mechanisms, and Future Directions.Curr Osteoporos Rep. 2024 Feb;22(1):122-134. doi: 10.1007/s11914-023-00842-2. Epub 2024 Jan 15. Curr Osteoporos Rep. 2024. PMID: 38221578 Free PMC article. Review.
-
Serum proinflammatory cytokines, receptor activator of nuclear factor kappa-Β ligand (RANKL), osteoprotegerin (OPG) and RANKL/OPG ratio in mild and severe COVID-19.BMC Infect Dis. 2024 Sep 27;24(1):1047. doi: 10.1186/s12879-024-09941-6. BMC Infect Dis. 2024. PMID: 39333916 Free PMC article.
-
Neuropilin-1-Mediated SARS-CoV-2 Infection in Bone Marrow-Derived Macrophages Inhibits Osteoclast Differentiation.Adv Biol (Weinh). 2022 May;6(5):e2200007. doi: 10.1002/adbi.202200007. Epub 2022 Feb 23. Adv Biol (Weinh). 2022. PMID: 35195371 Free PMC article.
-
The Impacts of COVID-19 on Musculoskeletal Health.Curr Osteoporos Rep. 2022 Aug;20(4):213-225. doi: 10.1007/s11914-022-00734-x. Epub 2022 Jun 20. Curr Osteoporos Rep. 2022. PMID: 35723777 Free PMC article. Review.
-
Molecular signatures in the progression of COVID-19 severity.Sci Rep. 2022 Dec 21;12(1):22058. doi: 10.1038/s41598-022-26657-2. Sci Rep. 2022. PMID: 36543855 Free PMC article.
References
-
- Gilbert L., He X., Farmer P., et al. Inhibition of osteoblast differentiation by tumor necrosis factor-α. Endocrinology. 2000;141(11):3956–3964. - PubMed
Publication types
MeSH terms
Grants and funding
LinkOut - more resources
Full Text Sources
Other Literature Sources
Medical
Molecular Biology Databases
Miscellaneous
