. 2022 Jan 1:195:113669.
doi: 10.1016/j.bios.2021.113669. Epub 2021 Sep 28.

Gold nanoparticle based plasmonic sensing for the detection of SARS-CoV-2 nucleocapsid proteins

Affiliations

Gold nanoparticle based plasmonic sensing for the detection of SARS-CoV-2 nucleocapsid proteins

Kamyar Behrouzi et al. Biosens Bioelectron. .

Abstract

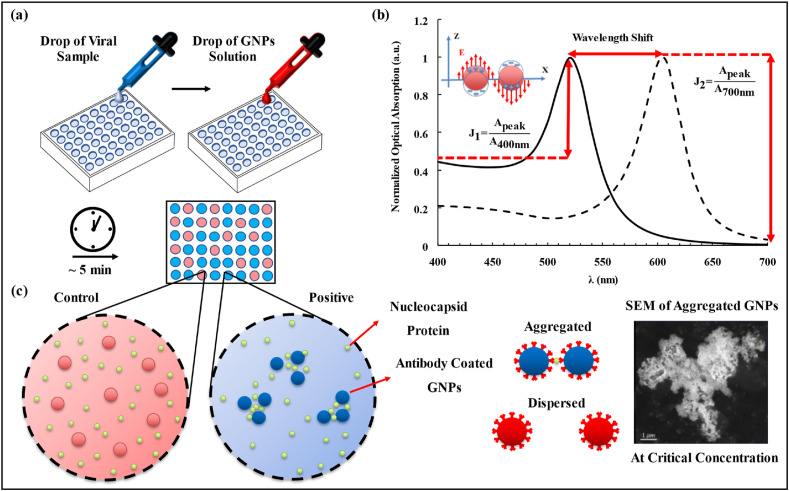
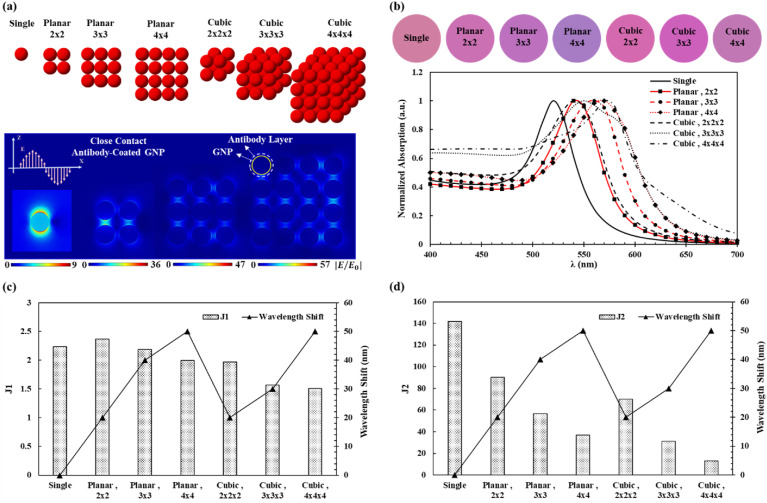
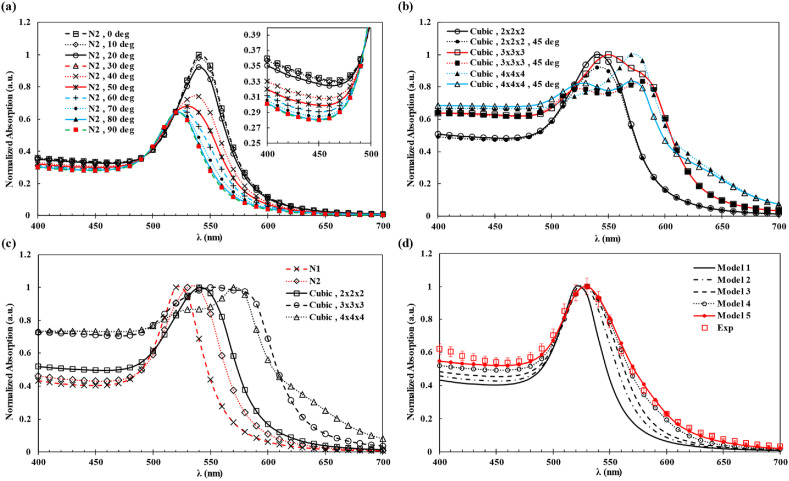
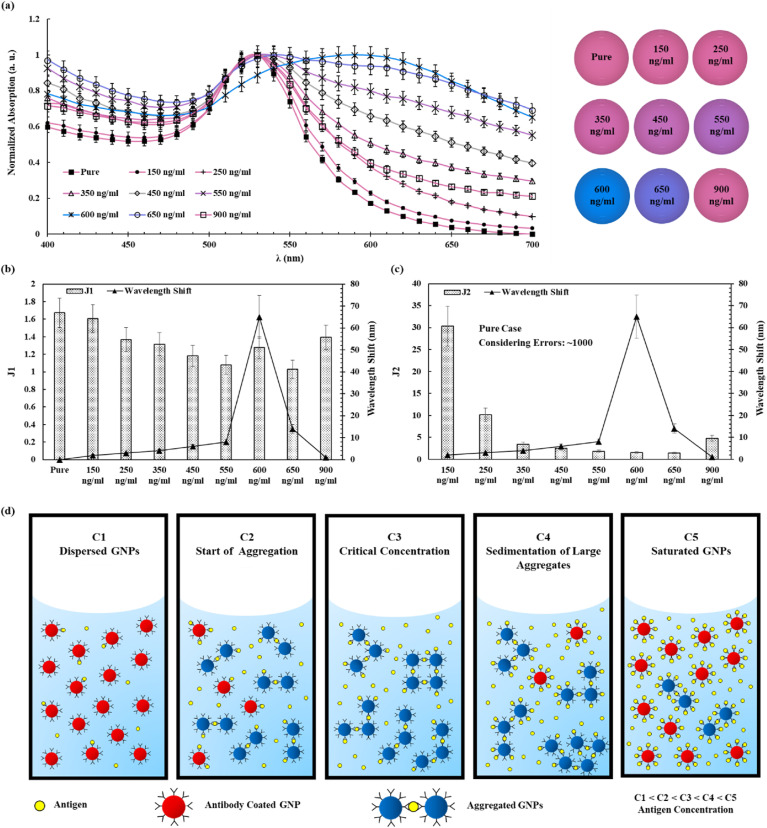
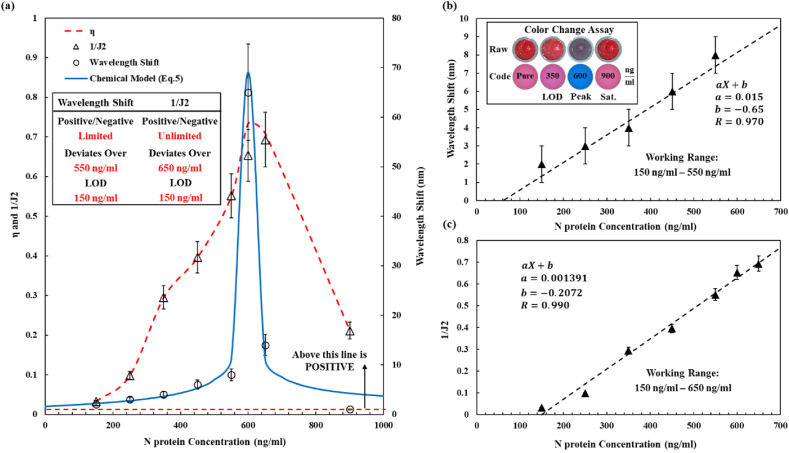
An inexpensive virus detection scheme with high sensitivity and specificity is desirable for broad applications such as the COVID-19 virus. In this article, we introduce the localized surface plasmon resonance (LSPR) principle on the aggregation of antigen-coated gold nanoparticles (GNPs) to detect SARS-CoV-2 Nucleocapsid (N) proteins. Experiments show this technique can produce results observable by the naked eye in 5 min with a LOD (Limits of Detection) of 150 ng/ml for the N proteins. A comprehensive numerical model of the LSPR effect on the aggregation of GNPs has been developed to identify the key parameters in the reaction processes. The color-changing behaviors can be readily utilized to detect the existence of the virus while the quantitative concentration value is characterized with the assistance of an optical spectrometer. A parameter defined as the ratio of the light absorption intensity at the upper visible band region of 700 nm to the light absorption intensity at the peak optical absorption spectrum of the GNPs at 530 nm is found to have a linear relationship with respect to the N protein concentrations. As such, this scheme could be utilized as an inexpensive testing methodology for applications in POC (Point-of-Care) diagnostics to combat current and future virus-induced pandemics.

Keywords: Biosensors; Colorimetric; LSPR; Plasmonic GNP; Point-of-Care; SARS-CoV-2 detection.


Conflict of interest statement

The authors declare that they have no known competing financial interests or personal relationships that could have appeared to influence the work reported in this paper.

Figures

Fig. 1
Fig. 1
The concept of the plasmonic GNPs for the SARC-CoV-2 N-protein detection. (a) A droplet of a viral sample solution and a droplet of the antibody coated GNPs solution are mixed. After 5 min, the color of the solution may remain as red (control) or change to blue as the positive identification of the virus. (b) Schematic of the LSPR effect over the 400–700 nm optical spectra for the GNPs. The ratio of the highest optical absorption intensity of the testing solution to the optical absorption intensity at 400 nm is defined as J1 and the ratio of the highest optical absorption intensity of the testing solution to the optical absorption intensity at 700 nm is defined as J2. (c) Antibody coated GNPs interact with antigens to make aggregates with a variety of sizes. The LSPR effects in aggregated GNPs result in the optical responses (color changes) of the solution. SEM image of the aggregated GNPs shows a very large aggregate (micrometer in size). (For interpretation of the references to color in this figure legend, the reader is referred to the Web version of this article.)
Fig. 2
Fig. 2
Numerical modeling of aggregated GNPs. (a) Different configurations of GNPs with electric field enhancement contours of different cases (antibody-coated GNP in close contact) under the z-axis polarized incident light. (b) The optical absorption spectra of different GNP aggregates with respect to the wavelength showing the peak wavelength shifts. Extracted colors of the simulations showing an obvious color change in various configurations. (cd) Wavelength shifts and J1 and J2 values for different 2D and 3D configurations, respectively. Increasing the size of the aggregates causes the reduction in the values of J1 and J2, while the changes in J2 are more significant. In general, the peak wavelength shifts increase as the GNP aggregates size increases, while J1 and J2 values decrease. (For interpretation of the references to color in this figure legend, the reader is referred to the Web version of this article.)
Fig. 3
Fig. 3
Numerical simulation results based on the McPeak et al. model (McPeak et al., 2015). (a) Optical absorption spectra of two antibody-coated GNPs with a 10 nm gap under various light irradiation orientations relative to the polarization direction. Increasing the polarization direction angle causes the red shift of the peak wavelength and the amplification in optical absorptions. All spectra were normalized with respect to the absorption value at the peak wavelength. (b) Optical spectra of the antibody-coated GNPs in the cubic arrangement with a 10 nm gap of different sizes and orientations. For each case, two extreme orientations of 0- and 45-degree are simulated. (c) Five different types of GNP aggregates. The increase in the aggregates size leads to red shift of the peak wavelength and higher absorption in the regions close to the 400 nm and 700 nm band regions. (d) Experimental data for the case of 150 ng/ml together with the simulation results. The definition of each model is given in Table 1. It is noted that model 5 results have the best match with experimental data implying larger aggregates are formed in the experiments. (For interpretation of the references to color in this figure legend, the reader is referred to the Web version of this article.)
Fig. 4
Fig. 4
Experimental results of optical responses of antibody-coated GNPs solutions with respect to the N protein concentration. (a) The optical absorption spectrum of GNPs solutions at different N protein concentrations. The increase in the N protein concentration leads to the red shift of the peak wavelength around the critical concentration. Aggregated GNPs can also result in the high optical absorption at regions around the 400 nm and 700 nm wavelength bands. The red-shift color changes with respect to the increase of N protein concentration increase the most at a critical concentration value and revert back to the antigen-free case afterwards. The CIE chromaticity plot in Fig. S18 shows the clear views of the color changes. All spectra results are normalized with respect to their maximum absorption values. (bc) The peak wavelength-shift together with J1 and J2 with respect to the N protein concentration, respectively. The peak wavelength-shift increases before the critical concentration value and reduces afterwards to the value close to the antigen-free case. Both J1 and J2 values decrease as the protein concentration increases before the critical concentration value and increase afterwards. The variations in J2 are more significant than those of J1. (d) The aggregating process of antibody coated GNPs at different antigen concentrations. High antigen concentration increases the probability of antibody-antigen interactions to result in large GNPs aggregates. This trend continues up to a critical antigen concentration which provides the optimum condition for the aggregate-interaction. At concentrations higher than the critical concentration value, the antibodies on GNPs can saturate the binding sites to reduce the aggregate-interactions and result in the combination of small aggregates and dispersed GNPs in the solution. (For interpretation of the references to color in this figure legend, the reader is referred to the Web version of this article.)
Fig. 5
Fig. 5
Concentration measurements of SARS-CoV-2 N proteins. (a) Comparison of the η, 1/J2 and peak wavelength-shift in the full range of tested N protein concentrations. The chemical model (Eq. (5)) matches well with experimental results on the peak wavelength-shift. The peak wavelength-shift parameter has a maximum around 600 ng/ml and reverts to its antigen-free case at high concentrations of 900 ng/ml. The 1/J2 parameter has a maximum value at 650 ng/ml and reduces at high N protein concentrations with values much higher than that of the antigen-free case. (bc) Linear approximation of the wavelength-shift and 1/J2 with respect to the N protein concentration, respectively. Experimental results on the color changes of various concentrations are also shown for both optical photos (top) and spectrum extracted color (bottom) images. (For interpretation of the references to color in this figure legend, the reader is referred to the Web version of this article.)

References

    1. Ahmadivand A., Gerislioglu B., Ahuja R., Kumar Mishra Y. Mater. Today. 2020;32:108–130. doi: 10.1016/j.mattod.2019.08.002. - DOI
    1. Ahmadivand A., Gerislioglu B., Ramezani Z., Kaushik A., Manickam P., Ghoreishi S.A. Biosens. Bioelectron. 2021;177:112971. doi: 10.1016/j.bios.2021.112971. - DOI - PMC - PubMed
    1. Alafeef M., Dighe K., Moitra P., Pan D. ACS Nano. 2020;14:17028–17045. doi: 10.1021/acsnano.0c06392. - DOI - PMC - PubMed
    1. Aldewachi H., Chalati T., Woodroofe M.N., Bricklebank N., Sharrack B., Gardiner P. Nanoscale. 2018;10:18–33. doi: 10.1039/c7nr06367a. - DOI - PubMed
    1. Almaghaslah D., Kandasamy G., Almanasef M., Vasudevan R., Chandramohan S. Int. J. Clin. Pract. 2020;74:1–9. doi: 10.1111/ijcp.13637. - DOI - PMC - PubMed