. 2021 Oct 26;12(5):e0252821.
doi: 10.1128/mBio.02528-21. Epub 2021 Oct 5.

A Myosin Light Chain Is Critical for Fungal Growth Robustness in Candida albicans

Affiliations

A Myosin Light Chain Is Critical for Fungal Growth Robustness in Candida albicans

Charles Puerner et al. mBio. .

Abstract

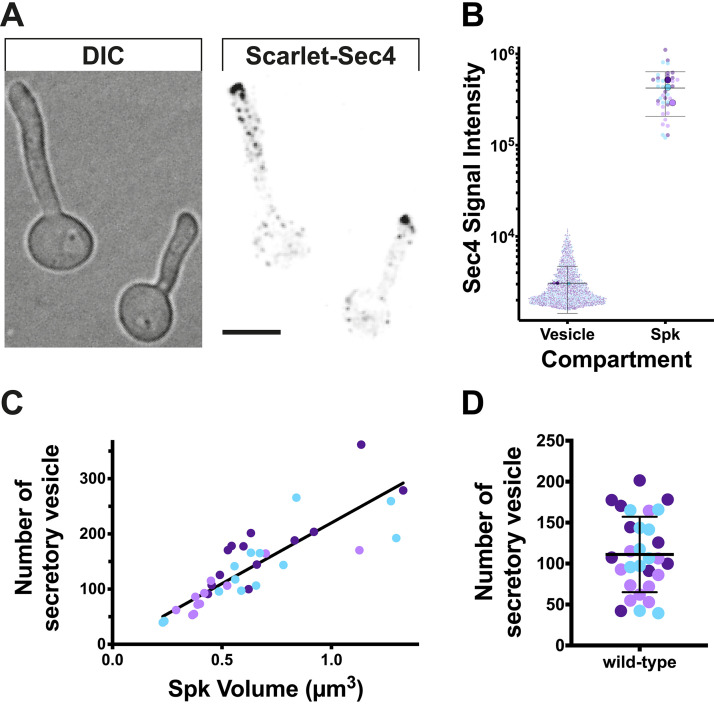
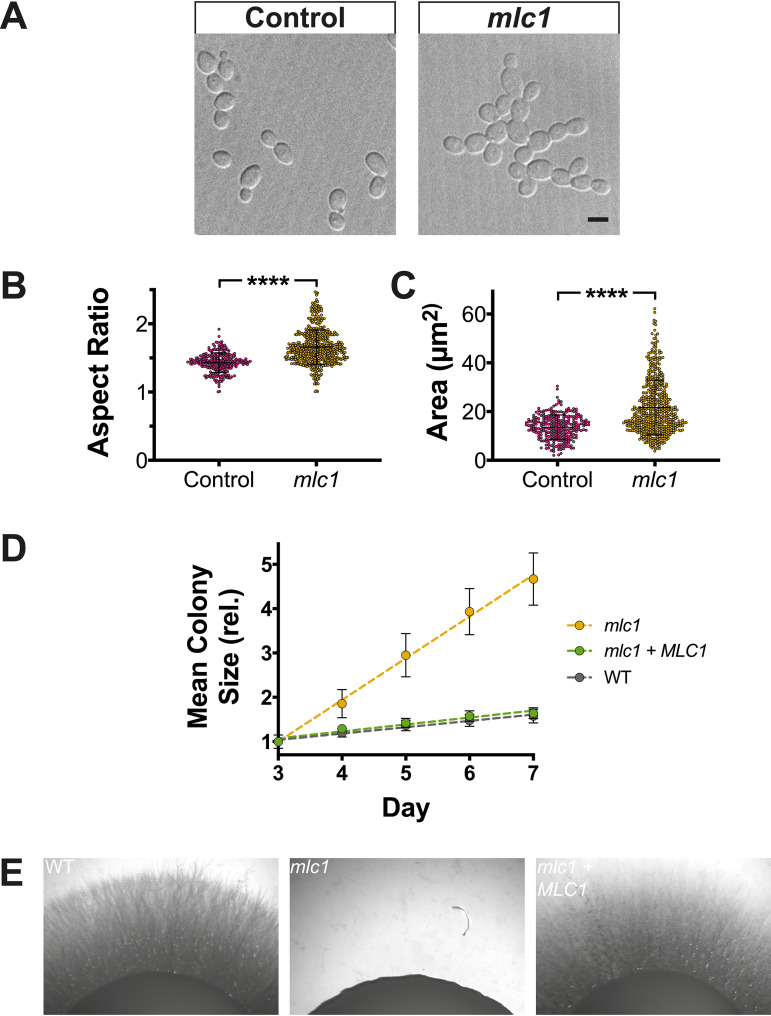
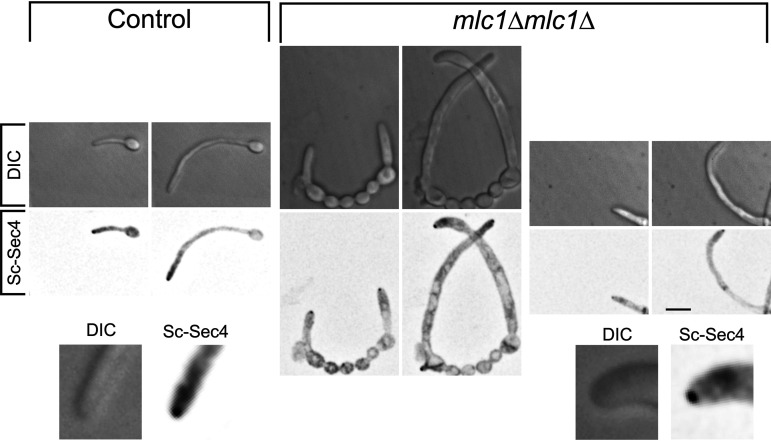
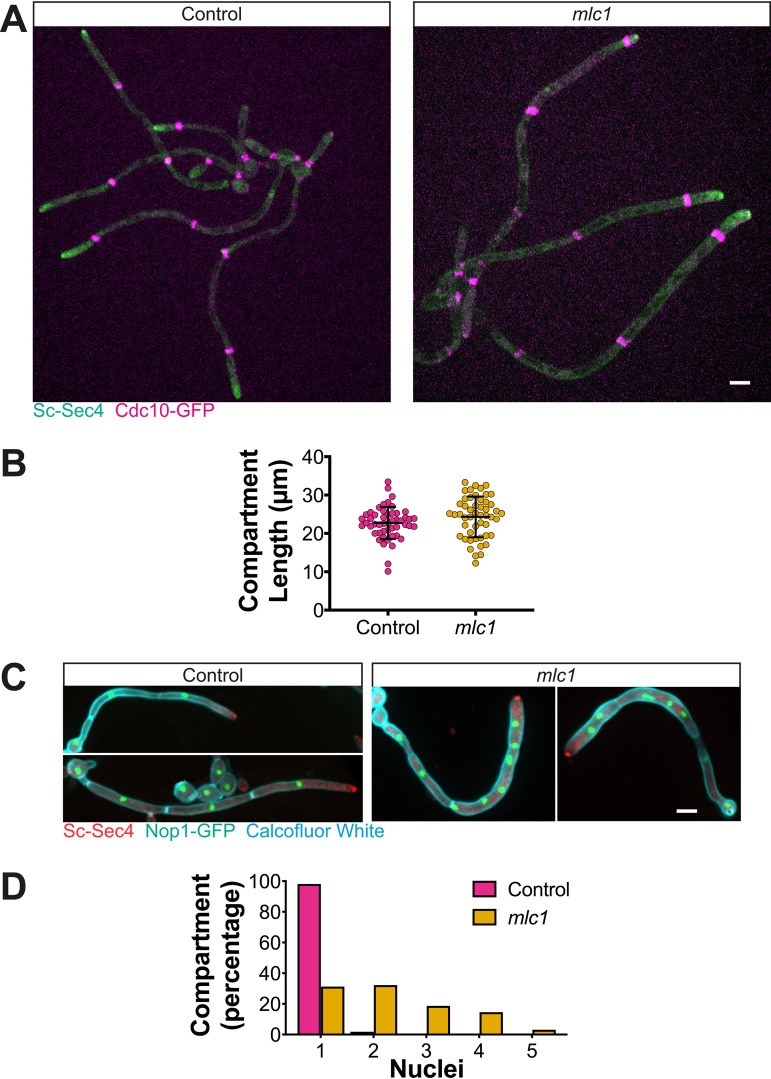
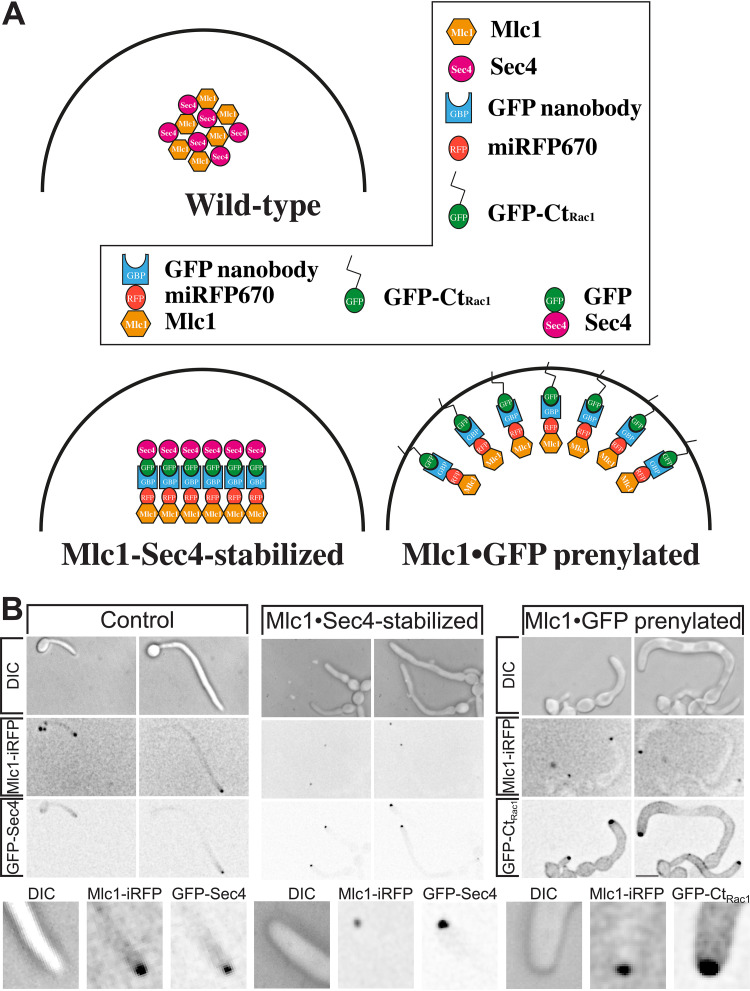
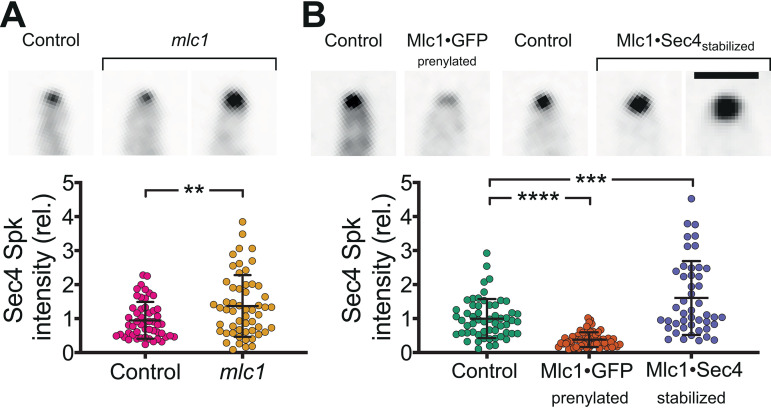
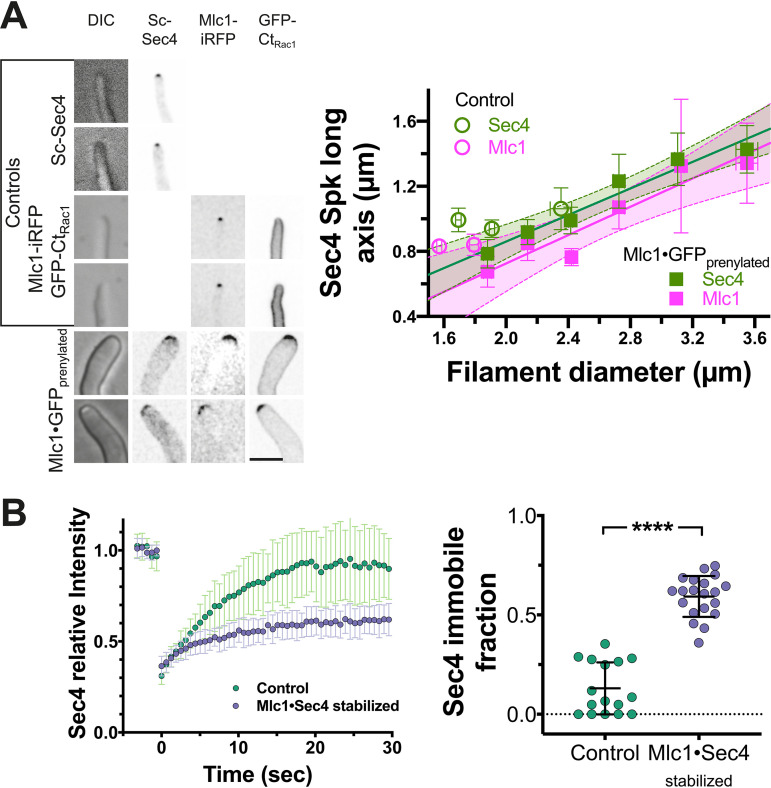
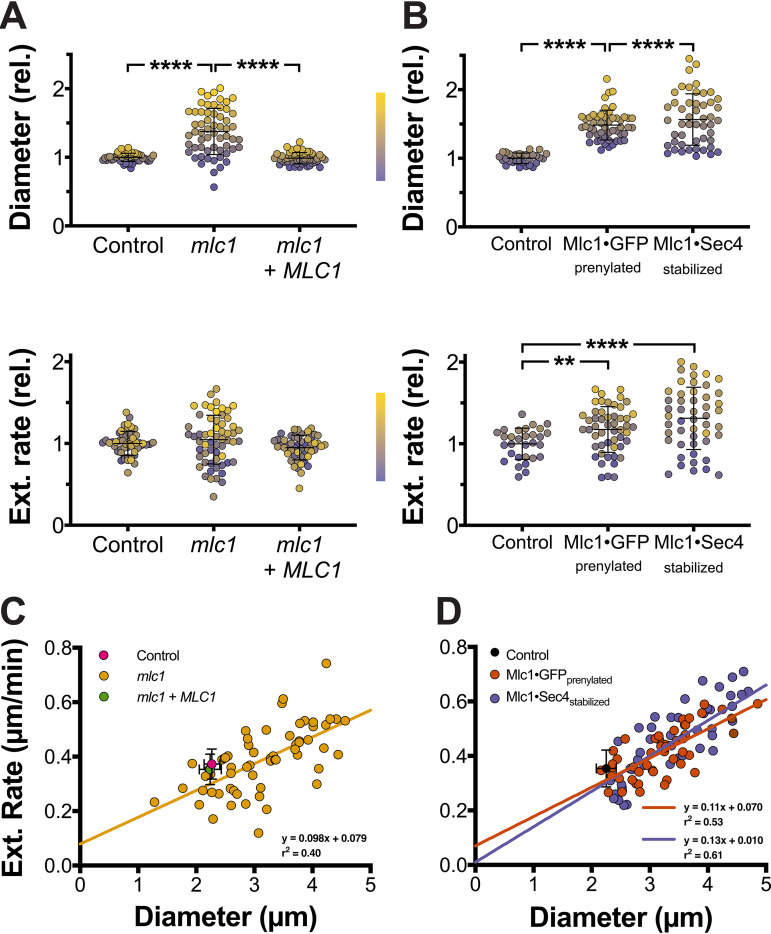
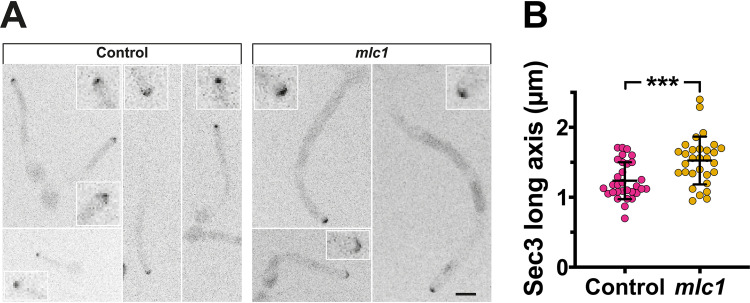
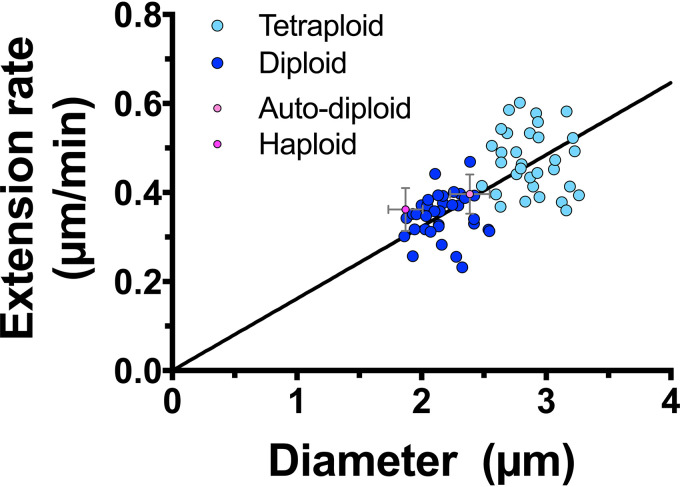
In a number of elongated cells, such as fungal hyphae, a vesicle cluster is observed at the growing tip. This cluster, called a Spitzenkörper, has been suggested to act as a vesicle supply center, yet analysis of its function is challenging, as a majority of components identified thus far are essential for growth. Here, we probe the function of the Spitzenkörper in the human fungal pathogen Candida albicans, using genetics and synthetic physical interactions (SPI). We show that the C. albicans Spitzenkörper is comprised principally of secretory vesicles. Mutant strains lacking the Spitzenkörper component myosin light chain 1 (Mlc1) or having a SPI between Mlc1 and either another Spitzenkörper component, the Rab GTPase Sec4, or prenylated green fluorescent protein (GFP), are viable and still exhibit a Spitzenkörper during filamentous growth. Strikingly, all of these mutants formed filaments with increased diameters and extension rates, indicating that Mlc1 negatively regulates myosin V, Myo2, activity. The results of our quantitative studies reveal a strong correlation between filament diameter and extension rate, which is consistent with the vesicle supply center model for fungal tip growth. Together, our results indicate that the Spitzenkörper protein Mlc1 is important for growth robustness and reveal a critical link between filament morphology and extension rate. IMPORTANCE Hyphal tip growth is critical in a range of fungal pathogens, in particular for invasion into animal and plant tissues. In Candida albicans, as in many filamentous fungi, a cluster of vesicles, called a Spitzenkörper, is observed at the tip of growing hyphae that is thought to function as a vesicle supply center. A central prediction of the vesicle supply center model is that the filament diameter is proportional to the extension rate. Here, we show that mutants lacking the Spitzenkörper component myosin light chain 1 (Mlc1) or having synthetic physical interactions between Mlc1 and either another Spitzenkörper component or prenylated GFP, are defective in filamentous growth regulation, exhibiting a range of growth rates and sizes, with a strong correlation between diameter and extension rate. These results suggest that the Spitzenkörper is important for growth robustness and reveal a critical link between filament morphology and extension rate.

Keywords: Spitzenkörper; filamentous growth; morphology; secretion.


Figures

FIG 1
FIG 1
The Spitzenkörper is comprised essentially of secretory vesicles. (A) Sec4-labeled secretory vesicles and Spitzenkörper. A strain expressing Scarlet-Sec4 as the sole copy (PY4554), was incubated with FCS on agarose pads at 37°C for 1 h, imaged (31 × 0.2 μm z-sections). DIC, differential interference contrast microscopy. Bar, 5 μm. (B) Sec4 signal intensity of secretory vesicles and Spitzenkörper (Spk). Fluorescence signals (5.5 standard deviations above the mean signal) were identified from images in panel A with the smallest (2 to 8 voxels; 0.0068 to 0.027 μm3) classified as vesicles and the largest (68 to 394 voxels; 0.23 to 1.33 μm3) classified as Spitzenkörpers. The different colors depict the results of three independent agarose pad experiments (n = 38 cells) with larger symbols representing the means for each pad and horizontal lines indicating means and bars indicating standard deviations. (C) The number of secretory vesicles in the Spitzenkörper correlates with its volume. The mean signal per secretory vesicle (3,059 ± 1,630) was used to determine the number of secretory vesicles in the Spitzenkörper. A linear regression with the y-intercept constrained to zero yielded an r2 value of 0.71. The determination of the number of secretory vesicles in the Spitzenkörper assumes that all the vesicles contain this Rab GTPase. (D) The Spitzenkörper is comprised of approximately 100 secretory vesicles. The mean number of secretory vesicles in Spitzenkörpers that ranged from 0.29 to 0.98 μm3 (80% of the cells) was 110 ± 46. The mean (horizontal line) and standard deviation (error bar) are shown.
FIG 2
FIG 2
In the absence of Mlc1, cells are enlarged and grow faster during budding growth yet are defective for invasive growth. (A to C) Deletion of results in larger budding cells. DIC images of mlc1Δ/MLC1 (Control) and mlc1Δ/mlc1Δ (mlc1) cells expressing Scarlet-Sec4 and either Nop1-GFP (PY5716) or Cdc10-GFP (PY5720), respectively, are shown. Bar, 5 μm. (B and C) The aspect ratios (long axis over short axis) and area (assuming a uniform ellipse) were determined (n = 250 to 500 cells) with **** indicating P value of <0.0001. (D) Colonies of the mlc1 mutant grow faster than the wild type. The indicated strains, including wild-type (WT; PY4860), mlc1 (mlc1Δ/mlc1Δ; PY4754), and mlc1 + MLC1 (mlc1Δ/mlc1Δ + MLC1; PY5658) were grown on rich medium at 30°C, and colony diameter (n = 25 to 50) was determined after 3 to 7 days incubation. Symbols are mean values of the normalized colony size at 3 days, with error bars indicating standard deviations; the lines are best fits with r2 > 0.94. (E) Mlc1 is required for invasive growth. Indicated strains, expressing Scarlet-Sec4 (WT, PY4860; mlc1, PY5451; mlc1 + MLC1, PY5661) were spotted on rich medium containing serum and incubated at 37°C for 7 days.
FIG 3
FIG 3
The myosin light chain 1 is not required for filamentous growth or Spitzenkörper formation. Indicated strains (control; mlc1Δ/MLC1 [PY5018] and mlc1 [mlc1Δ/mlc1Δ, PY5451]) expressing Scarlet-Sec4 were incubated and imaged as described in the legend to Fig. 1A, and sum projections are shown with the second image in each panel 1 h after the first image.
FIG 4
FIG 4
Filament compartment length is unaffected in the mlc1 mutant, which is multinucleate. (A) Mlc1 is not required for septin distribution. Fluorescent images of strains mlc1Δ/MLC1 (Control; PY5713) and mlc1Δ/mlc1Δ (mlc1; PY5717) cells expressing Scarlet-Sec4 and Cdc10-GFP are shown. Images are maximum projections of 26 × 0.4 μm z-sections of cells grown as described in the legend to Fig. 1 for 3 h. (B) The filament compartment length is unaffected in mlc1 cells. The length between septin bands was measured (n = 50 compartments, 25 to 30 filaments) in filaments of cells in panel A, incubated on pads between 1 and 3 h. Values are means ± standard deviations (error bars) with no significant difference between Control and mlc1 compartment length. (C) Multiple nuclei are observed in the mlc1 mutant. The indicated cells expressing Scarlet-Sec4 and Nop1-GFP (WT, PY5716; mlc1, PY5720) were incubated with serum at 37°C for 3 h and stained with Calcofluor white to reveal septa. Images are maximum projections of 26 × 0.4 μm z-sections. (D) The majority of mlc1 filament compartments are multinucleate. The number of nuclei was quantitated from the images of cells from panel C (n = 100 compartments, 30 to 70 filaments). Bars, 5 μm.
FIG 5
FIG 5
Synthetic interaction of Mlc1 with either Sec4 or prenylated GFP perturbs filamentous growth. (A) Schematic showing plasma membrane targeting of Mlc1 or stabilization with Sec4. The different domains and fusion proteins are indicated in the box. (B) Altering the stability or distribution of Mlc1 at the Spitzenkörper perturbs filamentous growth. Wild-type cells expressing Mlc1-iRFP and GFP·Sec4 (Control; PY4809), Mlc1-iRFP-GNB (iRFP stands for near-infrared fluorescent protein and GNB for GFP nanobody) and GFP-Sec4 (Mlc1·Sec4-stablilized; PY5405) or Mlc1-iRFP-GNB and GFP-CtRac1 (Mlc1·GFP prenylated; PY5409) were imaged as described in the legend to Fig. 2A. Note that in the absence of Mlc1-iRFP-GNB, GFP-CtRac1 (Rac1 carboxy terminus) is observed uniformly on the plasma membrane (62, 63) (Fig. 7A).
FIG 6
FIG 6
Altering the amount, distribution, and stability of Mlc1 at the Spitzenkörper. (A) Mlc1 is required for regulating the number of secretory vesicles. Indicated strains mlc1Δ/MLC1 (Control; PY5018) and mlc1Δ/mlc1Δ (mlc1; PY5451), expressing Scarlet-Sec4, were imaged after incubation with FCS at 37°C for 1 h with images showing sum projection of filament tips (the two examples for mlc1 illustrate the variation of Spitzenkörper signals). Vesicle clusters were identified in sum projections by signal intensities 8 standard deviations above the mean. The intensity values were normalized to the mean of the control strain. Means (horizontal lines) and standard deviations (error bars) (n = 57) are shown, with ** indicating a P value of <0.005. rel., relative. (B) Stabilization of Mlc1-Sec4 interaction results in an increase in secretory vesicles at the Spitzenkörper. Indicated strains, control expressing Scarlet-Sec4 (PY5018), Mlc1·GFP prenylated expressing Scarlet-Sec4 (PY5831), control expressing GFP-Sec4 (PY4809), Mlc1·Sec4-stabilized (PY5405 with GFP-Sec4), were grown and imaged as described above for panel A. The images at the top of panel A show examples of sum projection of filament tips (bar, 2.5 μm) (the two examples for Mlc1·Sec4-stabilized strain illustrate the variation of Spitzenkörper signals). Vesicle clusters were identified in sum projections by signal intensities 8 standard deviations above the mean for Scarlet-Sec4 and 13 standard deviations above the mean for GFP-Sec4. Intensity values were normalized to the means of the control strains (mlc1Δ/MLC1 expressing Scarlet-Sec4, PY5018 for the Mlc1·GFP prenylated strain, and wild-type expressing GFP-Sec4, PY4809 for the Mlc1·Sec4-stabilized strain). Values are means (horizontal lines) ± standard deviations (error bars) (n = 54), with *** and **** indicating P values of 0.0004 and <0.0001, respectively.
FIG 7
FIG 7
Synthetic physical interaction of Mlc1 alters the distribution of secretory vesicles and immobile fraction. (A) Secretory vesicle clusters are more spread out in Mlc1·GFP prenylated strain. Images (sum projections) of control (mlc1Δ/MLC1; PY5018) and Mlc1·GFP prenylated (Mlc1-iRFP-GNB and GFP-CtRac1; PY5831) strains expressing Scarlet-Sec4, as well as the control strain expressing Mlc1-iRFP and GFP-CtRac1, PY4776, with examples of wider filaments shown (left). Sum projections of 41 × 0.2 μm z-sections (left). The graph shows the quantitation of Scarlet-Sec4 and Mlc1-iRFP long axis in respective strains (PY5018, PY4776, and PY5831) (right) with filament diameter. Filament diameter and Mlc1 or Sec4 long axis were determined from sum projections of 50 to 70 cells, and values were binned every 0.3-μm filament diameter (6 to 26 cells per bin) with mean values and standard error of the mean shown. The lines fit for Sec4 or Mlc1 have an r2 of 0.95 or 0.90; note that the y-intercepts are very close to 0 with 95% confidence level prediction shown in light green (Sec4) or magenta (Mlc1). Bar, 5 μm. (B) Stabilization of Mlc1-Sec4 interaction at the Spitzenkörper increases the Sec4 immobile fraction. Fluorescence recovery after photobleaching of GFP-Sec4 in the indicated strains (Control; wild-type expressing GFP [PY4809] and Mlc1·Sec4 stabilized expressing Mlc1-iRFP-GNB and GFP-Sec4 [PY5405]). (Left) The mean FRAP recovery curve (n = 16 to 20 cells) with standard deviation shown (left panel). An increase in the immobile fraction is observed in the stabilized strain (right panel). Immobile fraction values with standard deviations are shown; **** indicates a P value of <0.0001.
FIG 8
FIG 8
The Spitzenkörper is a critical regulator of filamentous growth. (A) The myosin light chain is required for maintaining filament diameter and extension rate. Filament diameters (top) and extension rates (bottom) were determined from time-lapse experiments as described in the legend to Fig. 1A. Diameters are the averages of values measured every 5 to 10 min over a 120-min time-lapse experiment, and extension rates are from linear fits of filament length over at least 60 min (r2 > 0.9). Diameters were normalized to the control strain mlc1Δ/MLC1, which had a mean value of 2.3 ± 0.1 μm. Extension rates were normalized to the control strain mlc1Δ/MLC1 mean value of 0.37 ± 0.06 μm/min. Values were sorted by filament diameter and color coded with a color gradient from purple (smallest diameter) to yellow (largest diameter) for each strain (Lookup Table [LUT], center). Values are means (horizontal lines) ± standard deviations (error bars) (n = 50 to 60 cells), with **** indicating a P value of <0.0001. (B) Perturbation of Mlc1 distribution or stability dramatically increases growth rate. (A and B) Diameters (top) and extension (Ext.) rates (bottom) were quantitated and represented as described in the legend to Fig. 4A. They were normalized to the mean values of the wild-type control strain, 2.2 ± 0.2 μm and 0.35 ± 0.07 μm/min, respectively. Values are means (horizontal lines) ± standard deviations (error bars) (n = 30 to 50 cells), with ** and **** indicating P values of <0.005 and <0.0001, respectively. (C) In the absence of Mlc1, there is direct correlation between filament diameter and extension rate. Values from Fig. 4A were plotted with means and standard deviations for the two control strains (magenta and green circles) and values for each mlc1 cell are shown in yellow. (D) Perturbation of Mlc1 distribution or stability also results in a direct correlation between filament diameter and extension rate. Values from Fig. 4B were plotted with the mean and standard deviation for the control strain (black circle) and values for each Mlc1·GFP prenylated or Mlc1·Sec4 -stabilized cell in red and blue, respectively.
FIG 9
FIG 9
The exocyst subunit Sec3 is more spread out in the mlc1 deletion mutant. (A) The Sec3 exocyst subunit localizes to the tip of the mlc1 mutant. Indicated strains mlc1Δ/MLC1 (Control) and mlc1Δ/mlc1Δ (mlc1) expressing Sec3-GFP and Scarlet-Sec4 (PY5917 and PY6007) were imaged as described in the legend to Fig. 1A with RFP images taken every 10 min and GFP images taken every 20 min. Maximum projections of 10 × 0.5 μm z-sections are showing a zoom in of the filament tips. Bar, 5 μm. (B) Sec3 is more broadly distributed in the mlc1 mutant. The Sec3 clusters from images in panel A were identified (2.8 standard deviations above the mean signal) and long axis determined (n = 30), with means (horizontal lines) and standard deviations (error bars) indicated. *** indicates a P value of 0.005. The average extension rates were 0.25 ± 0.04 μm/min and 0.38 ± 0.09 μm/min for control and mlc1 cells, respectively. The average filament diameters were 2.0 ± 0.2 μm and 2.8 ± 0.5 μm for control and mlc1 cells, respectively.
FIG 10
FIG 10
Filament diameter and extension rate are directly correlated upon changes in ploidy. Filament diameters and extension rates were determined from time-lapse experiments as described in the legend to Fig. 1A. Diameters are the averages of values measured every 10 min over a 1- to 2-h time-lapse experiment, and extension rates are from linear fits of filament length over at least 1 h (r2 > 0.95). Values for isogenic diploid (dark blue;YJB-T176) and tetraploid (light blue;YJB-T178) are shown with the means for haploid (dark magenta; PY5938) and auto-diploids (light magenta;PY5951) standard deviations, and values for each mlc1 cell are shown in yellow (n = 30 to 34). A linear regression with the y-intercept constrained to zero yielded a r2 value of 0.36.

References

    1. Girbardt M. 1957. Der Spitzenkörper von Polystictus versicolor (L.). Planta 50:47–59. doi:10.1007/BF01912343. - DOI
    1. Reynaga-Peña CG, Gierz G, Bartnicki-Garcia S. 1997. Analysis of the role of the Spitzenkörper in fungal morphogenesis by computer simulation of apical branching in Aspergillus niger. Proc Natl Acad Sci USA 94:9096–9101. doi:10.1073/pnas.94.17.9096. - DOI - PMC - PubMed
    1. Riquelme M, Aguirre J, Bartnicki-García S, Braus GH, Feldbrügge M, Fleig U, Hansberg W, Herrera-Estrella A, Kämper J, Kück U, Mouriño-Pérez RR, Takeshita N, Fischer R. 2018. Fungal morphogenesis, from the polarized growth of hyphae to complex reproduction and infection structures. Microbiol Mol Biol Rev 82:e00068-17. doi:10.1128/MMBR.00068-17. - DOI - PMC - PubMed
    1. Bartnicki-Garcia S, Bartnicki DD, Gierz G, López-Franco R, Bracker CE. 1995. Evidence that Spitzenkörper behavior determines the shape of a fungal hypha: a test of the hyphoid model. Exp Mycol 19:153–159. doi:10.1006/emyc.1995.1017. - DOI - PubMed
    1. Bartnicki-Garcia S, Hergert F, Gierz G. 1989. Computer simulation of fungal morphogenesis and the mathematical basis for hyphal (tip) growth. Protoplasma 153:46–57. doi:10.1007/BF01322464. - DOI

Publication types

MeSH terms

LinkOut - more resources