. 2021 Oct 26;12(5):e0203421.
doi: 10.1128/mBio.02034-21. Epub 2021 Oct 5.

Para-Aminobenzoic Acid, Calcium, and c-di-GMP Induce Formation of Cohesive, Syp-Polysaccharide-Dependent Biofilms in Vibrio fischeri

Affiliations

Para-Aminobenzoic Acid, Calcium, and c-di-GMP Induce Formation of Cohesive, Syp-Polysaccharide-Dependent Biofilms in Vibrio fischeri

Courtney N Dial et al. mBio. .

Abstract

The marine bacterium Vibrio fischeri efficiently colonizes its symbiotic squid host, Euprymna scolopes, by producing a transient biofilm dependent on the symbiosis polysaccharide (SYP). In vitro, however, wild-type strain ES114 fails to form SYP-dependent biofilms. Instead, genetically engineered strains, such as those lacking the negative regulator BinK, have been developed to study this phenomenon. Historically, V. fischeri has been grown using LBS, a complex medium containing tryptone and yeast extract; supplementation with calcium is required to induce biofilm formation by a binK mutant. Here, through our discovery that yeast extract inhibits biofilm formation, we uncover signals and underlying mechanisms that control V. fischeri biofilm formation. In contrast to its inability to form a biofilm on unsupplemented LBS, a binK mutant formed cohesive, SYP-dependent colony biofilms on tTBS, modified LBS that lacks yeast extract. Moreover, wild-type strain ES114 became proficient to form cohesive, SYP-dependent biofilms when grown in tTBS supplemented with both calcium and the vitamin para-aminobenzoic acid (pABA); neither molecule alone was sufficient, indicating that this phenotype relies on coordinating two cues. pABA/calcium supplementation also inhibited bacterial motility. Consistent with these phenotypes, cells grown in tTBS with pABA/calcium were enriched in transcripts for biofilm-related genes and predicted diguanylate cyclases, which produce the second messenger cyclic-di-GMP (c-di-GMP). They also exhibited elevated levels of c-di-GMP, which was required for the observed phenotypes, as phosphodiesterase overproduction abrogated biofilm formation and partially rescued motility. This work thus provides insight into conditions, signals, and processes that promote biofilm formation by V. fischeri. IMPORTANCE Bacteria integrate environmental signals to regulate gene expression and protein production to adapt to their surroundings. One such behavioral adaptation is the formation of a biofilm, which can promote adherence and colonization and provide protection against antimicrobials. Identifying signals that trigger biofilm formation and the underlying mechanism(s) of action remain important and challenging areas of investigation. Here, we determined that yeast extract, commonly used for growth of bacteria in laboratory culture, inhibits biofilm formation by Vibrio fischeri, a model bacterium used for investigating host-relevant biofilm formation. Omitting yeast extract from the growth medium led to the identification of an unusual signal, the vitamin para-aminobenzoic acid (pABA), that when added together with calcium could induce biofilm formation. pABA increased the concentrations of the second messenger, c-di-GMP, which was necessary but not sufficient to induce biofilm formation. This work thus advances our understanding of signals and signal integration controlling bacterial biofilm formation.

Keywords: Vibrio fischeri; biofilms; c-di-GMP; calcium signaling; cyclic nucleotides; pABA; signal transduction.


Figures
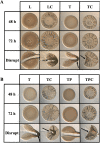
FIG 1
FIG 1
Yeast extract inhibits ΔbinK mutant biofilm formation. (A) Colony biofilm formation by the ΔbinK mutant (KV7860) was evaluated following growth on LBS (L), LBS + 10 mM calcium (LC), tTBS (T), and tTBS + 10 mM calcium (TC). (B) Colony biofilm formation by the ΔbinK mutant (KV7860) was evaluated following growth on tTBS (T), tTBS + 10 mM calcium (TC), tTBS + 9.7 mM pABA (TP), and tTBS + pABA/calcium (TPC). Pictures were taken using a dissecting light microscope at 48 and 72 h. Each colony was disrupted using a toothpick after 72 h. Pictures are representative of 3 separate experiments. Arrows indicate where “pulling,” indicating cohesion, was observed.
FIG 2
FIG 2
pABA induces ES114 biofilm. (A) Colony biofilm formation by wild-type strain ES114 was assessed following growth on tTBS (T), tTBS + 10 mM calcium (TC), tTBS + 9.7 mM pABA (TP), and tTBS + pABA/calcium (TPC). Pictures were taken using a dissecting light microscope at 72 and 96 h. The colony was disrupted using a toothpick after 96 h. (B and C) The ability of ES114 to produce biofilms during growth in liquid with shaking was evaluated following growth of the strain in tTBS, tTBS + calcium, tTBS + pABA, and tTBS + pABA/calcium. Pictures (B) and OD600 readings (C) were taken after 19 h. All pictures are representatives of 3 separate experiments. Arrows indicate where “pulling” as well as clumps, indicating cohesion, were observed. All experiments were done at 24°C. Statistics for C were performed via a one-way ANOVA using Tukey’s multiple-comparison test where OD600 was the dependent variable. **, P = 0.0098; *, P = 0.0360.
FIG 3
FIG 3
Cellular aggregates form in the presence of pABA and calcium. (A) Growth of WT ES114 was evaluated over time in tTBS (T), tTBS + calcium (TC), tTBS + pABA (TP), and tTBS + pABA/calcium (TPC) over the course of 7 h by monitoring the OD600 using a spectrophotometer. (B) Growth of WT ES114 and a ΔsypR mutant in T, TC, TP, and TPC after 19 h was monitored via OD600 using a spectrophotometer. Statistics for B were performed via a two-way ANOVA using Tukey’s multiple-comparison test for comparisons between media conditions (***, P < 0.0002; ****, P < 0.0001) and a 2-way ANOVA using Šídák’s multiple comparison test for comparisons between strains (****, P < 0.0001), where OD was the dependent variable in both comparisons. (C and D) Pictures of ES114 in T and TPC after 7 h of growth.
FIG 4
FIG 4
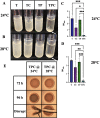
Impact of temperature on pABA/calcium-induced biofilms. (A to D) The ability of ES114 to form biofilms during growth in liquid with shaking biofilms was assessed following growth tTBS, tTBS + calcium, tTBS + pABA, and tTBS + pABA/calcium. Pictures (A and B) and OD600 readings (C and D) were taken after 16 h for cultures incubated at 24°C (A and C) or 28°C (B and D). All pictures are representatives of 3 separate experiments. Statistics for panels C and D were performed using one-way ANOVA using Tukey’s multiple-comparison test, where OD600 was the dependent variable. *, P < 0.05; **, P = 0.006; ***, P < 0.0007. (E) Colony biofilm formation by ES114 was assessed following growth on tTBS, tTBS + 10 mM calcium, tTBS + 9.7 mM pABA, and tTBS + pABA/calcium. Spotted colonies were incubated at both 24 and 28°C. Pictures were taken using a dissecting light microscope at 72 and 96 h. Each colony was disrupted using a toothpick after 96 h. Arrows indicate where “pulling” as well as clumps, indicating cohesion, were observed.
FIG 5
FIG 5
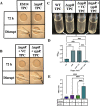
pABA- and calcium-induced ES114 biofilms require Syp. (A and B) Colony biofilm formation was assessed following growth of the indicated strains on tTBS + pABA/calcium (TPC). Pictures were taken at 72 h; at 72 h, each colony was disrupted using a toothpick and photographed. The following strains were tested: ES114, ΔsypR (KV5195), ΔsypR + vector control (VC), ΔsypR + sypR, and a plasmid-based sypR complement. Arrows indicate where “pulling” as well as clumps, indicating cohesion, were observed. (C and D) The same strains were evaluated for their ability for form biofilms in a shaking liquid culture. Pictures (C) were taken at 19 h, and OD600 of each culture (D) was measured at the same time as an indicator of biofilm formation. Statistics for D were performed via a one-way ANOVA using Tukey’s multiple-comparison test, where OD600 was the dependent variable. ***, P < 0.0006. (E) sypA promoter activity (Miller units) was measured using a PsypA-lacZ fusion strain (KV8079) following subculture for 22 h in tTBS, tTBS + calcium, tTBS + pABA, and tTBS + pABA/calcium. Statistics for panel E were performed via a one-way ANOVA using Tukey’s multiple-comparison test, where Miller units was the dependent variable. ***, P < 0.0006.
FIG 6
FIG 6
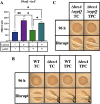
Disruption of cellulose synthesis promotes cohesive biofilm formation by ES114. (A) bcs promoter activity (Miller units) was measured using a PbcsQ-lacZ fusion strain (KV8078) following a 4-h subculture in tTBS, tTBS + calcium, tTBS + pABA, and T + pABA/calcium. Statistics for panel A were performed via a one-way ANOVA using Tukey’s multiple-comparison test, where Miller units was the dependent variable. *, P < 0.04; **, P = 0.0060. (B and C) Colony biofilm formation was assessed following growth of the ES114 and ΔbcsA (KV8616) strains (B) or the ΔbcsA ΔsypQ (KV9380) strain (C) on tTBS + calcium (TC) and tTBS + pABA/calcium (TPC). Pictures were taken using a dissecting light microscope at 96 h. Each colony was disrupted using a toothpick after 96 h. Arrows indicates where “pulling,” indicating cohesion, was observed.
FIG 7
FIG 7
pABA and calcium promote expression of biofilm and c-di-GMP production transcripts. (A) Principal coordinate analysis (PCoA) plots based on Bray-Curtis dissimilarities of ES114 transcriptomes incubated in different media types at 4 and 8 h (left), 4 h only (right top), or 8 h only (right bottom). ES114 cells were incubated in tTBS (T) (blue), tTBS supplemented with 10 mM CaCl2 (TC) (green), or tTBS supplemented with 10 mM CaCl2 and 9.7 mM pABA (TCP) (purple). Cells in TCP were either collected from suspension and considered “planktonic” (TCPpl) or collected from the biofilm pellet at the bottom of the tube (TCPpe). Samples were collected after either 4 (lighter shade) or 8 h (darker shade) of incubation. Percentages on each axis indicate the amount of variation explained by each axis; P values indicate significant results of multivariate analysis of variance (PERMANOVA) tests. PCoA symbol key is shown above panel A. (B) Heatmap of hierarchical clustering results for the relative transcript abundance for ES114 8-h transcriptomes. Each row represents a gene from either the symbiosis polysaccharide (top) or cellulose biosynthesis (bottom) gene clusters; each column represents a sample. Square color in the heatmap indicates the relative transcript abundance for a given transcript across samples: red indicates high abundance, and blue indicates low abundance. Asterisks indicate genes that had significantly higher relative transcript abundance in TCPpl and TCPpe relative to T and TC treatments. (C) Volcano plot showing the log2 fold change in transcript abundance between ES114 cultures incubated in tTBS (T) or tTBS 10 mM calcium and 9.7 mM pABA planktonic cells (TCPpl) for 8 h. Transcripts with a negative log2 fold change value are more abundant in tTBS (left), and transcripts with a positive log2 fold change value are more abundant in tTBS calcium pABA (right). Symbols indicate the functional assignment of the gene/transcript of interest as follows: dark gray (DGC), red (PDE), yellow (HD-GYP), blue (DGC/PDE). Data points above the dashed horizontal line had significant P values between treatments (DESeq analysis; false-discovery rate [FDR], P < 0.05), and those outside of the vertical dashed lines had a magnitude fold change of >|1| log2 between treatments (gray squares). (D) Heatmap of hierarchical clustering results for the relative transcript abundance for ES114 8-h transcriptomes. Each row represents a gene related to c-di-GMP production that was significantly differentially expressed in DESeq analysis (FDR, P < 0.05); each column represents a sample.
FIG 8
FIG 8
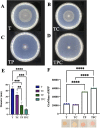
pABA controls motility and c-di-GMP production. (A to D) Migration of ES114 was evaluated using soft-agar motility plates supplemented with calcium, pABA, or both. Pictures were taken after 6 h, and representative images are shown. tTBS (T) (A), tTBS + calcium (TC) (B), tTBS + pABA (TP) (C), and tTBS + pABA/calcium (TPC) (D). (E) Migration was evaluated by measuring the outer diameter of the migrating cells. Statistics for panel E were performed via a one-way ANOVA using Tukey’s multiple-comparison test, where diameter was the dependent variable. **, P = 0.0049; ***, P < 0.0005; ****, P < 0.0001. (F) Levels of c-di-GMP were estimated using ES114 containing c-di-GMP biosensor plasmid pFY4535. RFP was measured from the same strain grown in T, TC, TP, or TPC liquid cultures using flow cytometry. The cells were first gated using AmCyan and then on RFP. Statistics for panel F were performed via a one-way ANOVA using Tukey’s multiple-comparison test. ****, P < 0.0001. A culture of this strain was spotted onto tTBS plates containing calcium, pABA, or pABA/calcium, and the resulting RFP production was visualized as spots with different shades of pink that mirrored the flow cytometry measurements. Representative pictures are shown.
FIG 9
FIG 9
PDE overexpression abrogates c-di-GMP levels and biofilm formation but has less effect on motility and no effect on syp transcription. (A) The levels of RFP from strains carrying c-di-GMP biosensor pFY4535 and either the vector control or a plasmid (pKV302) that overexpresses phosphodiesterase (PDE) VF_0087 were measured using flow cytometry following growth in either tTBS + pABA (TP) or tTBS + pABA/calcium (TPC). The cells were first gated on AmCyan and then on RFP. Statistics for panel A were performed via a one-way ANOVA using Tukey’s multiple-comparison test. ****, P < 0.0001. (B and C) Migration of ES114 carrying vector control (VC) or PDE overexpressing plasmid pKV302 (PDE O/E) was evaluated using tTBS soft-agar motility plates (T) supplemented with calcium (TC), pABA (TP), or both (TPC). Pictures were taken after 6 h, and representative images are shown. Migration was evaluated by measuring the outer diameter of the migrating cells. Statistics for panel C were done via a 2-way ANOVA using Šídák’s multiple comparison test, where diameter was the dependent variable. *, P = 0.0137; ****, P < 0.0001. (D) Colony biofilm formation was assessed following growth of ES114 carrying the vector control (VC) or pKV302 (PDE O/E) on tTBS + pABA/calcium (TPC). Pictures were taken at 96 h before and after disrupting the spots with a toothpick. (E and F) The same strains in panel D were grown in tTBS liquid medium containing pABA/calcium with shaking. Pictures were taken at 19 h, and the OD600 was measured as an indicator of biofilm formation. Arrows indicate where “pulling” as well as clumps, indicating cohesion, were observed. Statistics for panel F were performed using a paired t test, where OD600 was the dependent variable. *, P = 0.0136. (G) sypA promoter activity (Miller units) was measured using PsypA-lacZ fusion strain KV8079 that contained either the VC plasmid or the PDE O/E plasmid following a 22-h subculture in T, TC, TP, and TPC. Statistics for panel G were performed via a two-way ANOVA using Šídák’s multiple comparison test, where Miller units was the dependent variable.

Similar articles

Cited by

References

    1. Karatan E, Watnick P. 2009. Signals, regulatory networks, and materials that build and break bacterial biofilms. Microbiol Mol Biol Rev 73:310–347. doi:10.1128/MMBR.00041-08. - DOI - PMC - PubMed
    1. Nyholm SV, McFall-Ngai MJ. 2021. A lasting symbiosis: how the Hawaiian bobtail squid finds and keeps its bioluminescent bacterial partner. Nature Rev Microbiology 19:666–679. doi:10.1038/s41579-021-00567-y. - DOI - PMC - PubMed
    1. Visick KL, Stabb EV, Ruby EG. 2021. A lasting symbiosis: how Vibrio fischeri finds a squid partner and persists within its natural host. Nature Rev Microbiology 19:654–665. doi:10.1038/s41579-021-00557-0. - DOI - PMC - PubMed
    1. Nyholm SV, Stabb EV, Ruby EG, Mcfall-Ngai MJ, Lindow SE. 2000. Establishment of an animal-bacterial association: recruiting symbiotic vibrios from the environment. Proc Natl Acad Sci USA 97:10231–10235. doi:10.1073/pnas.97.18.10231. - DOI - PMC - PubMed
    1. Yip ES, Grublesky BT, Hussa EA, Visick KL. 2005. A novel, conserved cluster of genes promotes symbiotic colonization and σ54-dependent biofilm formation by Vibrio fischeri. Mol Microbiol 57:1485–1498. doi:10.1111/j.1365-2958.2005.04784.x. - DOI - PubMed

Publication types

MeSH terms

LinkOut - more resources