. 2021 Oct 4;22(1):282.
doi: 10.1186/s13059-021-02493-x.

Epigenetic dynamics shaping melanophore and iridophore cell fate in zebrafish

Affiliations

Epigenetic dynamics shaping melanophore and iridophore cell fate in zebrafish

Hyo Sik Jang et al. Genome Biol. .

Abstract

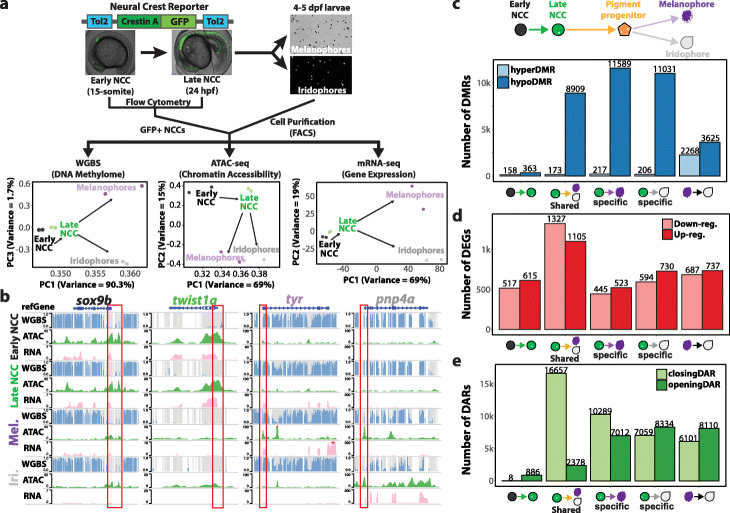
Background: Zebrafish pigment cell differentiation provides an attractive model for studying cell fate progression as a neural crest progenitor engenders diverse cell types, including two morphologically distinct pigment cells: black melanophores and reflective iridophores. Nontrivial classical genetic and transcriptomic approaches have revealed essential molecular mechanisms and gene regulatory circuits that drive neural crest-derived cell fate decisions. However, how the epigenetic landscape contributes to pigment cell differentiation, especially in the context of iridophore cell fate, is poorly understood.

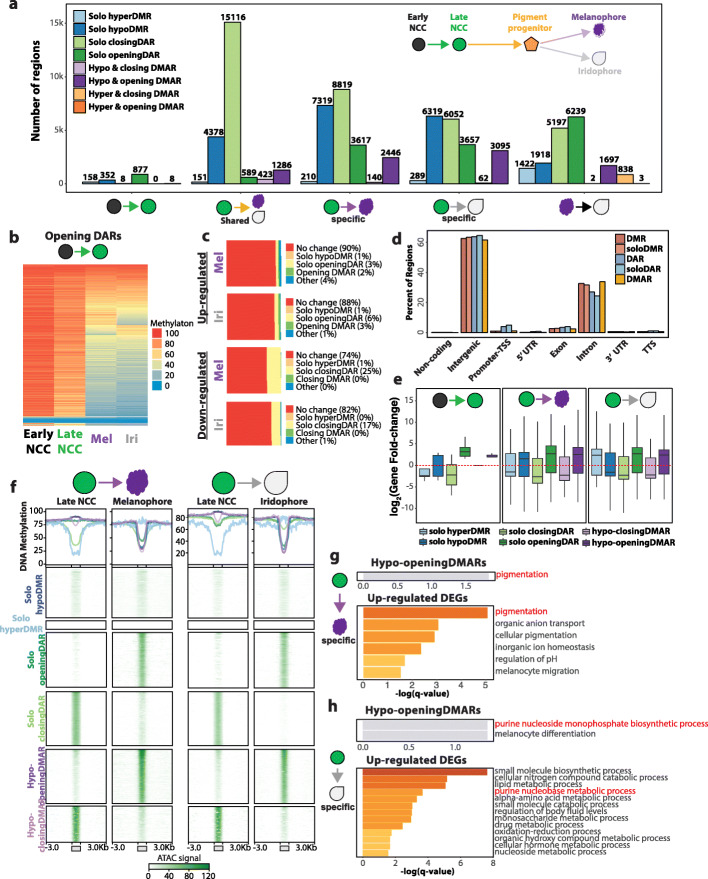
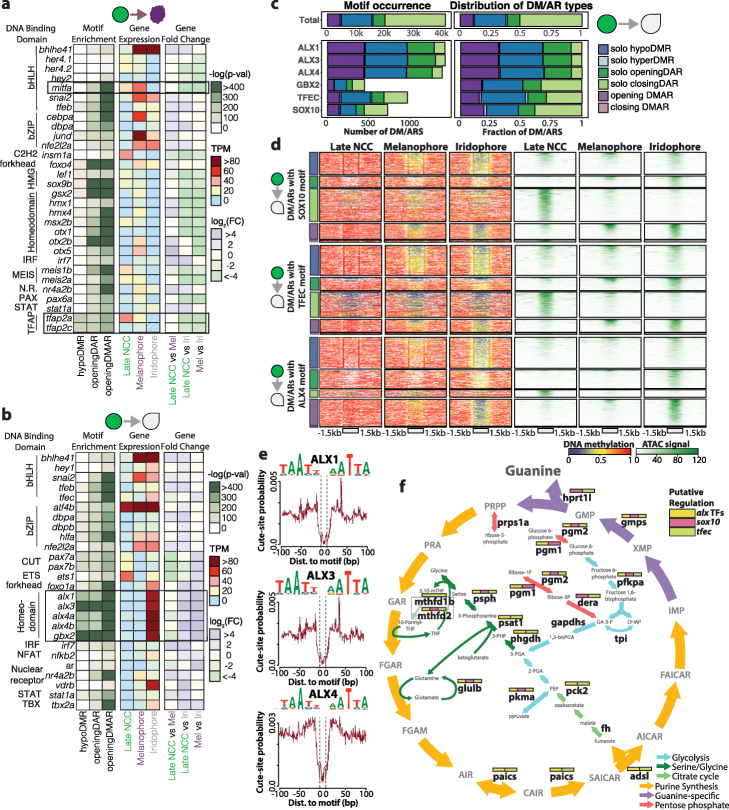
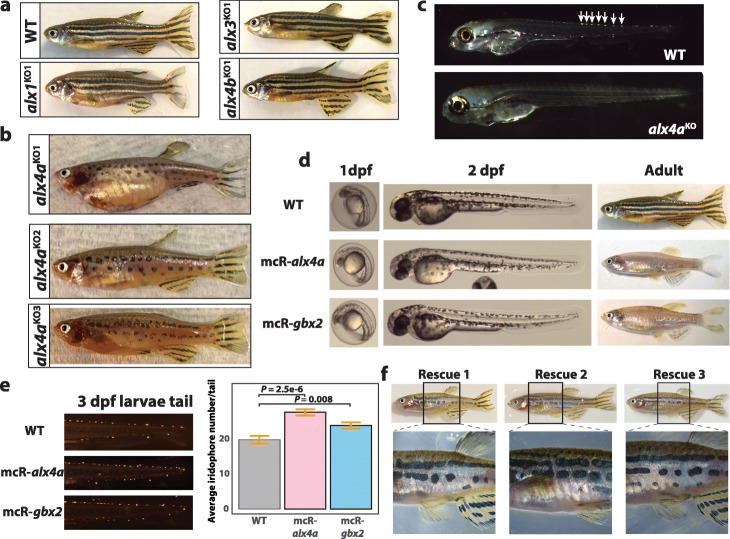
Results: We chart the global changes in the epigenetic landscape, including DNA methylation and chromatin accessibility, during neural crest differentiation into melanophores and iridophores to identify epigenetic determinants shaping cell type-specific gene expression. Motif enrichment in the epigenetically dynamic regions reveals putative transcription factors that might be responsible for driving pigment cell identity. Through this effort, in the relatively uncharacterized iridophores, we validate alx4a as a necessary and sufficient transcription factor for iridophore differentiation and present evidence on alx4a's potential regulatory role in guanine synthesis pathway.

Conclusions: Pigment cell fate is marked by substantial DNA demethylation events coupled with dynamic chromatin accessibility to potentiate gene regulation through cis-regulatory control. Here, we provide a multi-omic resource for neural crest differentiation into melanophores and iridophores. This work led to the discovery and validation of iridophore-specific alx4a transcription factor.


Conflict of interest statement

The authors declare that they have no competing interests.

Figures

Fig. 1
Fig. 1
Epigenetic and transcriptomic dynamics of neural crest cell differentiation into pigment cells. a Schematic of sample collection method and principle component analysis on the DNA methylome, chromatin accessibility, and transcriptome of each cell type. b WashU Epigenome browser views of zebrafish early neural crest marker gene (sox9b), neural crest marker gene (twist1a), melanophore marker gene (tyr), and iridophore marker gene (pnp4a). Grey bars represent CpG sites while height of the blue bars indicates methylation levels. The red box demarcates promoter regions of marker genes. c–e Bar charts illustrating the number of DMRs (c), DEGs (d), and DARs (e) when comparing early NCCs, late NCCs, melanophores, and iridophores. DMRs were identified using DSS (p value < 0.001)
Fig. 2
Fig. 2
Characterization and annotation of DMARs. a Bar plot illustrating the number of DMARs identified across pigment cell differentiation. No HyperDMARs were detected, except in melanophore vs. iridophore comparison. b Heatmap illustrating the DNA methylation levels of opening DARs identified in early NCC to late NCC transition. c Epigenetic dynamics of DEG promoters in melanophores and iridophores. d Genomic feature distribution of DMRs, DARs, and DMARs. e Expression fold-change of closest DEGs within 50 kb of epigenetically dynamic regions. f Line graphs and heatmaps representing average DNA methylation levels and ATAC peak signals respectively of epigenetically dynamic regions from late NCC to pigment cell-type comparison. g, h Gene ontology enrichment of DEGs within 50 kb of hypo-opening DMARs and upregulated DEGs in melanophore-specific (g) and iridophore-specific (h) comparison
Fig. 3
Fig. 3
Motif enrichment analysis reveals alx transcription factor family as putative regulator of iridophore development. a, b Heatmaps representing motif enrichment, gene expression, and gene fold change of transcription factors when comparing late NCC differentiation into melanophores (a) and iridophores (b). c Bar plots representing frequency and distribution of iridophore-associated DM/ARs with a particular TF motif. d Heatmaps representing DNA methylation and ATAC signal across iridophore-associated DM/ARs with specific TF motifs. e ATAC-seq footprint signatures of alx transcription factor candidates. f Model of guanine synthesis cycle. Iridophore-specific DEGs are shown in bold. Boxes above DEGs are color-coded based on detection of CREs containing TF motifs within 50 kb of DEG promoters
Fig. 4
Fig. 4
Functional validation of alx4a and gbx2 in iridophore development. a Lateral view of WT and alx1KO, alx3 KO, alx4b KO fish. b Lateral view of alx4a CRISPR-mediated knockout fish. c Iridophore detection in 4 dpf larvae of WT and alx4a knockout larvae. White arrows mark iridophores in WT larvae. d Lateral views of 1 dpf larvae, 2 dpf larvae, and adult fish comparing WT to Tg(miniCoopR-alx4a) and Tg(miniCoopR-gbx2) fish. e Representative pictures and quantification of iridophores from 3 dpf larvae tail trunks of WT (n = 21), Tg(miniCoopR-alx4a) (n = 20), and Tg(miniCoopR-gbx2) (n = 20). P values were calculated with two-tailed Welch’s t-test. Error bars represent ± SE. f Lateral whole-body view of iridophore rescue in three mosaic tg(miniCoopR-alx4a;alx4aKO) fish. Black box denotes the zoomed region in picture below

References

    1. Levine M, Davidson EH. Gene regulatory networks for development. Proc Natl Acad Sci U S A. 2005;102(14):4936–4942. doi: 10.1073/pnas.0408031102. - DOI - PMC - PubMed
    1. Moris N, Pina C, Arias AM. Transition states and cell fate decisions in epigenetic landscapes. Nat Rev Gene. 2016;17(11):693–703. doi: 10.1038/nrg.2016.98. - DOI - PubMed
    1. Dunham I, Kundaje A, Aldred SF, Collins PJ, Davis CA, Doyle F, et al. An integrated encyclopedia of DNA elements in the human genome. Nature. 2012;489(7414):57–74. doi: 10.1038/nature11247. - DOI - PMC - PubMed
    1. Consortium RE, Kundaje A, Meuleman W, Ernst J, Bilenky M, Yen A, et al. Integrative analysis of 111 reference human epigenomes. Nature. 2015;518:317–329. doi: 10.1038/nature14248. - DOI - PMC - PubMed
    1. Eisen JS, Weston JA. Development of the neural crest in the Zebrafish. Dev Biol. 1993:50–9. - PubMed

Publication types

MeSH terms