

Global urban population exposure to extreme heat
- PMID: 34607944
- PMCID: PMC8521713
- DOI: 10.1073/pnas.2024792118
Global urban population exposure to extreme heat
Abstract
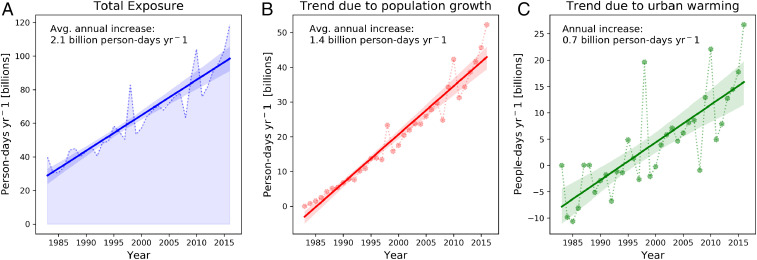
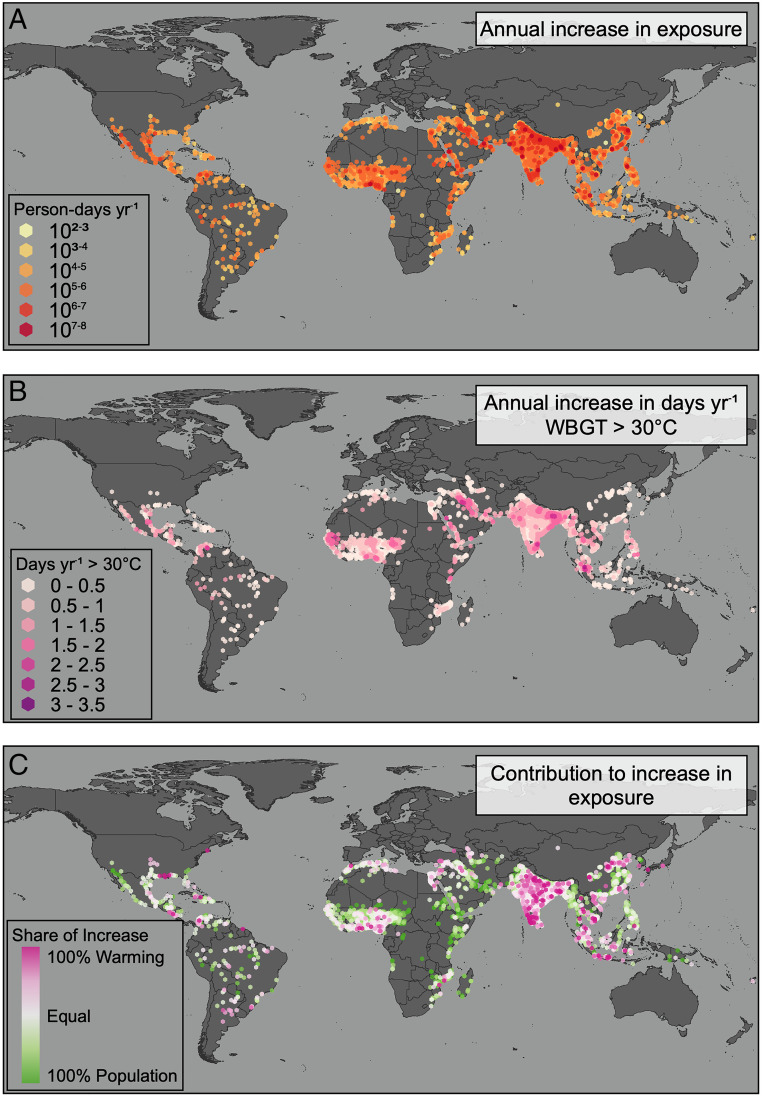
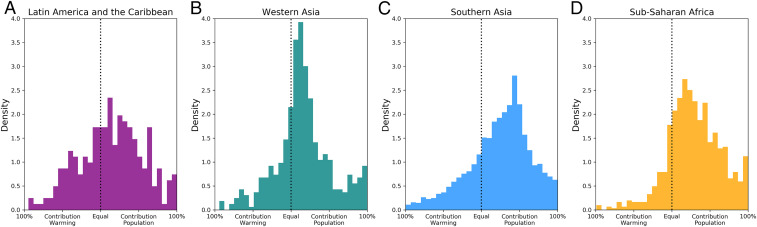
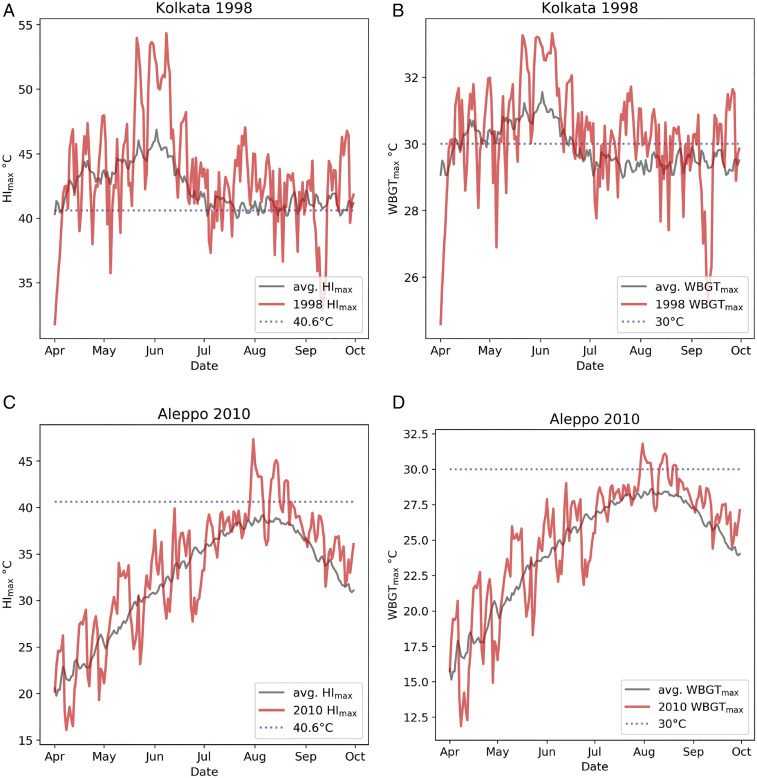
Increased exposure to extreme heat from both climate change and the urban heat island effect-total urban warming-threatens the sustainability of rapidly growing urban settlements worldwide. Extreme heat exposure is highly unequal and severely impacts the urban poor. While previous studies have quantified global exposure to extreme heat, the lack of a globally accurate, fine-resolution temporal analysis of urban exposure crucially limits our ability to deploy adaptations. Here, we estimate daily urban population exposure to extreme heat for 13,115 urban settlements from 1983 to 2016. We harmonize global, fine-resolution (0.05°), daily temperature maxima and relative humidity estimates with geolocated and longitudinal global urban population data. We measure the average annual rate of increase in exposure (person-days/year-1) at the global, regional, national, and municipality levels, separating the contribution to exposure trajectories from urban population growth versus total urban warming. Using a daily maximum wet bulb globe temperature threshold of 30 °C, global exposure increased nearly 200% from 1983 to 2016. Total urban warming elevated the annual increase in exposure by 52% compared to urban population growth alone. Exposure trajectories increased for 46% of urban settlements, which together in 2016 comprised 23% of the planet's population (1.7 billion people). However, how total urban warming and population growth drove exposure trajectories is spatially heterogeneous. This study reinforces the importance of employing multiple extreme heat exposure metrics to identify local patterns and compare exposure trends across geographies. Our results suggest that previous research underestimates extreme heat exposure, highlighting the urgency for targeted adaptations and early warning systems to reduce harm from urban extreme heat exposure.
Keywords: climate change; hazards; public health; sustainability; urbanization.
Copyright © 2021 the Author(s). Published by PNAS.
Conflict of interest statement
The authors declare no competing interest.
Figures
References
-
- Mora C., et al., Global risk of deadly heat. Nat. Clim. Chang. 7, 501 (2017).
-
- Meehl G. A., Tebaldi C., More intense, more frequent, and longer lasting heat waves in the 21st century. Science 305, 994–997 (2004). - PubMed
