. 2021 Oct 12;118(41):e2113174118.
doi: 10.1073/pnas.2113174118.

Tubular lysosomes harbor active ion gradients and poise macrophages for phagocytosis

Affiliations

Tubular lysosomes harbor active ion gradients and poise macrophages for phagocytosis

Bhavyashree Suresh et al. Proc Natl Acad Sci U S A. .

Abstract

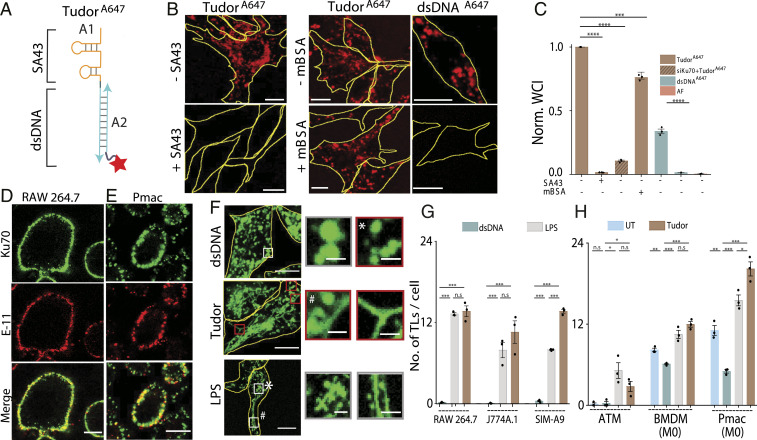
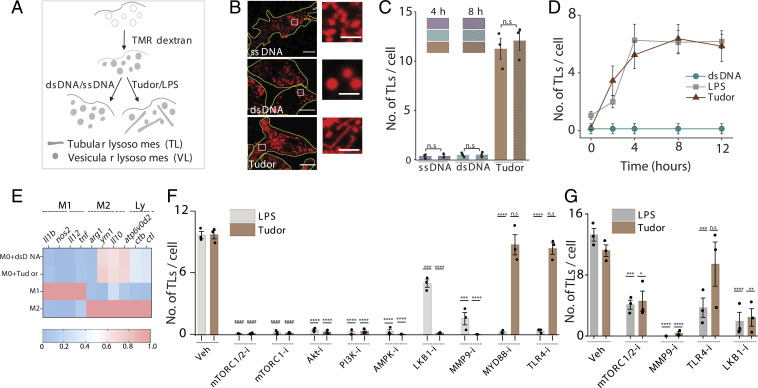
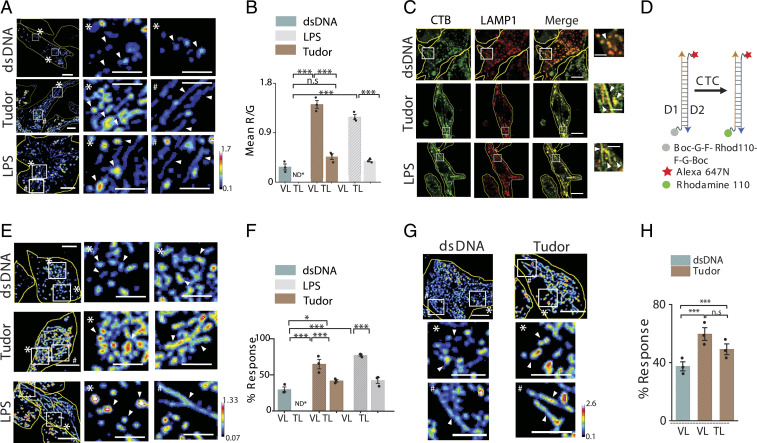
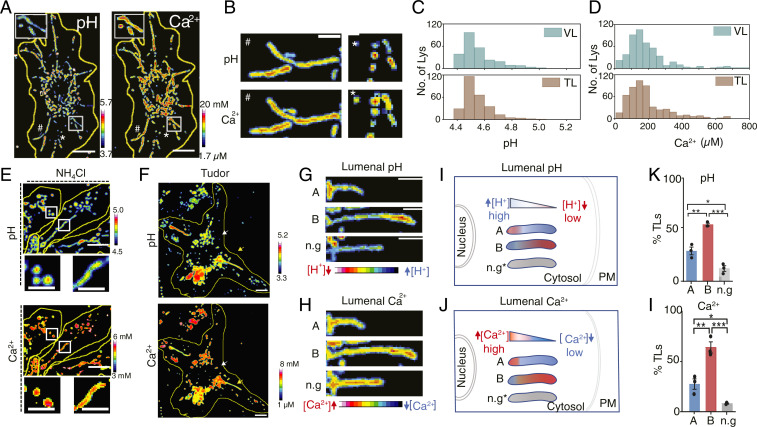
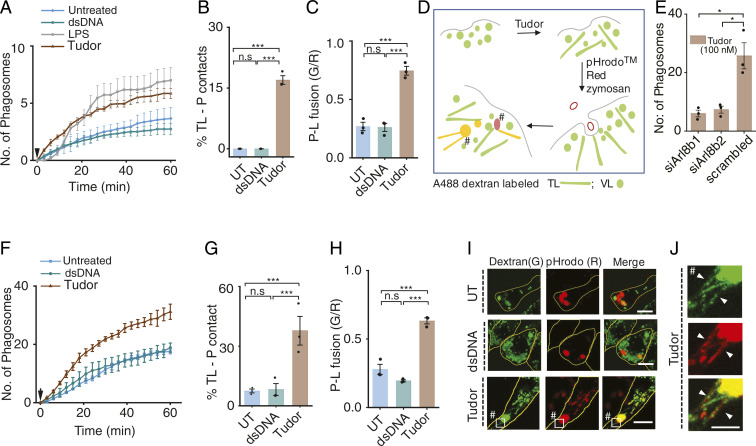
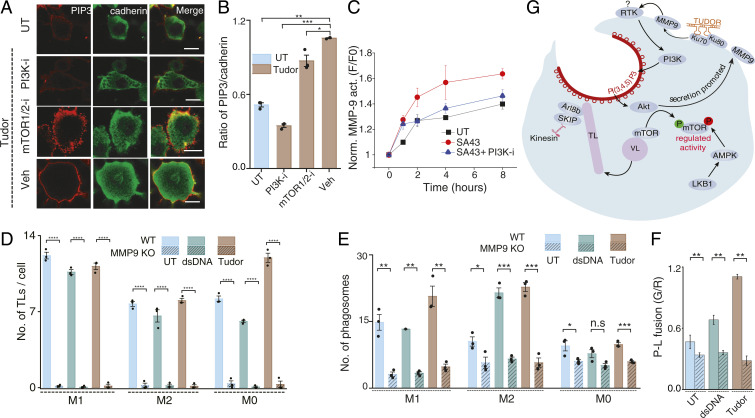
Lysosomes adopt dynamic, tubular states that regulate antigen presentation, phagosome resolution, and autophagy. Tubular lysosomes are studied either by inducing autophagy or by activating immune cells, both of which lead to cell states where lysosomal gene expression differs from the resting state. Therefore, it has been challenging to pinpoint the biochemical properties lysosomes acquire upon tubulation that could drive their functionality. Here we describe a DNA-based assembly that tubulates lysosomes in macrophages without activating them. Proteolytic activity maps at single-lysosome resolution revealed that tubular lysosomes were less degradative and showed proximal to distal luminal pH and Ca2+ gradients. Such gradients had been predicted but never previously observed. We identify a role for tubular lysosomes in promoting phagocytosis and activating MMP9. The ability to tubulate lysosomes without starving or activating immune cells may help reveal new roles for tubular lysosomes.

Keywords: DNA nanotechnology; MMP9; lysosomes; macrophages; phagocytosis.


Conflict of interest statement

The authors declare no competing interest.

Figures

Fig. 1.
Fig. 1.
A DNA nanodevice, Tudor, tubulates lysosomes. (A) Schematic of Tudor containing modules A1 bearing SA43 and A2 bearing Alexa 647N (red star). (B) TudorA647 and dsDNAA647 uptake in RAW 264.7 cells in the presence or absence of competitors (3 µM SA43 or 60 equiv mBSA). (C) Normalized whole-cell intensities (WCI) from B (N = 100 cells), AF: autofluorescence. (D and E) Images of Ku70 (green) and Pan Cadherin (E-11, red) in (D) RAW 264.7 cells and (E) Pmacs. (F) TMR dextran-labeled RAW 264.7 cells in the presence of dsDNA, Tudor, and LPS. Boxed regions are magnified (Right), VLs (*) and TLs (#). (G and H) Number of TLs per cell when treated with dsDNA, Tudor, or LPS (N = 20 cells); ****P < 0.00005; ***P < 0.0005; **P < 0.005; *P < 0.05 (unless otherwise mentioned these are one-way ANOVA with Tukey post hoc test). Unless otherwise mentioned, n.s: nonsignificant, all error bars represent SEM from three independent experiments. (Scale bars, 10 μm; Inset scale bars, 2 μm.)
Fig. 2.
Fig. 2.
Tudor nonimmunogenically tubulates lysosomes in macrophages. (A) Schematic of tubulation assay. (B) TMR-dextran–labeled lysosomes in RAW 264.7 upon treatment with single-stranded DNA (ssDNA), dsDNA, and Tudor. (Inset) Magnified images of VLs and TLs. (C) Number of TLs per cell, from B, at 4 and 8 h posttreatment (N = 25 cells). (D) Number of TLs per cell versus time of treatment with Tudor, LPS, or dsDNA in RAW 264.7 cells (N = 20 cells). (E) Heat maps of fold change of mRNA levels of M1, M2, and lysosomal markers (Ly) in BMDM (M0) upon treatment with dsDNA and Tudor. Fold changes of M1 and M2 markers are normalized to M1 and M2 BMDMs, respectively; fold changes of lysosomal markers are normalized to M0+dsDNA. (F and G) Number of TLs per cell upon Tudor or LPS treatment with pharmacological inhibitors for the indicated protein (protein-i) in RAW 264.7 cells (N = 20 cells) (F) and in M0 BMDMs (n = 20 cells) (G). ****P < 0.00005; ***P < 0.0005; **P < 0.005; *P < 0.05; n.s: nonsignificant. (Scale bars, 10 µm; Inset scale bars, 4 µm.)
Fig. 3.
Fig. 3.
Enzymatic cleavage maps show low degradation in TLs. (A) Pseudocolor R/G images of Alexa 488 dextran- (G) and DQ Red BSA- (R) labeled lysosomes in dsDNA, Tudor, or LPS-treated RAW 264.7 cells (Left). White boxes are magnified (Right). (B) Mean R/G ratios of single lysosomes in A (N = 50 cells; n = 200 lysosomes). (C) RAW 264.7 cells immunostained for CTB (green) and LAMP1 (red) upon treatment with dsDNA, Tudor, or LPS. White boxes are magnified (Right). (D) A DNA-based CTC activity reporter consisting of DNA duplex with sensing module (caged Rhodamine 110, gray), normalizing module (Alexa 647N, red), and cleaved module (Rhodamine 110, green). (E) Pseudocolored G/R images of CTC activity reporter in RAW 264.7 cells pretreated with dsDNA, Tudor, or LPS (Left). White boxes are magnified (Right). (F) Percent response of CTC reporter in VLs and TLs in dsDNA-, Tudor-, and LPS-treated cells (N = 50 cells, n = 500 lysosomes). (G) Pseudocolored G/R images of CTC activity reporter in labeled BMDMs (M0) pretreated with dsDNA or Tudor (Top). White boxes are magnified below. (H) Percent response in VLs and TLs of dsDNA- and Tudor-treated cells (N = 50, n = 500 lysosomes), *P < 0.05; ***P < 0.0005. ND*: not defined; n.s: nonsignificant. White arrowheads show VLs (*) and TLs (#). (Scale bars, 10 μm; zoomed scale bars, 2 μm.)
Fig. 4.
Fig. 4.
Heterogeneity of ionic gradient within TLs. (A) pH and Ca2+ images of CalipHluor2.0-labeled RAW 264.7 cells treated with Tudor. (B) pH and Ca2+ maps of TLs and VLs. (C and D) Lysosomal (C) pH and (D) Ca2+ distributions in VLs of dsDNA-treated RAW 264.7 and TLs of Tudor-treated cells (∼20 cells, ∼300 VLs, ∼100 TLs). (E) pH and Ca2+ images of Tudor-treated RAW 264.7 cells in the presence of 10 mM NH4Cl. (F) pH and Ca2+ images of Tudor-treated RAW 264.7 cells showing both VLs and TLs. (G and H) pH and Ca2+ maps of TLs. (I and J) Schematic of the different TL populations according to their luminal gradients and orientation in the cell. n.g.: no gradient. (K and L) Percentage of TL populations (N = 20 cells, n = 100 TLs). ***P < 0.0005; **P < 0.005; *P < 0.05. (Scale bars, 10 μm; zoomed scale bars, 2 μm.)
Fig. 5.
Fig. 5.
Tubulation promotes phagocytosis and phagosome–lysosome fusion in macrophages. (A) Average number of phagosomes versus time in RAW 264.7 cells treated with dsDNA, LPS, or Tudor. Arrow shows zymosan addition (N = 30 cells). (B) Percentage TLs contacting phagosomes (% TL-P contact) (N = 50 cells,). (C) Phagosome–lysosome fusion (P-L fusion) given by mean G/R value in RAW 264.7 cells (n = 60 cells). (D) Schematic of fusion assay in Tudor-treated cells where lysosomes and phagosomes are labeled with Alexa 488 dextran (G) and pHrodo Red zymosan (R), respectively. (E) Number of phagosomes in Tudor-treated RAW 264.7 cells depleted of Arl8b (N = 100 cells). (F) Average number of phagosomes versus time in Pmac (M0) treated with dsDNA, Tudor, or LPS. Arrow shows zymosan addition (N = ∼30 cells). (G) Percentage TLs contacting phagosomes in M0 Pmacs (n = 30 cells). (H) Extent of phagosome lysosome fusion (P-L fusion) (N = 30 cells). (I) Lysosomes (G) and phagocytosed zymosan particles (R) with or without dsDNA or Tudor treatment in RAW 264.7 cells (J) Inset of TLs-P contacts indicated by #. ***P < 0.0005; *P < 0.05 (one-way ANOVA with Tukey post hoc test). n.s: nonsignificant; n = 100 phagosomes wherever mentioned.
Fig. 6.
Fig. 6.
Role of the Tudor-mediated pathway in enhancing phagocytosis. (A) Untreated (UT) or Tudor-treated RAW 264.7 cells, immunostained for PI(3,4,5)P3 (red) and Cadherin (green) in the presence of indicated inhibitors. (B) Ratio of mean WCI of PI(3,4,5)P3 to Cadherin in A (N = 50 cells). (C) Kinetics of extracellular MMP9 activity in Tudor-treated RAW 264 cells with and without a PI3K inhibitor (PI3K-i); UT (untreated). (D) Number of TLs per cell in UT, dsDNA, or Tudor-treated wild-type (WT) and MMP9 KO BMDMs (M1, M2, and M0 states) (N = 45 cells). (E) Number of phagosomes in UT or dsDNA- or Tudor-treated WT and MMP9 KO BMDMs (M1, M2, M0 states) (N = 100 cells). (F) Extent of phagosome lysosome fusion (P-L fusion) (N = 30 cells) in UT or dsDNA- or Tudor-treated WT and MMP9 KO M2 BMDMs. (G) Proposed model of Tudor triggered lysosome tubulation pathway promoting phagocytosis. ****P < 0.00005; ***P < 0.0005; **P < 0.005; *P < 0.05; n.s: nonsignificant. (Scale bars, 10 μm.).

Similar articles

Cited by

References

    1. Perera R. M., Zoncu R., The lysosome as a regulatory hub. Annu. Rev. Cell Dev. Biol. 32, 223–253 (2016). - PMC - PubMed
    1. Hipolito V. E. B., Ospina-Escobar E., Botelho R. J., Lysosome remodelling and adaptation during phagocyte activation. Cell. Microbiol. 20, e12824 (2018). - PubMed
    1. Saric A., et al. ., mTOR controls lysosome tubulation and antigen presentation in macrophages and dendritic cells. Mol. Biol. Cell 27, 321–333 (2016). - PMC - PubMed
    1. Yu L., et al. ., Termination of autophagy and reformation of lysosomes regulated by mTOR. Nature 465, 942–946 (2010). - PMC - PubMed
    1. Bonet-Ponce L., et al. ., LRRK2 mediates tubulation and vesicle sorting from lysosomes. Sci. Adv. 6 (2020). - PMC - PubMed

Publication types

MeSH terms

LinkOut - more resources