. 2021 Oct 4;12(1):5802.
doi: 10.1038/s41467-021-25987-5.

A plastid two-pore channel essential for inter-organelle communication and growth of Toxoplasma gondii

Affiliations

A plastid two-pore channel essential for inter-organelle communication and growth of Toxoplasma gondii

Zhu-Hong Li et al. Nat Commun. .

Abstract

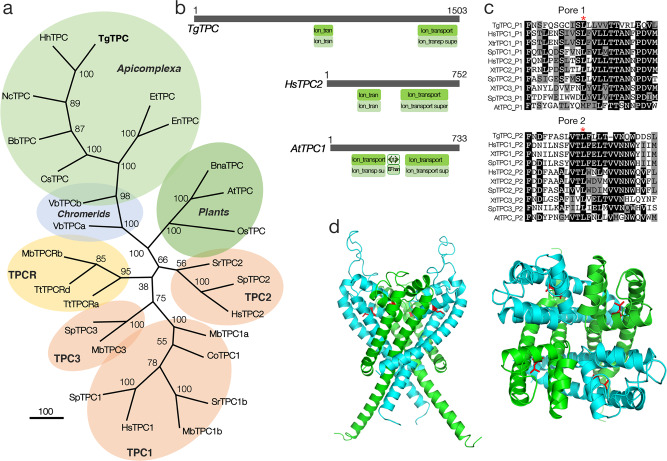
Two-pore channels (TPCs) are a ubiquitous family of cation channels that localize to acidic organelles in animals and plants to regulate numerous Ca2+-dependent events. Little is known about TPCs in unicellular organisms despite their ancient origins. Here, we characterize a TPC from Toxoplasma gondii, the causative agent of toxoplasmosis. TgTPC is a member of a novel clad of TPCs in Apicomplexa, distinct from previously identified TPCs and only present in coccidians. We show that TgTPC localizes not to acidic organelles but to the apicoplast, a non-photosynthetic plastid found in most apicomplexan parasites. Conditional silencing of TgTPC resulted in progressive loss of apicoplast integrity, severely affecting growth and the lytic cycle. Isolation of TPC null mutants revealed a selective role for TPCs in replication independent of apicoplast loss that required conserved residues within the pore-lining region. Using a genetically-encoded Ca2+ indicator targeted to the apicoplast, we show that Ca2+ signals deriving from the ER but not from the extracellular space are selectively transmitted to the lumen. Deletion of the TgTPC gene caused reduced apicoplast Ca2+ uptake and membrane contact site formation between the apicoplast and the ER. Fundamental roles for TPCs in maintaining organelle integrity, inter-organelle communication and growth emerge.


Conflict of interest statement

The authors declare no competing interests.

Figures

Fig. 1
Fig. 1. Phylogenetic placing and predicted structure of a novel TPC in Toxoplasma.
a Phylogenetic analysis of TgTPC. Cladogram of TPC and TPC-related (TPCR) sequences from coccidians and other select unicellular organisms, metazoans and plants. Abbreviations used: Tg, Toxoplasma gondii; Et, Eimeria tenella; En, Eimeria necatrix; Nc, Neospora caninum Liverpool; Hh, Hammondia hammondi strain H.H.34; Bb, Besnoitia besnoiti; Cs, Cystoisospora suis; Vb, Vitrella brassicaformis CCMP3155; At, Arabidopsis thaliana; Os, Oryza sativa Japonica Group; Bn, Brassica napus; Sr, Salpingoeca sp. ATCC 50818; Tt, Thecamonas trahens; Co: Capsaspora owczarzaki; Mb, Monosiga brevicollis; Sp, Strongylocentrotus purpuratus; Hs, Homo sapiens. Accession numbers are listed in Supplementary Table 1. b Predicted domain architecture of TgTPC. Schematic of TgTPC and TPCs from Homo sapiens (HsTPC2) and Arabidopsis thaliana (AtTPC) highlighting ion channel and EF-hand domains. c Conservation of the TgTPC pore. Multiple sequence alignment of the pore helix and selectivity filter region in the first (Pore 1) and second (Pore 2) domain of TgTPC and select animal and plant TPCs. A conserved Leucine residue (*) required for channel activity is highlighted. Abbreviations used: Tg, Toxoplasma gondii, Hs, Homo sapiens; Xt, Xenopus tropicalis, Sp, Strongylocentrotus purpuratus, At, Arabidopsis thaliana. d Structural model of the TgTPC1. Side (left) and luminal view of the TgTPC pore highlighting conserved leucine residues (red) in domain I (green) and domain II (blue).
Fig. 2
Fig. 2. The Toxoplasma TPC localizes to the apicoplast.
a Cartoon showing in situ 3′ tagging of the TgTPC gene. b Diagram showing the genetic modifications of the TgTPC gene by insertion of a regulatable promoter at the 5′ end of its coding sequence and the addition of the 3xHA at the 3′ end. DHFR, dihydrofolate reductase gene for pyrimethamine selection. CAT, chloramphenicol acetyl transferase for chloramphenicol selection. c Western blot analysis with αHA antibody (Rat antibody at 1:200) showing that ATc downregulates the expression of TgTPC to undetectable levels at 2 days. αTubulin antibody (1:5,000) was used to control loading. N = 3. d IFAs of cells expressing TgTPC-3HA. αHA was used at 1:25 dilution (red signal). The apicoplast marker was Hsp60 and the antibody αhsp60 was used at 1:1,000. The HA signal co-localizes with the apicoplast marker as well as the DAPI signal characteristic of the apicoplast. The white arrow points to the DAPI signal from the apicoplast DNA which is surrounded by the red signal. N = 3. e IFAs of the iΔTPC-3HA mutant showing co-localization of the HA with the apicoplast marker. These images were obtained with a super-resolution microscope. The antibody used was αHA at a 1:25 (red signal). The apicoplast marker was ACP and the αACP antibody was used at a 1:200 dilution (green signal). N = 2. f Immunoelectron microscopy with a αHA antibody showing TgTPC localization at the apicoplast identified by the characteristic 4 membranes (arrowheads). N = 2.
Fig. 3
Fig. 3. Downregulation of the TgTPC impacts integrity and function of the apicoplast.
a IFA with αHA showing that TPC is not expressed after 3-days of culture with ATc. The signal corresponding to the apicoplast is still present as detected with αACP. However, after 7 days with ATc the apicoplast marker Hsp60 is no longer detectable. N = 3. b labeling of the apicoplast components at the residual body 4 days after ATc treatment. Labeling of the apicoplast was done with αhsp60 (1:1,000). Arrow shows the αhsp60 and DAPI signals at the residual body. N = 3. c Routine electron microscopy of the iΔTPC grown in the presence of ATc, showing that the apicoplast becomes vacuolated. N = 2. d Lipoylation of PDH-E2 was detected by western blot analysis with an anti-lipoylated-PDH-E2 antibody (clone3H-2H4 1:1,500 dilution). iΔTPC cells treated with ATc showed decreased lipoylation of PDH-E2. N = 3. Student’s t-test was used: 3 versus 0 days, p = 0.0227. 5 versus 0 days, p = 0.0317. 7 versus 0 days, p < 0.0001. Data are presented as mean ± SD. p value: unpaired two tailed t test performed in all comparisons.
Fig. 4
Fig. 4. Downregulation of the TgTPC disrupts every step of the Toxoplasma lytic cycle.
a Plaque assays of the iΔTPC parasites cultured in the presence of 0.5 µg/ml Anhydrotetracycline (+ATc). Confluent fibroblast cells grown in 6 well plates were infected with 150 tachyzoites of the indicated cell lines for 8 days in medium ± ATc. b Growth of TatiΔku80, and iΔTPC in fibroblasts. All parasite lines express tdTomato (a red fluorescent protein) and were isolated as described in the Methods section. 1000 tdTomato expressing cells were used to infect each well of a 96 well plate. A standard curve for each cell line was developed for fluorescence vs. number of parasites. Growth of parental lines is shown as control: TatiΔku80 without (gray) and +ATc (dark gray). Growth of iΔTPC is shown without (blue) and +ATc (magenta). N = 3. c Growth kinetics evaluated by counting number of parasites per parasitophorous vacuole (PVs). Percentage of PVs with 1, 2, 4, 8, and 16 parasites for each cell line at 24 h post-infection was plotted. N = 3. d Average number of parasites/PV 24 h post-infection at 4 days and 7 days of ATc treatment of the iΔTPC cells. N = 3. p < 0.0001. Error bars represent the standard deviation (SD) of three biological replicates. e Parasites treated with ATc for 5 days showed delayed egress when stimulated with ionomycin. 50,000 tdTomato-expressing parasites of iΔTPC parasites without ATc, or treated with 0.5 µg/ml ATc for 4 days were used to infect hTERT cells and allowed to grow for 24 h. n = 16, N = 4. Error bars represent the standard deviation (SD) of 16 PVs. p = 0.0003, Student’s t test. f Invasion assays of iΔTPC cells treated with ATc for 4 and 7 days. Attached and invaded parasites from each cell line were normalized to the invasion of the TatiΔku80 cells without ATc treatment (100%). N = 3, p = 0.0056, Student’s t test. Data are presented as mean ± SD for (bf). p value: unpaired two tailed t test performed in all comparisons.
Fig. 5
Fig. 5. TgTPC regulates replication independent of apicoplast biogenesis.
a The TgTPC gene was deleted in the iΔTPC-TR parasites by using a cosmid strategy. The knockout cosmid construct was engineered in E. coli by replacing the 5′ terminus of the TPC gene with a chloramphenicol selection cassette. The construct containing the CAT selection cassette was transfected into the iΔTPC-TR parasites to replace the DHFR cassette plus 5 kb of the TPC gene by homologous recombination, generating TPC null mutant. b ΔTPC-a cultured for 12 months show apicoplast labeling by IFA with the marker αACP (1:200). N = 3. c Transmission electron microscopy of ΔTPC-a showing the characteristic apicoplast with four membranes. N = 2. d Lipoylation of PDH-E2 detected by western blot with an anti-lipoylated-PDH-E2 antibody (clone3H-2H4 1:1,500 dilution). N = 3, mean ± SD. e Plaque assays showing growth of control cells, TatiΔku80, compared with ΔTPC-a and ΔTPC-a-TPC. Confluent fibroblast cells grown in 6 well plates were infected with 150 tachyzoites of the indicated cell lines for 8 days. N = 3. f Growth of fluorescent clones of iΔTPC, ΔTPC and ΔTPC-a-TPC cells in fibroblasts in 96-well plates at 4000 parasites/well. The % of growth of each indicated cell line was normalized to growth of iΔTPC (no ATc) at day 7 (considered 100%). Inset shows the quantification of three independent experiments at day 6. Error bars represent the standard deviation (SD) of the three experiments analyzed. ΔTPC-a versus iΔTPC, p = 0.0001; ΔTPC-a versus ΔTPC-a-TPC, p < 0.0001; ΔTPC-a-TPC versus iΔTPC, p = 0.1526. N = 3. Data are presented as mean ± SD. g Partial rescue of ΔTPC mutants by Geranylgeraniol (GGOH). 4,000 tdTomato expressing ΔTPC-a cells were used to infect each well of a 96 well plate in the presence or absence of 2 µM of GGOH. Growth was monitored daily for 8 days. N = 3. Inset shows the quantification of three independent experiments at day 8. p = 0.0043. Data is presented as mean ± SD. h same protocol as in g with 200 RH parasites. Growth was monitored daily for 8 days. Inset shows cell numbers on day 8 from 3 independent experiments. N = 3, p = 0.6901. Data are presented as mean ± SD. p value: unpaired two tailed t test performed in all comparisons.
Fig. 6
Fig. 6. Regulation of replication by TgTPC requires an intact pore.
a IFAs showing that the complementation with the TgTPC cDNA (cloned in the pDT7S4my3 plasmid) generates a cell line that expresses TgTPC in the apicoplast as detected with an αMyc antibody (1:500) (red signal). N = 3. b Plaque assays of the parental line, TatiΔku80, iΔTPC (no ATc), ΔTPC-a, ΔTPC-a-iTPC, ΔTPC-a-iTPC*1and ΔTPC-a-iTPC*2. Confluent fibroblast cells grown in 6 well plates were infected with 150 tachyzoites of the indicated cell lines for 8 days. N = 3. c Quantification of plaque sizes generated by TatiΔku80, iΔTPC and ΔTPC-a-iTPC cell lines with ImageJ, 24 plaques examined from 3 independent experiments. Error bars represent standard deviation (SD) of the 24 plaques analyzed. No significant difference between TatiΔku80 and ΔTPC-a-iTPC mutants. p = 0.6019, n = 24, N = 3. d Growth of ΔTPC-a, ΔTPC-a-iTPC, ΔTPC-a-iTPC*1 and ΔTPC-a-iTPC*2 cell lines in fibroblasts. All parasite lines express tdTomato and were isolated as described in Methods. 1,000 tdTomato expressing cells were used to infect each well of a 96 well plate. The % of growth of each cell line was normalized to TatiΔku80 cells on day 8 (considered 100%). N = 3. e Growth kinetics evaluated by counting the parasites per PV 24 h post-infection. Percentage of PVs with 1, 2, 4, 8, and 16 parasites after 24 h replication of each cell line was plotted. N = 3. f Number of parasites per vacuole, 24 h after the initial infection. Comparison between ΔTPC-a, ΔTPC-a-iTPC, and ΔTPC-a- iTPC*1 and ΔTPC-a-iTPC*2 cell lines. N = 3. p < 0.0001. Data for (cf) are presented as mean ± SD. p value: unpaired two tailed t test performed in all comparisons.
Fig. 7
Fig. 7. TgTPC mediates selective Ca2+ exchange between the endoplasmic reticulum and the apicoplast.
a IFAs of ΔTPC-FNR-GCaMP6 and RH-FNR-GCaMP6 parasites showing the localization of the Ca2+ indicator with αHA (green) and its co-localization with the apicoplast marker Hsp60 (red). N = 3. b cytoplasmic Ca2+ responses of Fura2-AM loaded parasites. The experiment shows the comparison between RH (gray traces) and ΔTPC (blue traces). Thapsigargin (Thap) and Ca2+ were added at the times indicate. N = 3. c similar experiment to the one in b, with the additions reversed. N = 4. d quantification of the changes in fluorescence (ΔF slopes) after the addition of 1 µM thapsigargin (ΔF after Thap) or 1.8 mM Ca2+ (ΔF after Ca2+). The response to these two additions is not significantly different between both cell lines. ΔF after Thap (p = 0.5324, N = 3); ΔF after Ca2+ (p = 0.9534, N = 4). Data are presented as mean ± SD. e, f apicoplast GCaMP6f fluorescence changes of RH-FNR-GCaMP6 (parental, RH), ΔTPC-FNR-GCaMP6 (Δ) and ΔTPC-TPC-FNR-GCaMP6 (complemented, CM) cells in response to the addition of 1 µM Thap, 1.8 mM Ca2+ or 1 µM ionomycin (Ion). g Quantification of the ΔFs after the first addition of Thap. RH versus Δː p = 0.0005 and CM versus Δː p < 0.0001); RH: n = 7, N = 4; Δ: n = 7, N = 4; CM: N = 3. Data are presented as mean ± SD. h Quantification of the ΔFs after the first addition of Ca2+. RH versus Δ: p = 0.445; CM versus Δ: p = 0.273. RH: N = 3; Δː n = 7, N = 3; CM: N = 3. Data are presented as mean ± SD. i Quantification of the ΔF after the addition of Ion from experiments similar to the ones in (e, f). RH versus Δ: p = 0.003; CM versus Δː p = 0.0021. RH: N = 3; Δː n = 4, N = 3; CM: n = 4, N = 3. ∆F/F0 represents the change in fluorescence relative to the basal fluorescence. Data are presented as mean ± SD. p value: unpaired two tailed t test performed in all comparisons.
Fig. 8
Fig. 8. TgTPC regulates contact site formation between the endoplasmic reticulum and the apicoplast.
a Representative ER contact sites in TatiΔku80 cells (upper panels). The close contacts are indicated with the small arrows. Middle panels show images from the ΔTPC-a mutants. Lower panels show images of the ΔTPC-a-TPC complemented mutant. b Statistical analyses of the contact sites. The percentage of apicoplasts that are in close contact with the ER ( < 30 nm) in three technical repeats in different days were analyzed for comparison between the three cell lines (left panel). ΔTPC-a versus TatiΔku80: p = 0.0015; ΔTPC-a versus ΔTPC-a-TPC p = 0.0018. The ER-apicoplast distance in 50 randomly chosen cells was analyzed (right panel). p < 0.0001. Data are presented as mean ± SD. Student’s t test. p value: unpaired two tailed t test performed in all comparisons. c Immuno-EM of TPC-3HA in iΔTPC-3HA cells with αHA antibody. The TPC signal was often found in ER-Apicoplast contact sites (arrows). N = 2.

Similar articles

Cited by

References

    1. Hedrich R, Marten I. TPC1-SV channels gain shape. Mol. Plant. 2011;4:428–441. doi: 10.1093/mp/ssr017. - DOI - PubMed
    1. Patel S. Function and dysfunction of two-pore channels. Sci. Signal. 2015;8:re7. doi: 10.1126/scisignal.aab3314. - DOI - PubMed
    1. Rahman T, et al. Two-pore channels provide insight into the evolution of voltage-gated Ca2+ and Na+ channels. Sci. Signal. 2014;7:ra109. doi: 10.1126/scisignal.2005450. - DOI - PMC - PubMed
    1. Brailoiu E, et al. An ancestral deuterostome family of two-pore channels mediates nicotinic acid adenine dinucleotide phosphate-dependent calcium release from acidic organelles. J. Biol. Chem. 2010;285:2897–2901. doi: 10.1074/jbc.C109.081943. - DOI - PMC - PubMed
    1. Cai X, Patel S. Degeneration of an intracellular ion channel in the primate lineage by relaxation of selective constraints. Mol. Biol. Evol. 2010;27:2352–2359. doi: 10.1093/molbev/msq122. - DOI - PubMed

Publication types