. 2021 Oct 4;12(1):5809.
doi: 10.1038/s41467-021-26096-z.

Hamster organotypic modeling of SARS-CoV-2 lung and brainstem infection

Affiliations

Hamster organotypic modeling of SARS-CoV-2 lung and brainstem infection

Marion Ferren et al. Nat Commun. .

Abstract

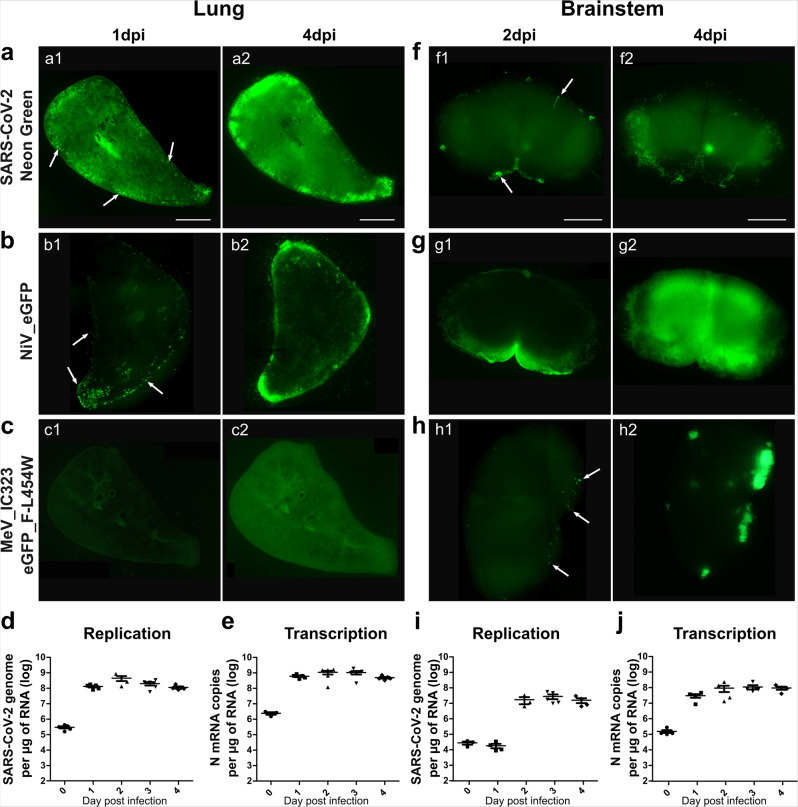
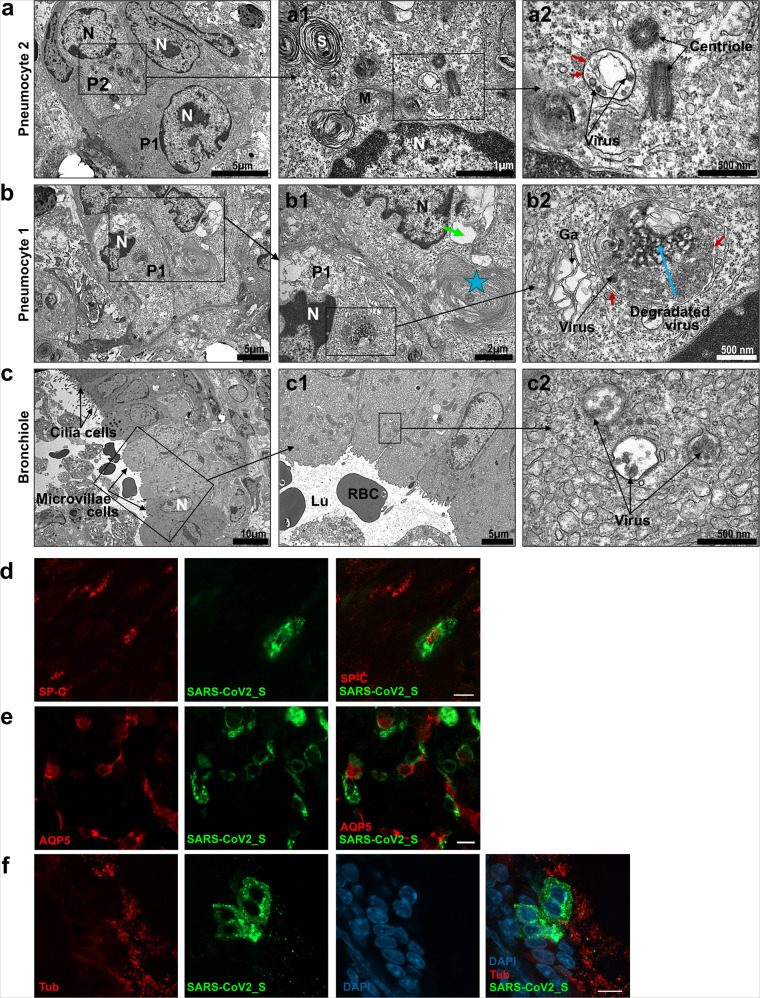
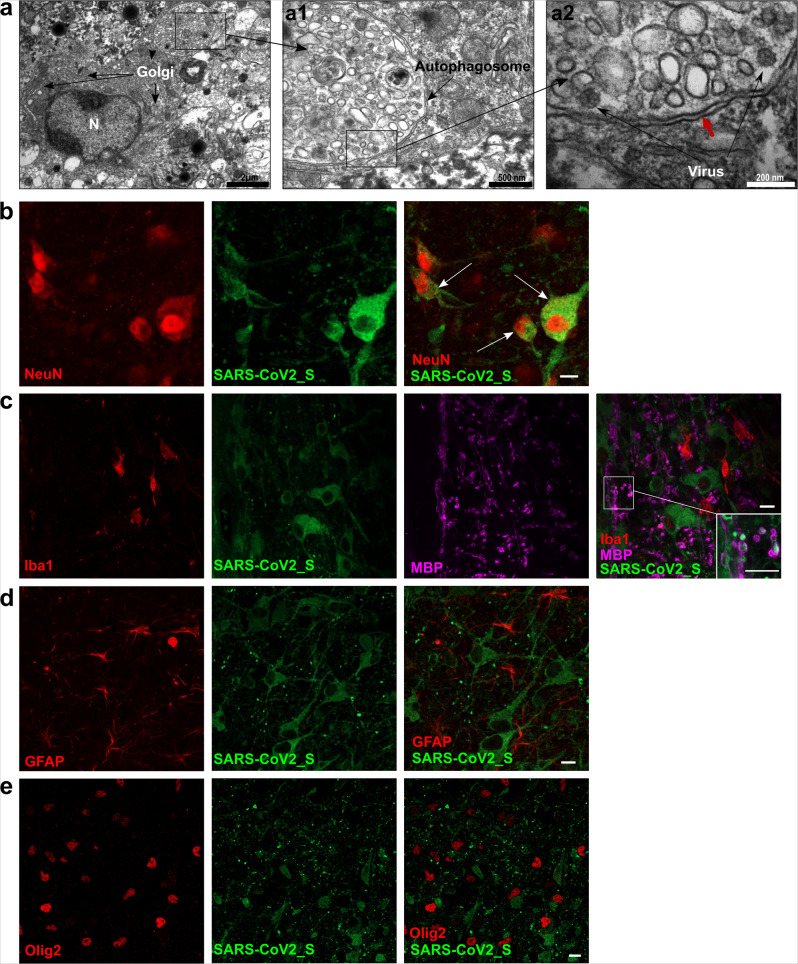
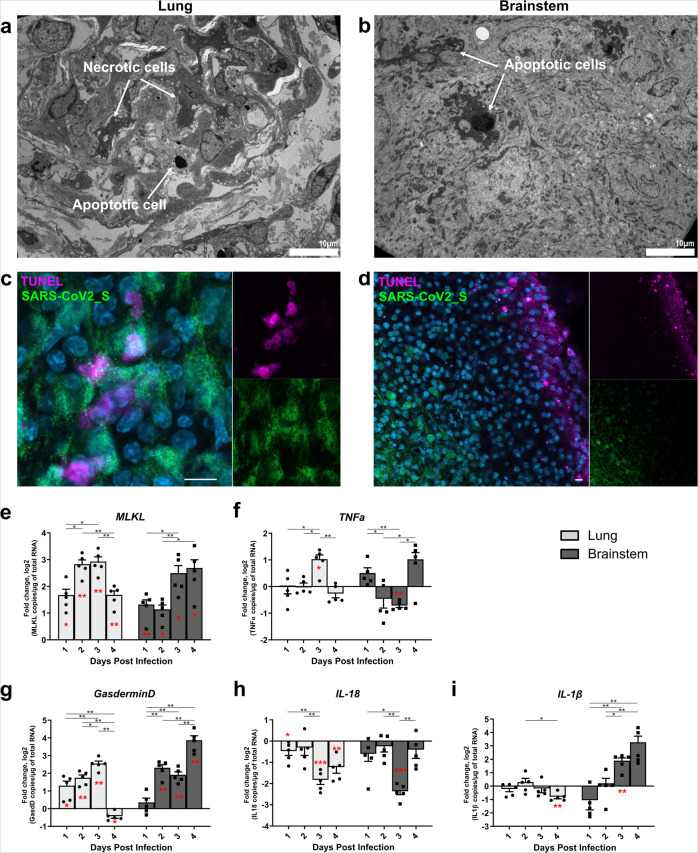
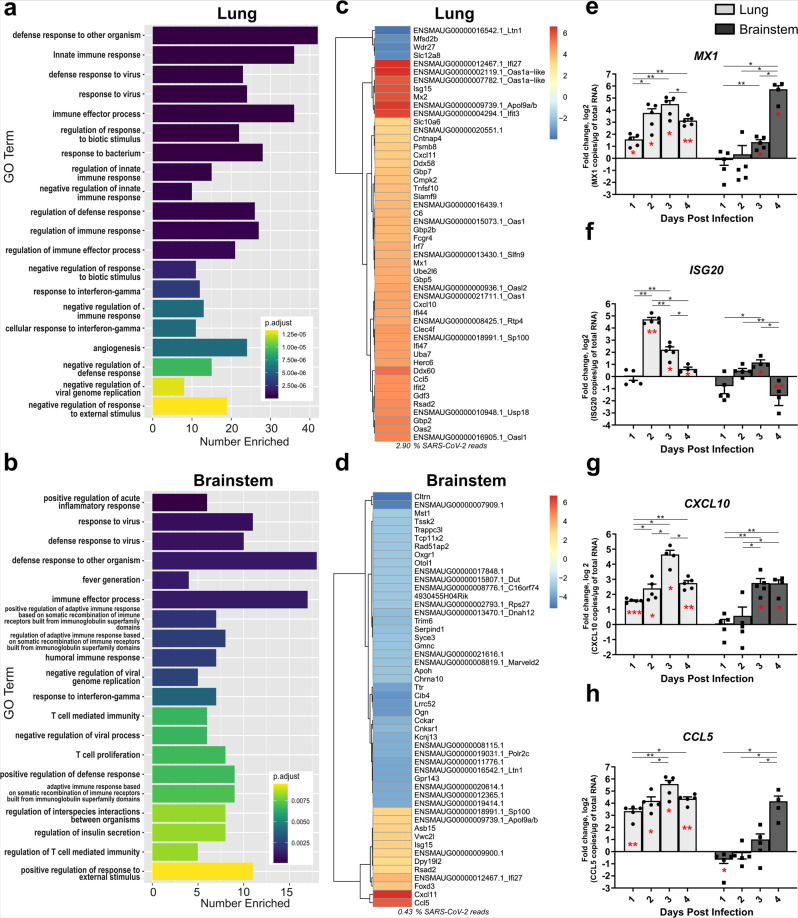
SARS-CoV-2 has caused a global pandemic of COVID-19 since its emergence in December 2019. The infection causes a severe acute respiratory syndrome and may also spread to central nervous system leading to neurological sequelae. We have developed and characterized two new organotypic cultures from hamster brainstem and lung tissues that offer a unique opportunity to study the early steps of viral infection and screening antivirals. These models are not dedicated to investigate how the virus reaches the brain. However, they allow validating the early tropism of the virus in the lungs and demonstrating that SARS-CoV-2 could infect the brainstem and the cerebellum, mainly by targeting granular neurons. Viral infection induces specific interferon and innate immune responses with patterns specific to each organ, along with cell death by apoptosis, necroptosis, and pyroptosis. Overall, our data illustrate the potential of rapid modeling of complex tissue-level interactions during infection by a newly emerged virus.


Conflict of interest statement

The authors declare no competing interests.

Figures

Fig. 1
Fig. 1. Characterization of the lung and brainstem organotypic cultures.
a Schematic representation of the generation of hamster organotypic cultures. b Cellular metabolism activity over time in % of day 0 of culture, quantified by the Alamar blue assay. (n = minimum 10 biologically independent animals). c ACE2 activity quantified with the fluorometric ACE2 Activity Assay Kit. (n = 3 biologically independent animals). d ACE2 and Neuropilin-1 basal mRNA expression (n = minimum five biologically independent animals) and eTMPRSS2, Cathepsin B, and Cathepsin L basal mRNA expression in the models quantified by RT-qPCR (day 0 of culture). (n = minimum 12 biologically independent animals). BQL below the quantification limit, ACE2 angiotensin-converting enzyme 2, PTFE polytetrafluoroethylene. Error bars represent SD. Statistical analyses were performed using the Kruskal–Wallis test. *P < 0.05; **P < 0.01; ***P < 0.001 Source data are provided as a Source Data file.
Fig. 2
Fig. 2. Hamster organotypic culture infection by three respiratory viruses and the dissemination of SARS-CoV-2.
a–c, f–h The entry of three different encephalitogenic respiratory viruses, icSARS-CoV-2-mNG (infection: 10,000 plaque-forming unit (pfu)), NiV-EGFP (infection: 5000 pfu) and the hyperfusogenic variant MeV IC323-EGFP-F L454W (infection: 1000 pfu) was monitored by following the fluorescence at 1 dpi (a1; b1; c1), or 2 dpi (f1; g1; h1) and 4 dpi (a2; b2; c2; f2; g2; h2). Pictures were taken using a Nikon Eclipse Ts2R microscope (500 ms of exposure), reconstituted using the Stitching plug-in with ImageJ software and are representative of three independent experiments. Scale bar = 1 mm. d, i SARS-CoV-2 genomes per µg of total RNA and e, j SARS-CoV-2 N mRNA copies per µg of total RNA were quantified by RT-qPCR in the lung, and brainstem organotypic cultures at 90 min post infection and 1–4 days post infection (dpi) with 5000 pfu and normalized to the standard deviation for GAPDH mRNA. (n = 5 biologically independent animals). Source data are provided as a Source Data file.
Fig. 3
Fig. 3. Antiviral activity of remdesivir, hydroxychloroquine, and 17-DMAG in hamster organotypic cultures infected by SARS-CoV-2.
a, d, f Organotypic cultures from hamsters were infected with SARS-CoV-2 at 1000 pfu/slice and treated at the indicated concentrations of remdesivir, hydroxychloroquine, and 17-DMAG at 90 min, 24, 48, and 72 h after infection (n = 5 biologically independent animals). Total RNA was harvested at 4 days post infection and the number of SARS-CoV-2 genomes was quantified by RT-qPCR. Results are expressed in % of inhibition of the infection compared with non-treated cultures. Statistical analyses were performed using the Kruskal–Wallis test. *P < 0.05; **P < 0.01; ***P < 0.001. b, e, g Total RNA extracted per organotypic culture was quantified. c The toxicity of remdesivir on uninfected cultures that were treated in the same way was assessed via the Alamar blue assay. Results are expressed as the percentage of metabolic activity after 4 days compared with the non-treated samples. All error bars represent SD. Source data are provided as a Source Data file.
Fig. 4
Fig. 4. SARS-CoV-2 tropism in hamster lung organotypic cultures during the first day of infection.
Cultures were infected with 1000 pfu of SARS-CoV-2 and fixed at day 1 post infection. ac Ultrastructure of infected lung cells by transmission electron microscopy (TEM), scale bar is represented bottom right on each picture, representative of two independent experiments. a Low magnification of lung cells; P1 = type 1 pneumocyte, P2 = type 2 pneumocyte, N = nucleus. a1 Enlargement of an infected type 2 pneumocyte with dense lamellar bodies in the cytoplasm (S = surfactant synthesis), a part of the nucleus, the centriole, mitochondria, and autophagosomal vacuoles containing virions. a2 High magnification showing the centriole and the autophagosomal vacuole containing virions. Black arrows point to the double membrane. b Lung cells undergoing degeneration, displaying vacuoles and degraded cytoplasmic material. N = nucleus, P1 = type 1 pneumocyte. b1 Enlargement of cells from the b, P1 cell contains an autophagosome containing virions, several vacuoles, and heterochromatin in the nucleus. The second cell exhibits membrane coiling (star) and large empty vacuoles (green arrow), indicating degradation. b2 High magnification showing the double membrane of the autophagosome (red arrows) containing an accumulation of viral material (blue arrow). The black arrow show viruses surrounding the vacuole. Ga = swelled Golgi apparatus. c Respiratory bronchiole showing ciliated cells and microvillous cells. N = nucleus. c1 Enlargement of the cells from c, showing microvillous cells and red blood cells (RBC) in the lumen of the bronchia (Lu). C2: high magnification showing three autophagosomes containing virions (arrows). df Lung cultures were stained with antibodies: anti-SARS-CoV-2_S, d anti-surfactant protein c (SP-C), e anti-Aquaporin 5 (AQP5), and f anti-α acetylated Tubulin (Tub). The immunofluorescence staining analysis was performed by confocal microscopy and is representative of three independent experiments. Scale bar 10 µm.
Fig. 5
Fig. 5. SARS-CoV-2 tropism in hamster brainstem organotypic cultures during the first 2 days of infection.
Cultures were infected with 1000 pfu of SARS-CoV-2 and fixed at day 2 days post infection. a Transmission electron microscopy (TEM) analysis of a brainstem slice showing an infected neuron with a large Golgi apparatus. a1, 2 Enlargement of the autophagosome containing viral particles (white arrows). The double membrane of the autophagosome is indicated with the red arrow. The results are representative of two independent experiments. be Brainstem slices stained with antibodies anti-SARS-CoV-2_S, b anti-NeuN, c anti-Myelin Basic Protein (MBP), and ionized calcium-binding adaptor molecule 1 (Iba1), d anti-glial fibrillary acidic protein (GFAP), and e anti-Olig2. The immunofluorescence staining analysis was performed by confocal microscopy and is representative of three independent experiments. Scale bar 10 µm.
Fig. 6
Fig. 6. Cell death in the ex vivo cultures.
Hamster ex vivo cultures were infected with 1000 pfu of SARS-CoV-2 (n = 5 biologically independent animals). ac Lung and brainstem slices were fixed at 1 day post infection (dpi) or 2 dpi, respectively. a, b Transmission electron microscopy analysis showing necrotic cells and apoptotic cells, scale bar is represented bottom right on each picture. c, d SARS-CoV-2_S protein immunostaining, and terminal deoxynucleotidyl transferase dUTP nick end labeling (TUNEL) labeling in the lung and brainstem. Nuclei were counterstained with DAPI. ei mRNA expression level of e MLKL, f TNF-α, g Gasdermin D, hIL1β, and i IL-18 over time. mRNA copies per µg of total RNA were quantified by RT-qPCR and normalized to the variation of the amounts of GAPDH mRNA. Fold changes are relative to the number of copies of mRNAs in infected organotypic cultures compared to the uninfected ones. Error bars represent SD. Statistical analyses were performed using the Mann–Whitney test two-sided to compare the fold changes between days of culture (black stars). mRNA expression levels in infected samples were also compared with non-infected samples at the corresponding time point (red stars) using the one-sample T-test. *P < 0.05; **P < 0.01; ***P < 0.001. Scale bar 10 µm. Source data are provided as a Source Data file.
Fig. 7
Fig. 7. Innate immune transcriptional signature in lung and brainstem organotypic cultures during SARS-CoV-2 infection.
Hamster ex vivo cultures were infected with 1000 pfu of SARS-CoV-2 (n = 5 biologically independent animals). ad Transcriptomic analysis of the organotypic lung cultures and brainstem cultures 4 days post infection. a, b Gene Ontology (GO) analysis. For each tissue, the 20 non-redundant GO categories with the lowest adjusted p value for Fisher exact test of enrichment were displayed using ggplot. c, d Heatmaps generated by calculating the log2-fold change for infected samples relative to uninfected samples and taking the 50 with the largest absolute value. e–h mRNA expression level of e MX1, f ISG20, g CXCL10, and h CCL5 over time. mRNA copies per µg of total RNA were quantified by RT-qPCR and normalized to the variation of the amounts of GAPDH mRNA. Fold changes are relative to the number of copies of mRNA in infected organotypic cultures compared to the uninfected ones. Error bars represent SD. Statistical analyses were performed using the Mann–Whitney test two-sided to compare the fold changes between days of culture (black stars). mRNA expression level in infected samples was also compared with non-infected samples at the corresponding time point (red stars) using the one sample t test. *P < 0.05; **P < 0.01; ***P < 0.001. MX1 Myxovirus Resistance 1, ISG20 Interferon Stimulated Exonuclease Gene 20, CXCL10 C-X-C Motif Chemokine Ligand 10, CCL5: C-C Motif Chemokine Ligand 5. Source data are provided as a Source Data file.

References

    1. Worldometer. Coronavirus Cases. Worldometer (2021). Available at: https://www.worldometers.info/coronavirus/. (Accessed: 20th April 2021).
    1. Orsucci, D., Ienco, E. C., Nocita, G., Napolitano, A. & Vista, M. Neurological features of COVID-19 and their treatment: a review. Drugs Context9, 2020-5-1 (2020). - PMC - PubMed
    1. Khoo A, et al. Postinfectious brainstem encephalitis associated with SARS-CoV-2. J. Neurol. Neurosurg. Psychiatry. 2020;91:jnnp-2020–323816. doi: 10.1136/jnnp-2020-323816. - DOI - PubMed
    1. Rábano-Suárez P, et al. Generalized myoclonus in COVID-19. Neurology. 2020;95:e767–e772. doi: 10.1212/WNL.0000000000009829. - DOI - PMC - PubMed
    1. Solomon IH, et al. Neuropathological features of covid-19. N. Engl. J. Med. 2020;383:989–992. doi: 10.1056/NEJMc2019373. - DOI - PMC - PubMed

Publication types

MeSH terms