. 2021 Oct 4;11(1):19692.
doi: 10.1038/s41598-021-99082-6.

Divergent connectomic organization delineates genetic evolutionary traits in the human brain

Affiliations

Divergent connectomic organization delineates genetic evolutionary traits in the human brain

Elisenda Bueichekú et al. Sci Rep. .

Abstract

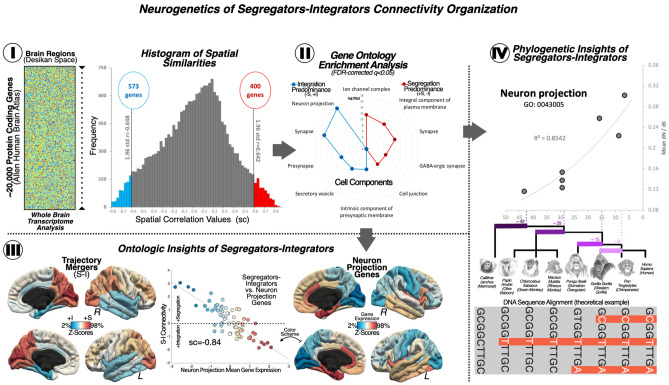
The relationship between human brain connectomics and genetic evolutionary traits remains elusive due to the inherent challenges in combining complex associations within cerebral tissue. In this study, insights are provided about the relationship between connectomics, gene expression and divergent evolutionary pathways from non-human primates to humans. Using in vivo human brain resting-state data, we detected two co-existing idiosyncratic functional systems: the segregation network, in charge of module specialization, and the integration network, responsible for information flow. Their topology was approximated to whole-brain genetic expression (Allen Human Brain Atlas) and the co-localization patterns yielded that neuron communication functionalities-linked to Neuron Projection-were overrepresented cell traits. Homologue-orthologue comparisons using dN/dS-ratios bridged the gap between neurogenetic outcomes and biological data, summarizing the known evolutionary divergent pathways within the Homo Sapiens lineage. Evidence suggests that a crosstalk between functional specialization and information flow reflects putative biological qualities of brain architecture, such as neurite cellular functions like axonal or dendrite processes, hypothesized to have been selectively conserved in the species through positive selection. These findings expand our understanding of human brain function and unveil aspects of our cognitive trajectory in relation to our simian ancestors previously left unexplored.


Conflict of interest statement

The authors declare no competing interests.

Figures

Figure 1
Figure 1
Graph merging trajectories on brain networks (I) Neuroimaging data. Whole-brain functional MRI data measured as low frequency blood oxygenation level-dependent signal couplings of the cerebral cortex were recorded at the voxel level. Graph functional connectivity analysis at the node level was conducted, obtaining connectivity networks at the subject level. (II) Connectomics analyses. An example of our graph merging analysis approach is depicted (upper part in II), illustrating spatiotemporal organization changes in the brain functional networks. (1) Brain nodes, which are prone to be segregated into locally interconnected subsystems (segregating nodes or S), (2) progressively blend with other discrete nodes by means of interacting with the merging nodes (integrating nodes or I), (3) until integrating themselves into complex systems (i.e., growing nodes), (4) and finally result in organized large-scale networks or brain systems. The merging trajectory analysis (lower part in II) allows for the investigation of the reorganization of the human brain functional networks from a more segregated to a more integrated state. This analysis was based on implementing logarithmic and exponential curve fitting models after investigating the cumulative node-to-node relations, making it possible to differentiate brain regions prone to merge earlier from those likely to blend later. (III) Topological representations. Brain maps projections reflecting the networks’ spatial distribution after applying the graph merging trajectory analysis to the functional connectivity human brain data: on the left, the early trajectory mergers or the segregating nodes were discriminated after implementing a logarithmic curve fitting model; on the right, the late trajectory mergers or the integrating nodes were differentiated from the early ones after using an exponential curve fitting model. Note: All the individual and group-level analyses were done adopting a whole-brain voxel-level approach and all of them were corrected for multiple comparisons using a False Discovery Rate approach (voxel-wise FDR q < 0.05). BOLD Blood oxygenation level-dependent, S Segregating node, I Integrating node, Log. Fit Logarithmic curve fitting model, Exp. Fit Exponential curve fitting model, R Right hemisphere, L Left hemisphere.
Figure 2
Figure 2
Linking brain functional organization to genetic expression. (I) Spatial similarity analysis. On the left, a representation of the whole-brain human transcriptome information from the Allen Human Brain Atlas (AHBA) distributed in the Desikan-Killiany (DK) atlas surface anatomical transformation is offered. The genetic data was organized in a bi-dimensional matrix that contained the cortical expression of 20,737 protein-coding genes from the AHBA by 68 cortical brain regions, the parcellation obtained from the DK atlas. On the right, the results of the spatial similarity are shown. Spatial comparisons were done between the mean connectivity map—resulting from subtracting the mean connectivity maps corresponding to the early and late trajectory mergers—and cortical gene expression maps from all genes of the AHBA transcriptome. A threshold set at ± 1.96 standard deviation above or below the mean was used to identify the genes with statistically significant similarity scores. In the histogram, the area highlighted in blue corresponds to the early trajectory mergers, while the area in red represents the late trajectory mergers. (II) Enrichment analyses. Using data from the Gene Ontology resource we investigated the cellular components linked to the genes related to the early or late trajectory mergers. In the radar chart, the blue dots represent the cellular components associated with brain areas showing an integrating predominance, and the red dots represent those components associated with brain areas displaying a segregating predominance. The numbers inside the radar chart are the p values. The results are statistically significant and corrected for multiple comparisons (FDR q < 0.05). (III) Ontologic Insights of Segregators-Integrators. The relationship between the trajectory mergers mean connectivity map and the brain map capturing the cortical expression of the neuron projection has been illustrated. A high correlation is found between these two maps, indicating that brain areas with integrating tendency are related to the expression of the neuron projection cellular component. In relation to the trajectory mergers mean connectivity map, brain areas in red tones are related to segregation while blue tones are related to integration. The same color scheme was used for the neuron projection brain map and the line chart, where warmer tones indicate higher gene expression. (IV) Phylogenetic insights of segregators-integrators. The line chart and the coefficient of determination (R2) represent the regression analysis results that explored the relationship between the most significant cellular component namely Neuron Projection and important evolutionary events for the Homo Sapiens lineage (i.e., the X axis represents divergent moments expressed in million years ago). This evolutionary event, highlighted in purple tones, reflect the emergence of separation of species from oldest (i.e., marmoset, 42.6 MYA) to newest (i.e., human, 8.8 MYA). Note: Color scale represents the 2–98% of the normalized connectivity data. R Right hemisphere, L Left hemisphere, S–I Segregating–integrating nodes; + S Segregation predominance, + I Integration predominance, sc Spatial correlation or spatial similarity, std Standard deviation, GO GeneOntology, dN/dS Biological selection ratio, DNA Deoxyribonucleic acid.

Similar articles

Cited by

References

    1. Van Essen DC, Donahue CJ, Glasser MF. Development and evolution of cerebral and cerebellar cortex. Brain Behav. Evol. 2018;91:158–169. doi: 10.1159/000489943. - DOI - PMC - PubMed
    1. Franchini LF, Pollard KS. Human evolution: The non-coding revolution. BMC Biol. 2017;15:1–12. doi: 10.1186/s12915-017-0428-9. - DOI - PMC - PubMed
    1. Sousa AMM, Meyer KA, Santpere G, Gulden FO, Sestan N. Evolution of the human nervous system function, structure, and development. Cell. 2017;170:226–247. doi: 10.1016/j.cell.2017.06.036. - DOI - PMC - PubMed
    1. Bae BI, Jayaraman D, Walsh CA. Genetic changes shaping the human brain. Dev. Cell. 2015;32:423–434. doi: 10.1016/j.devcel.2015.01.035. - DOI - PMC - PubMed
    1. Preuss TM. Human brain evolution: From gene discovery to phenotype discovery. Proc. Natl. Acad. Sci. U. S. A. 2012;109:10709–10716. doi: 10.1073/pnas.1201894109. - DOI - PMC - PubMed

Publication types