. 2021 Oct 4;11(1):19629.
doi: 10.1038/s41598-021-98804-0.

Determining the immune environment of cutaneous T-cell lymphoma lesions through the assessment of lesional blood drops

Affiliations

Determining the immune environment of cutaneous T-cell lymphoma lesions through the assessment of lesional blood drops

Kan Torii et al. Sci Rep. .

Abstract

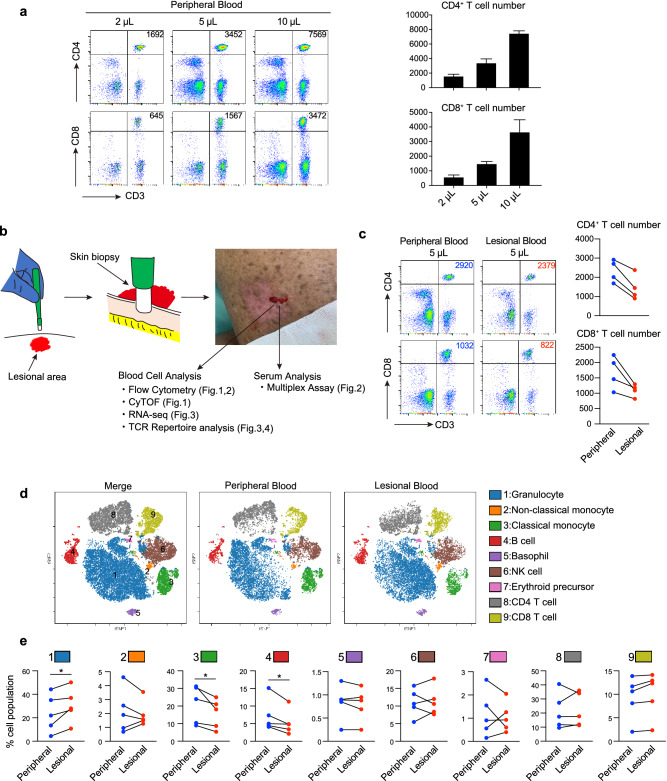
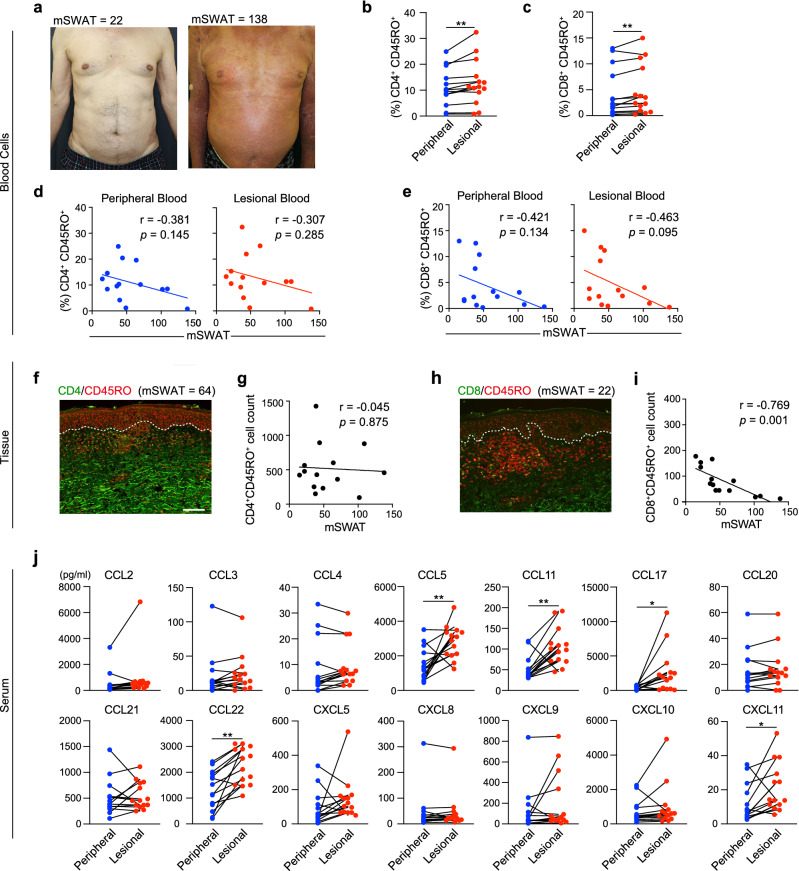
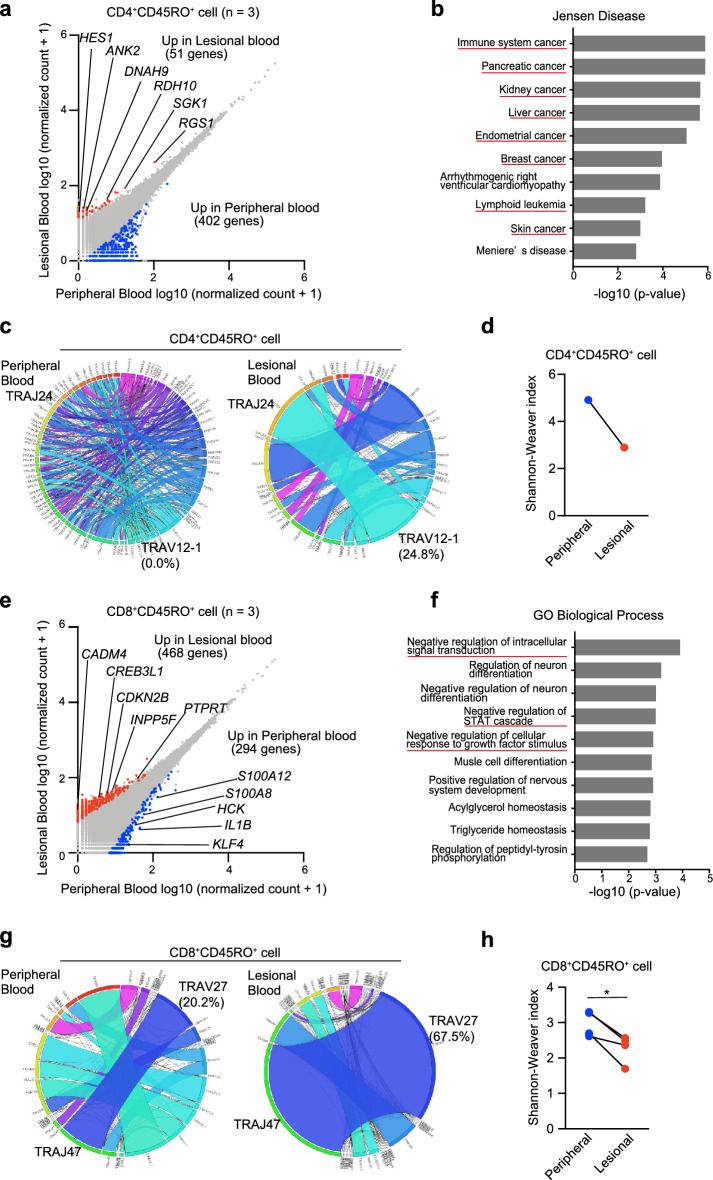
Detailed analysis of the cells that infiltrate lesional skin cannot be performed in skin biopsy specimens using immunohistochemistry or cell separation techniques because enzyme treatments applied during the isolation step can destroy small amounts of protein and minor cell populations in the biopsy specimen. Here, we describe a method for isolating T cells from drops of whole blood obtained from lesions during skin biopsy in patients with cutaneous T-cell lymphoma. Lesional blood is assumed to contain lesional resident cells, cells from capillary vessels, and blood overflowing from capillary vessels into the lesion area. The lesional blood showed substantial increases in distinct cell populations, chemokines, and the expression of various genes. The proportion of CD8+CD45RO+ T cells in the lesional blood negatively correlated with the modified severity-weighted assessment tool scores. CD4+CD45RO+ T cells in the lesional blood expressed genes associated with the development of cancer and progression of cutaneous T-cell lymphoma. In addition, CD8+CD45RO+ T cells in lesional blood had unique T-cell receptor repertoires in lesions of each stage. Assessment of lesional blood drops might provide new insight into the pathogenesis of mycosis fungoides and facilitate evaluation of the treatment efficacy for mycosis fungoides as well as other skin inflammatory diseases.


Conflict of interest statement

The authors declare no competing interests.

Figures

Figure 1
Figure 1
Cell populations differ between peripheral and lesional blood in patients with mycosis fungoides (MF). (a) Flow cytometry analysis of CD4+ and CD8+ T cells from 2, 5, and 10 μL peripheral blood for the detection of T cells in small amounts of blood. The number in the upper right corner represents the number of CD4+ and CD8+ T cells. Mean (+ standard deviation) numbers of CD4+ and CD8+ cells (n = 3) are shown in the bar graph (right). (b) Lesional blood was collected during a skin biopsy. Peripheral and lesional blood was obtained from the patient’s arm and erythematous lesion, respectively, on the same day. The collected blood cells and serum were used for the subsequent experiments. (c) Flow cytometry of CD4+ and CD8+ T cells obtained from 5 μL of peripheral and lesional blood. Numbers of CD4+ and CD8+ T cells in 5 μL of peripheral and lesional blood are shown (right, n = 4). (d) Representative mass cytometry analysis of peripheral and lesional blood from a patient with MF through viSNE analysis using Cytobank. The color of each dot represents the immune cell subset. (e) The proportion of each cell population in peripheral and lesional blood obtained from patients with MF (n = 5) quantified by mass cytometry. A paired t-test was used for the statistical analysis. * P < 0.05.
Figure 2
Figure 2
CD8+CD45RO+ cells negatively correlate with the mSWAT score in patients with MF. (a) Typical clinical features of MF lesional skin with an mSWAT score of 22 (left) and an mSWAT score of 138 (right). (b,c) The percentage of CD4+CD45RO+ and CD8+CD45RO+ T cells in lesional blood was higher than that in peripheral blood. Paired t-test. ** P < 0.01. (d,e) Correlation of CD4+CD45RO+ T cells and CD8+CD45RO+ T cells in peripheral blood and lesional blood with the mSWAT score evaluated by Pearson correlation coefficient analysis (n = 14). (f–i) Representative immunofluorescence staining of CD4/8 (green) and CD45RO (red) in MF lesional skin. Scale bar = 100 μm. Correlation of CD4+CD45RO+ cells and CD8+CD45RO+ cells with mSWAT (n = 14) evaluated by Pearson correlation coefficient analysis. Quantification of the number of cells per visual field was performed using the Hybrid Cell Count BZ-H4C analyzer software. Data were statistically analyzed using the Pearson correlation test (2-tailed). j) Results of multiplex chemokine bead assay using sera from peripheral and lesional blood (n = 14). Paired t-test. * P < 0.05, ** P < 0.01.
Figure 3
Figure 3
TCR repertoire of lesional blood is skewed, and expression of genes differs between lesional and peripheral blood. (a) Gene expression analysis through RNA-seq in CD4+CD45RO+ T cells of peripheral and lesional blood from 3 patients (Cases 12, 16, and 17). Scatter plots show the expression values of every annotated gene. Blue and red dots indicate significant upregulation of CD4+CD45RO+ T cells in peripheral and lesional blood, respectively. (b) Ten top-ranked terms from the Jensen Diseases library of Enrichr for genes upregulated in CD4+CD45RO+ T cells of lesional blood. (c) Circos plots of frequencies of Vα and Jα gene usage and combinations of productive sequences in CD4+CD45RO+ T cells of peripheral and lesional blood. The band widths represents the frequency of each VJ pair. (d) Diversity of the TCR repertoire in CD4+CD45RO+ T cells of peripheral and lesional blood was evaluated using the Shannon–Weaver Index. (e) RNA-seq in CD8+CD45RO+ T cells of peripheral and lesional blood from 3 patients (Cases 4, 18, and 19). (f) Ten top-ranked gene ontology terms of biologic processes for genes upregulated in CD8+CD45RO+ T cells of lesional blood. (g) Circos plots of CD8+CD45RO+ T cells of peripheral and lesional blood. (h) Shannon–Weaver Index of CD8+CD45RO+ T cells of peripheral and lesional blood.
Figure 4
Figure 4
CD8+CD45RO+ TCR repertoire differs depending on the stage of MF. (a,c,e) Hematoxylin and eosin (HE) staining and immunofluorescence (IF) staining of 3 types of skin lesions (erythema, plaque, and tumor) from Case 10. CD8 (green) and CD45RO (red) are shown in the immunofluorescence staining image. Collagen is stained green, and red blood cells are stained red. Scale bar = 100 μm. (b,d,f,g) Circos plots of frequencies of Vα and Jα gene usage and combinations for CD8+CD45RO+ T cells in lesional blood from erythema, plaque, and tumor stages. The Circos plot at the bottom (g) is of cells obtained from peripheral blood. (h–l) Erythema and plaque of the same skin lesion from case 15. Same experiment as shown in panels (a–g).

Similar articles

Cited by

References

    1. Li JL, et al. Intravital multiphoton imaging of immune responses in the mouse ear skin. Nat. Protoc. 2012;7:221–234. doi: 10.1038/nprot.2011.438. - DOI - PubMed
    1. Bodenlenz M, et al. Clinical applicability of dOFM devices for dermal sampling. Skin Res. Technol. 2013;19:474–483. - PubMed
    1. Hashizume H, et al. In vitro propagation and dynamics of T cells from skin biopsies by methods using interleukins-2 and -4 or anti-CD3/CD28 antibody-coated microbeads. Acta Derm. Venereol. 2010;90:468–473. doi: 10.2340/00015555-0927. - DOI - PubMed
    1. Ishimoto T, Kataoka S, Shiga T, Takaishi M, Sano S. Use of intralesional blood to determine diffusible biomarkers from skin lesions. J. Dermatol. Sci. 2018;90:75–81. doi: 10.1016/j.jdermsci.2018.01.001. - DOI - PubMed
    1. Weed J, Girardi M. The difficult–and often delayed–diagnosis of CTCL. Sci. Transl. Med. 2015;7:308fs41. doi: 10.1126/scitranslmed.aad2518. - DOI - PubMed

Publication types

MeSH terms

Substances