. 2021 Oct;18(10):1259-1264.
doi: 10.1038/s41592-021-01279-0. Epub 2021 Oct 4.

An adaptive optics module for deep tissue multiphoton imaging in vivo

Affiliations

An adaptive optics module for deep tissue multiphoton imaging in vivo

Cristina Rodríguez et al. Nat Methods. 2021 Oct.

Abstract

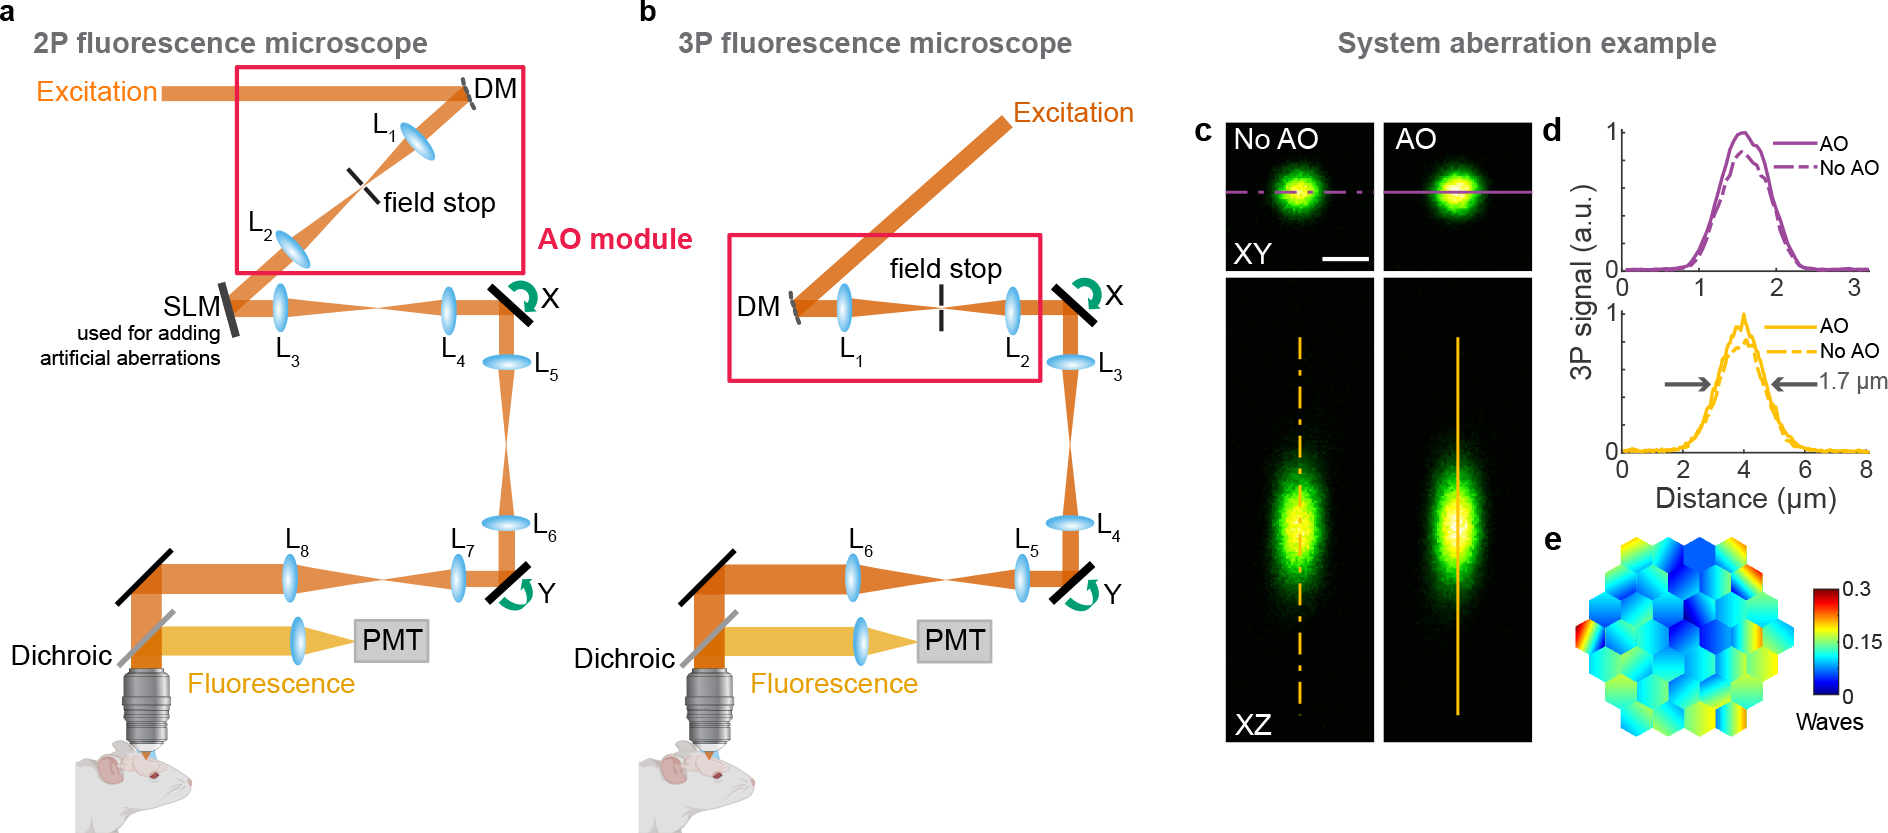
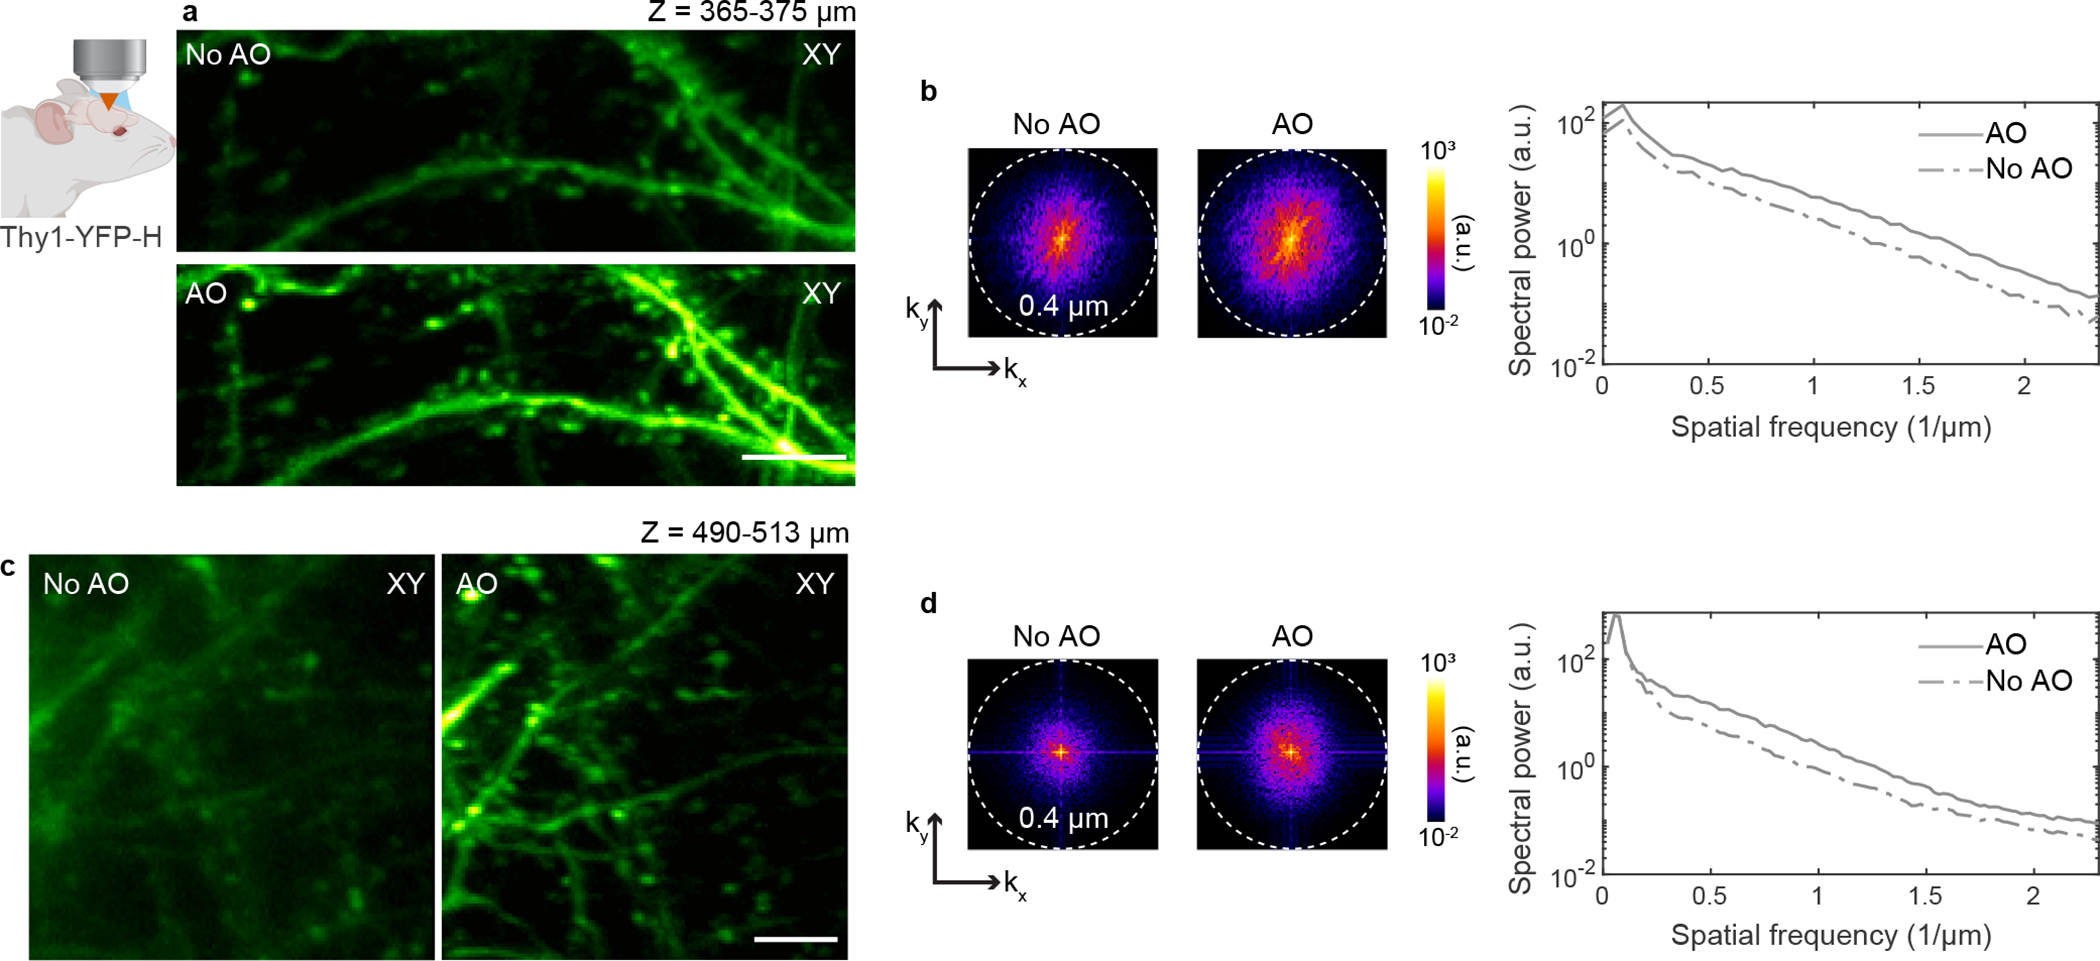
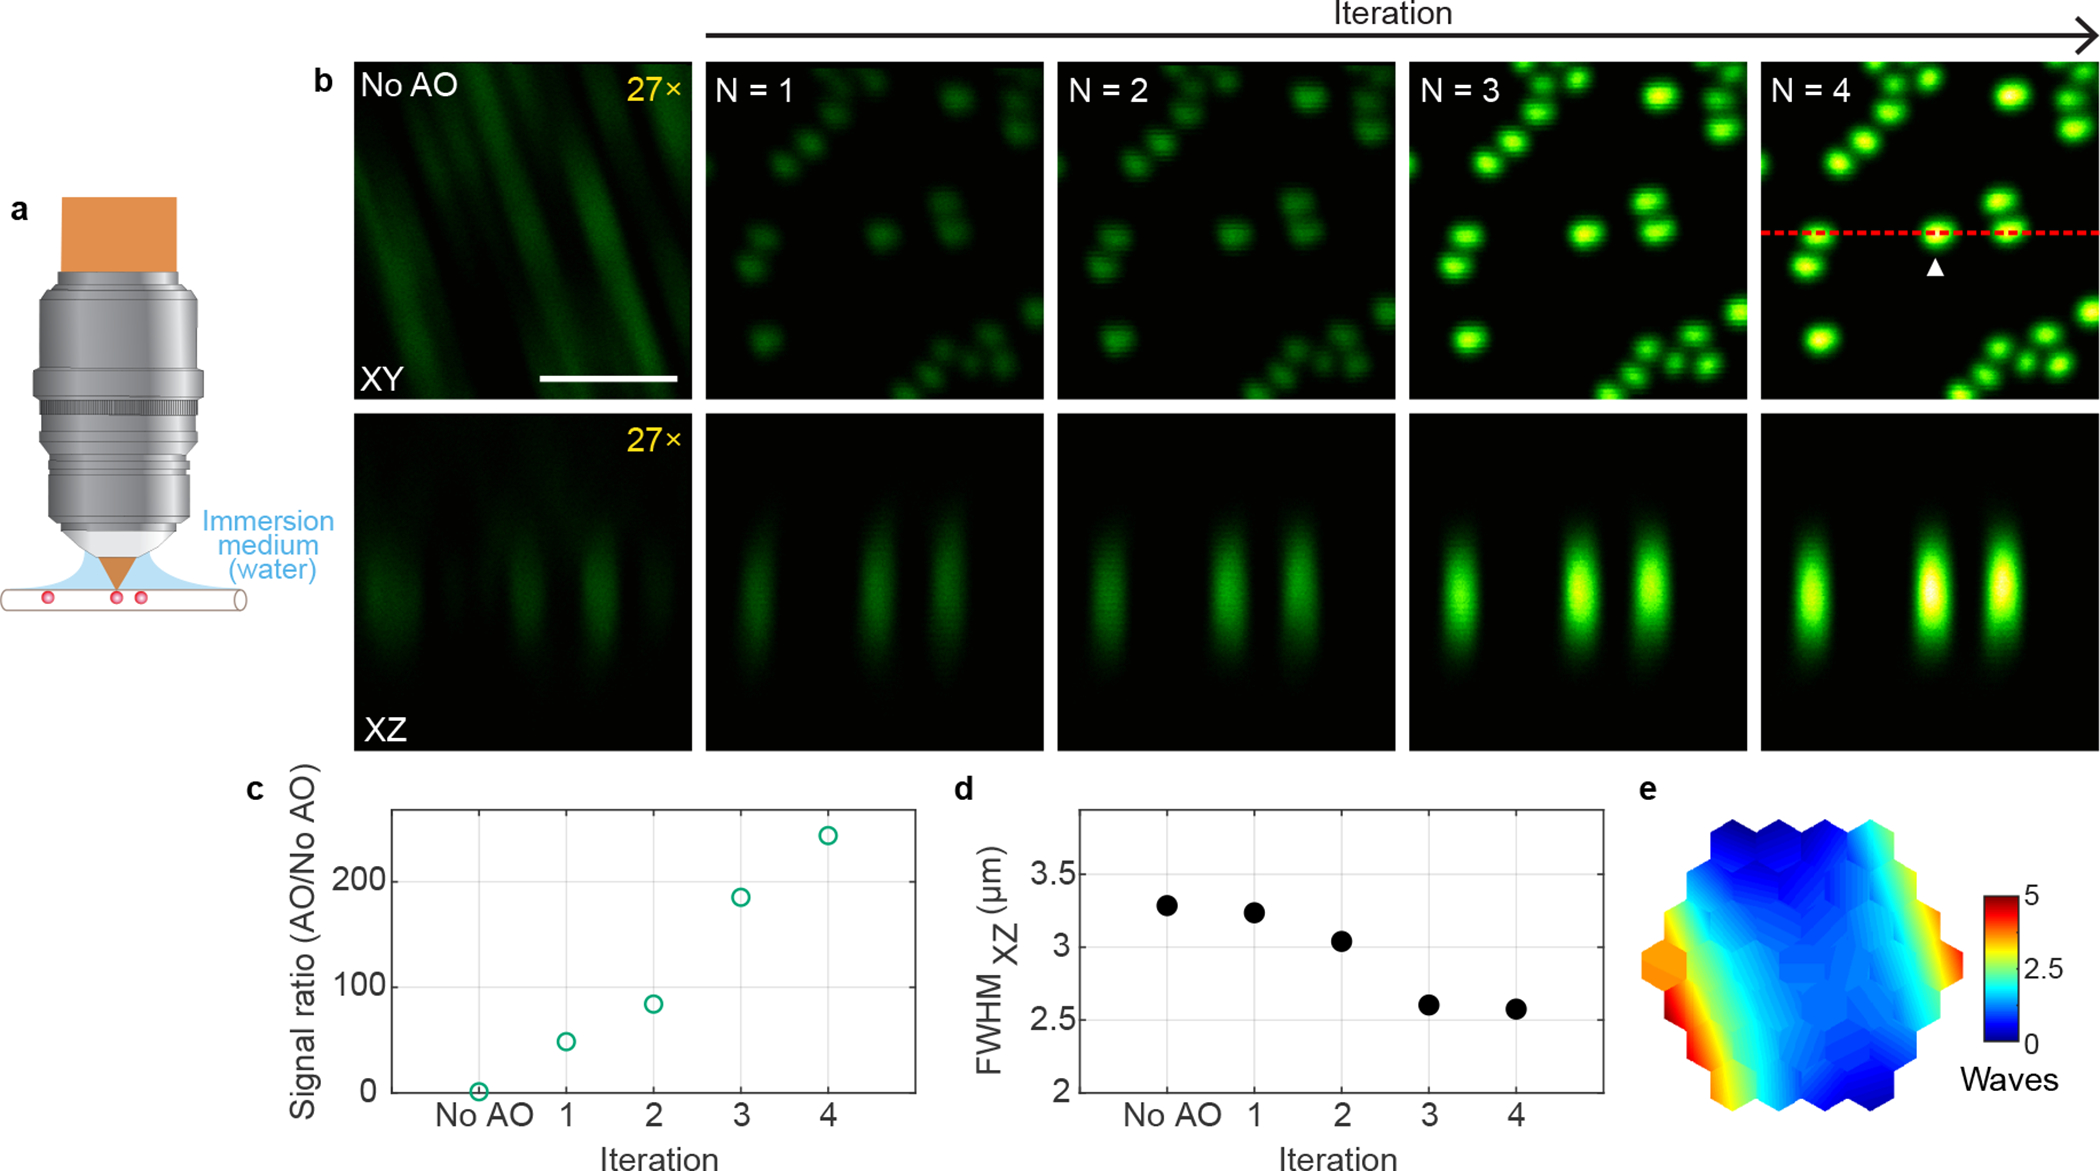
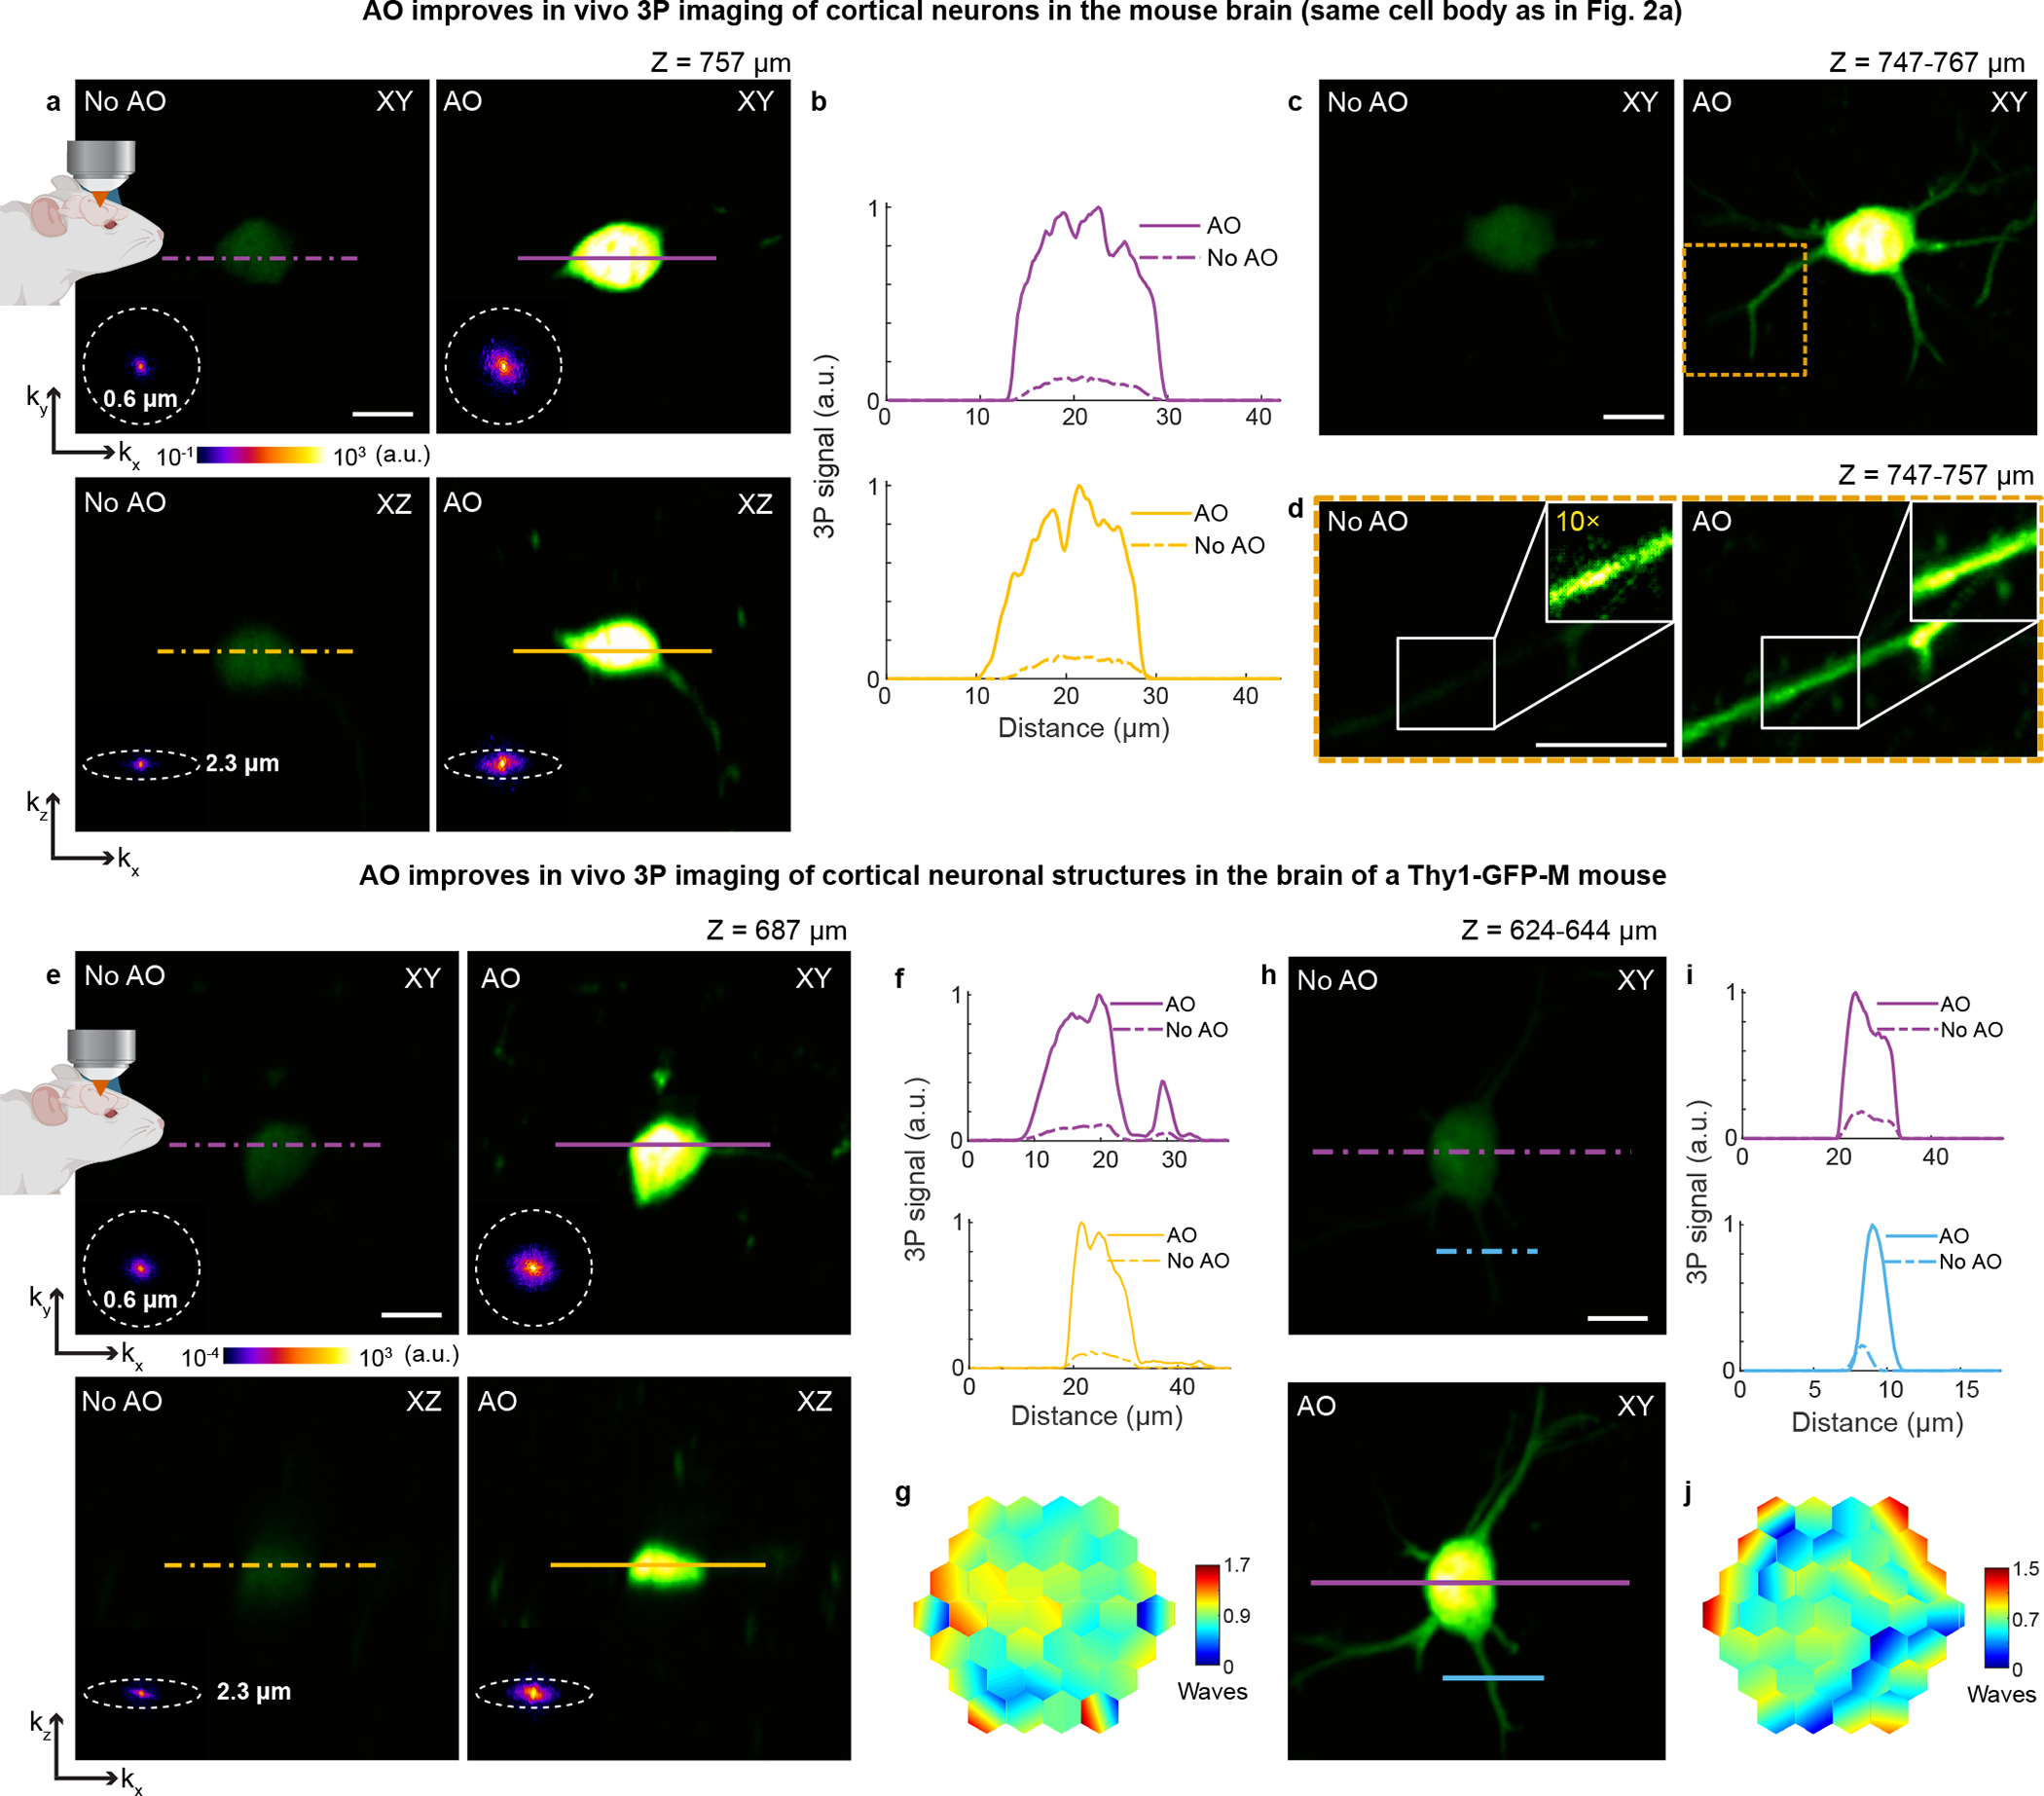
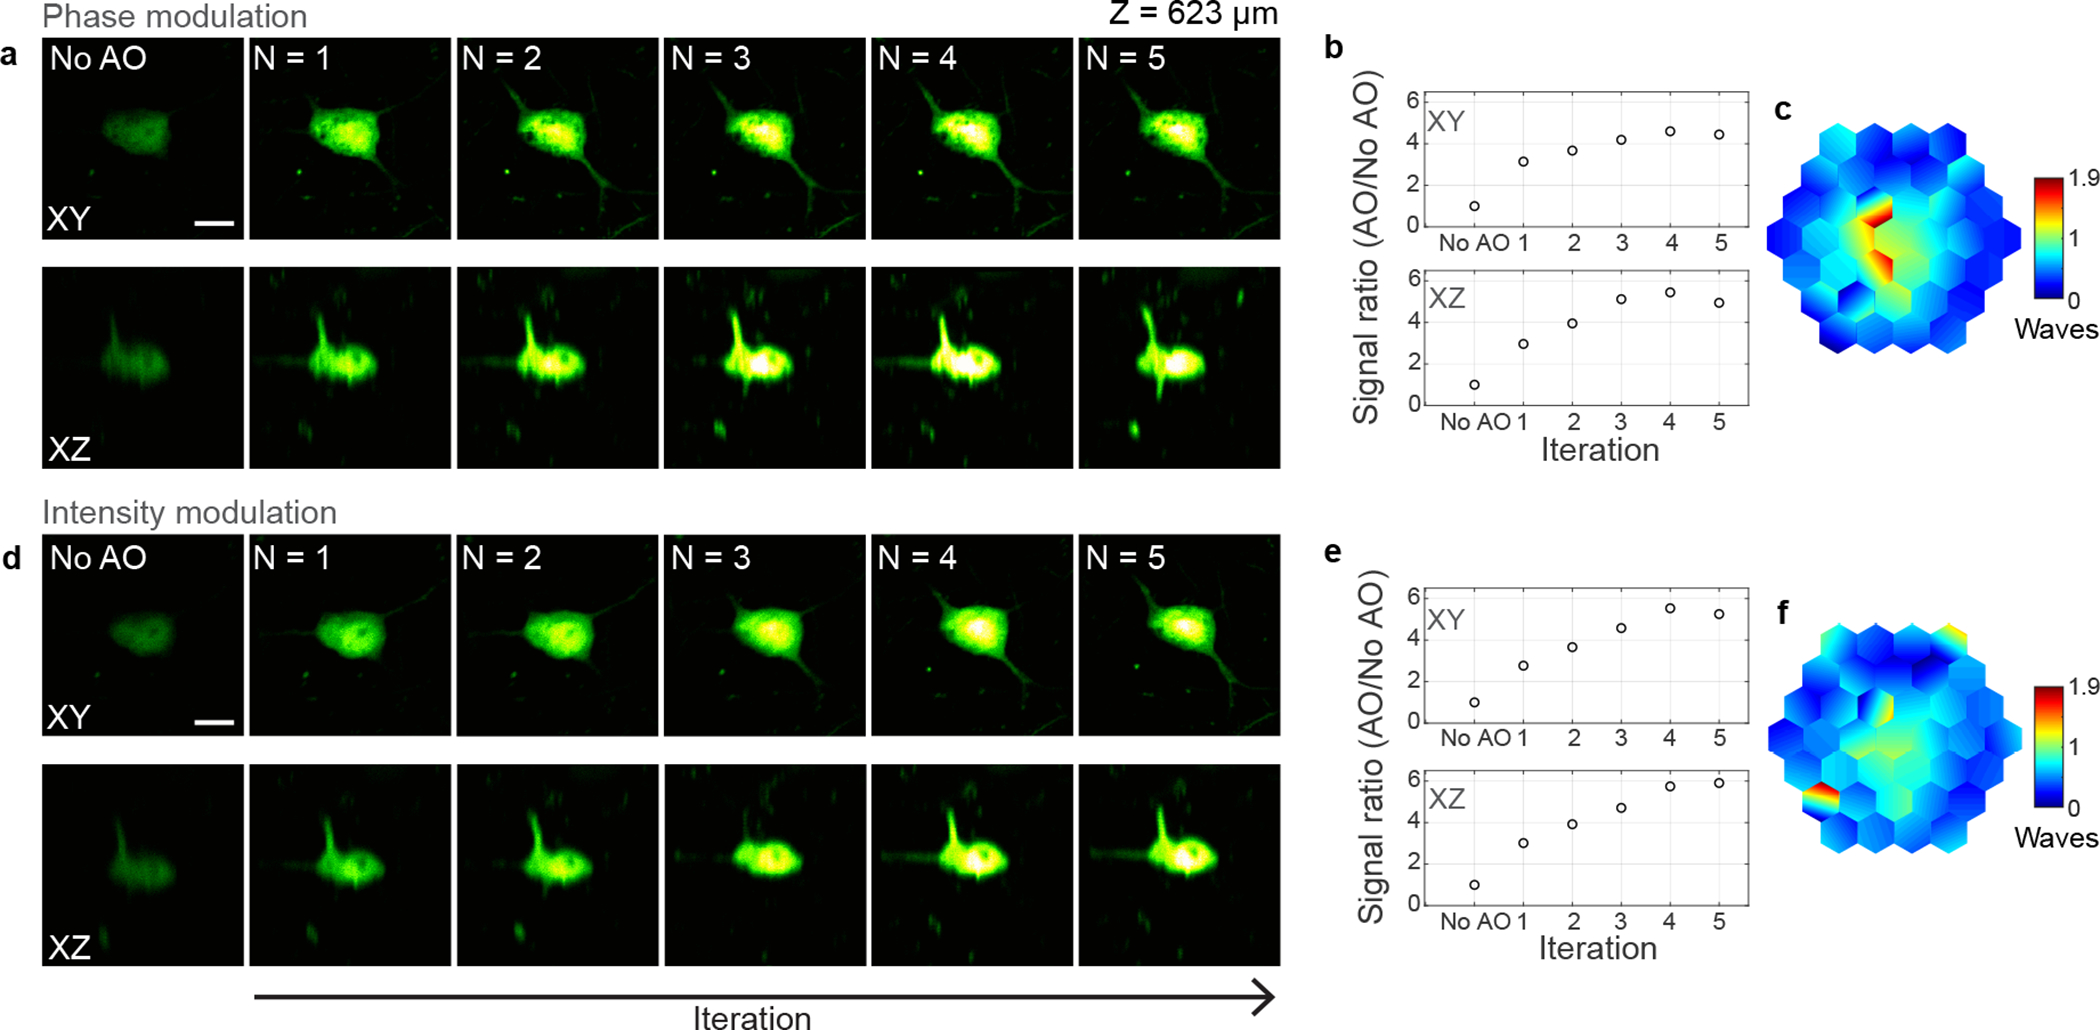
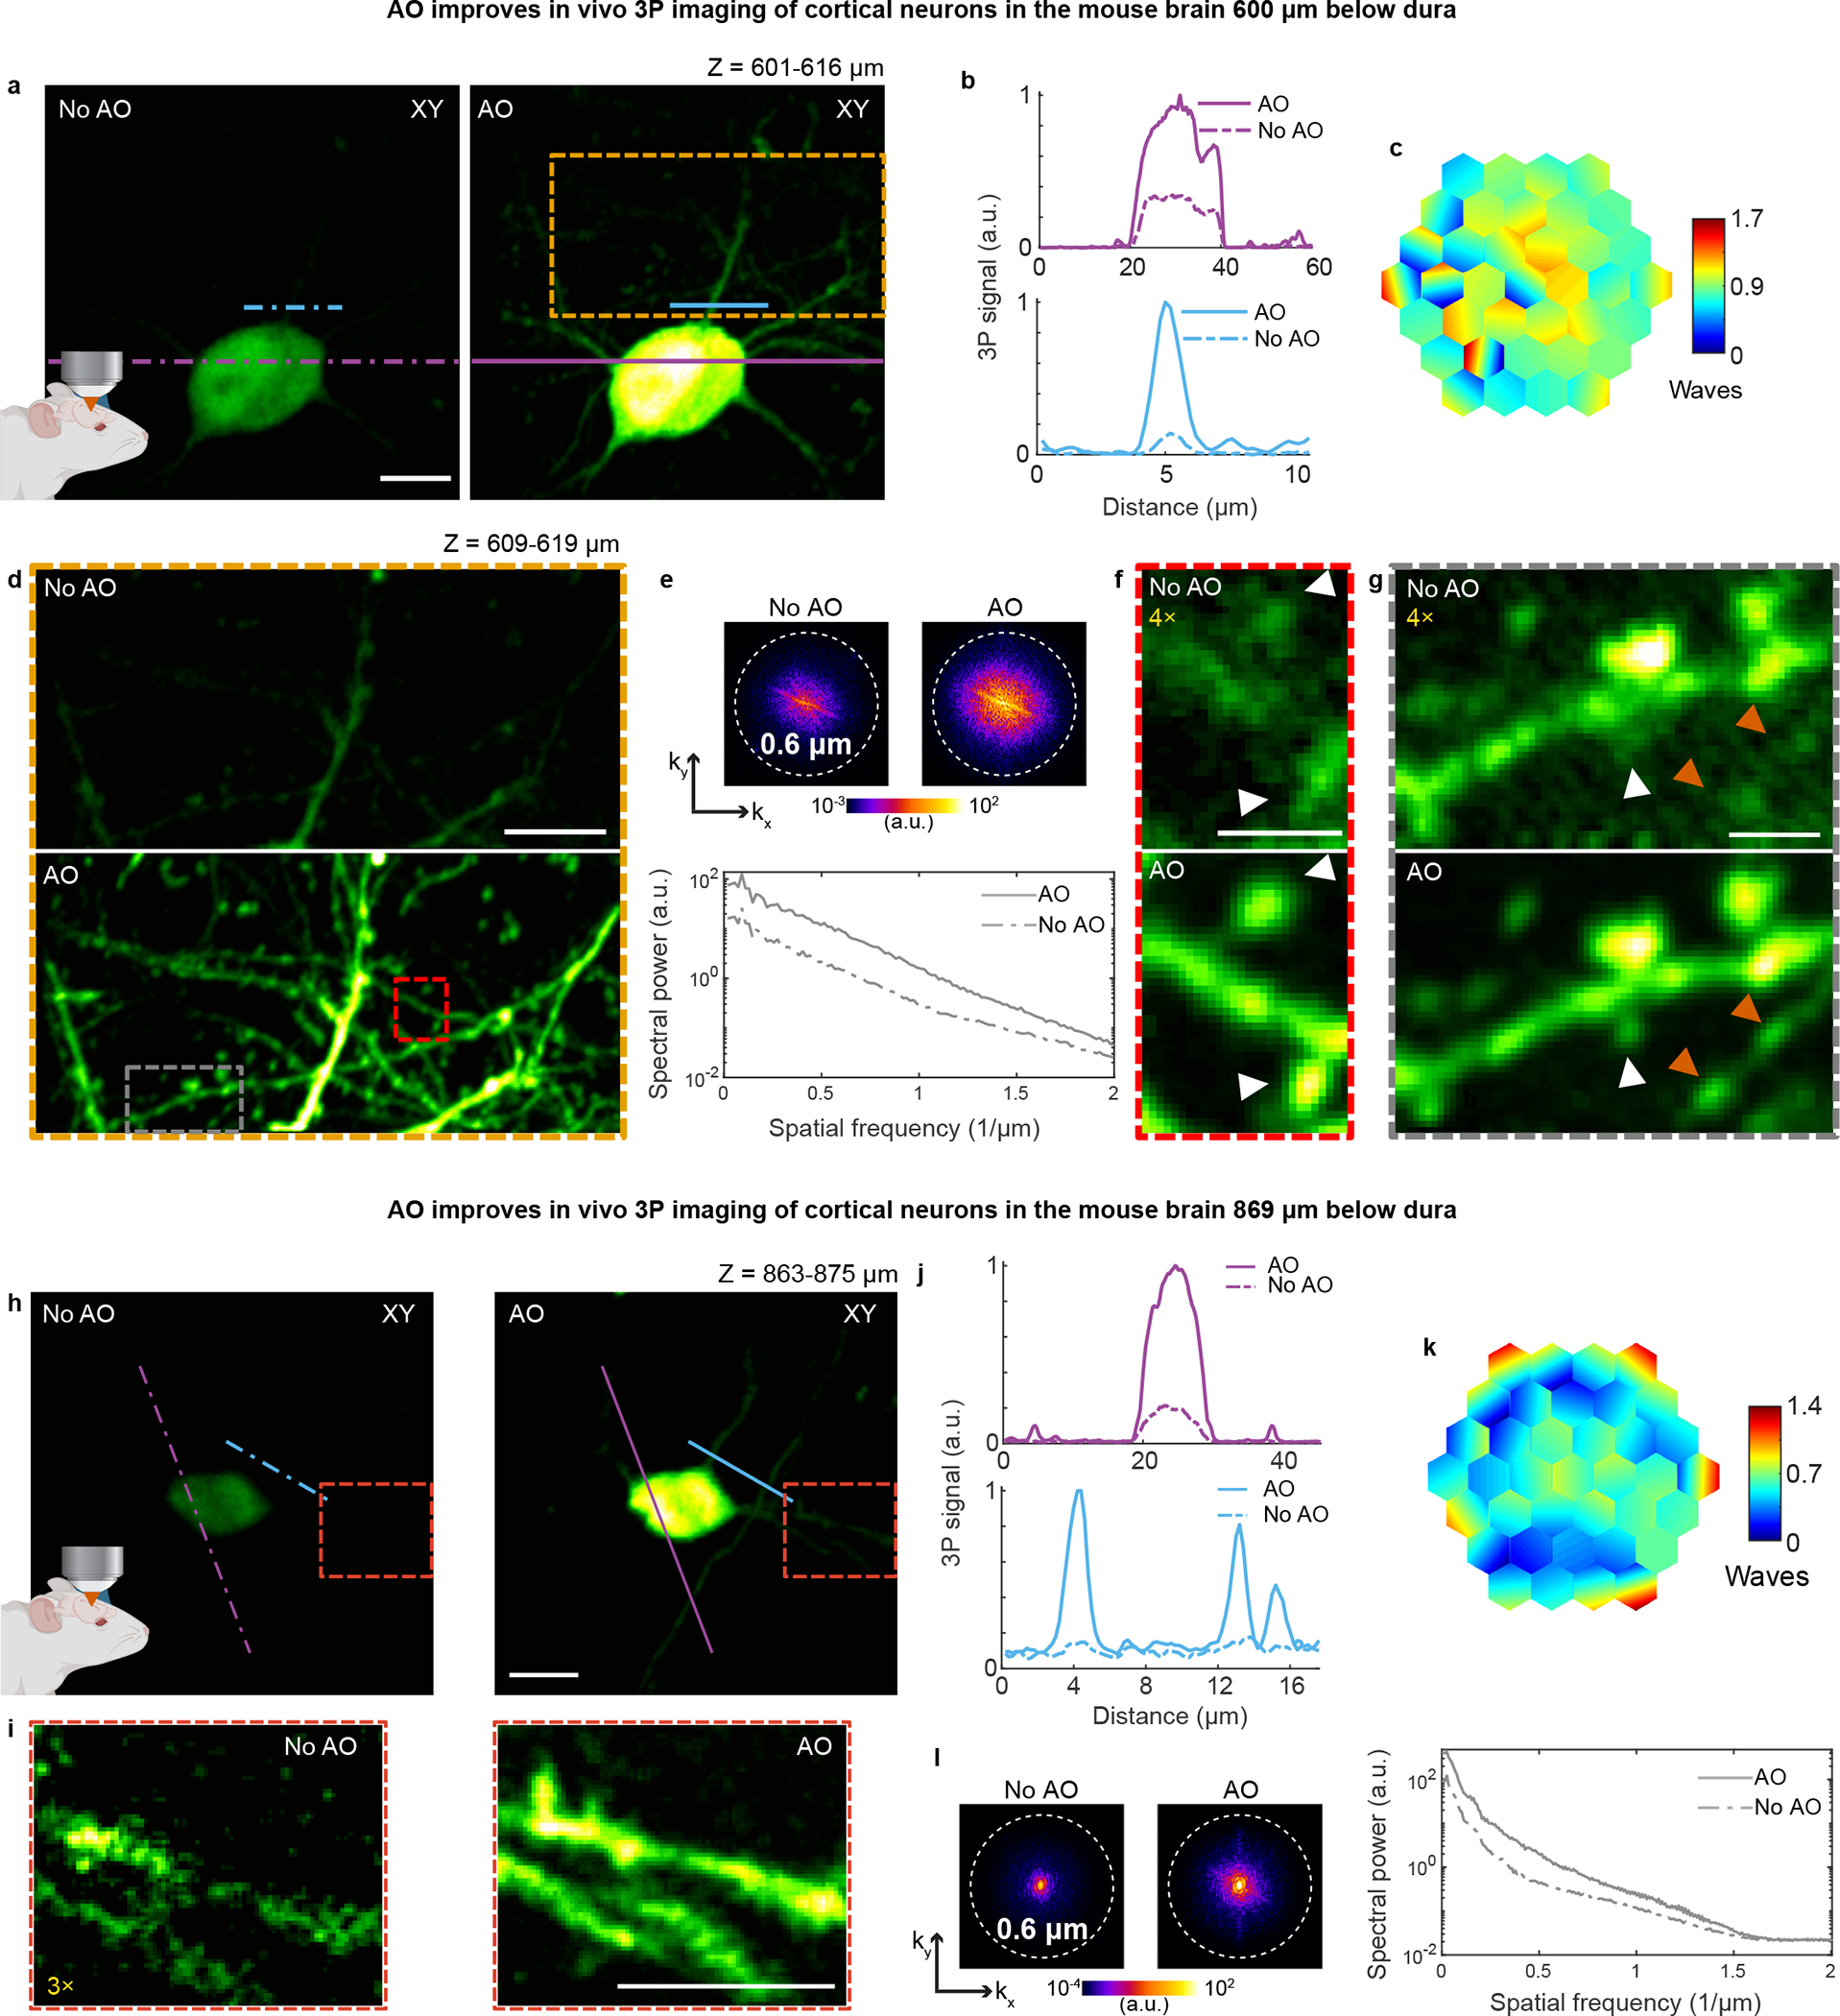
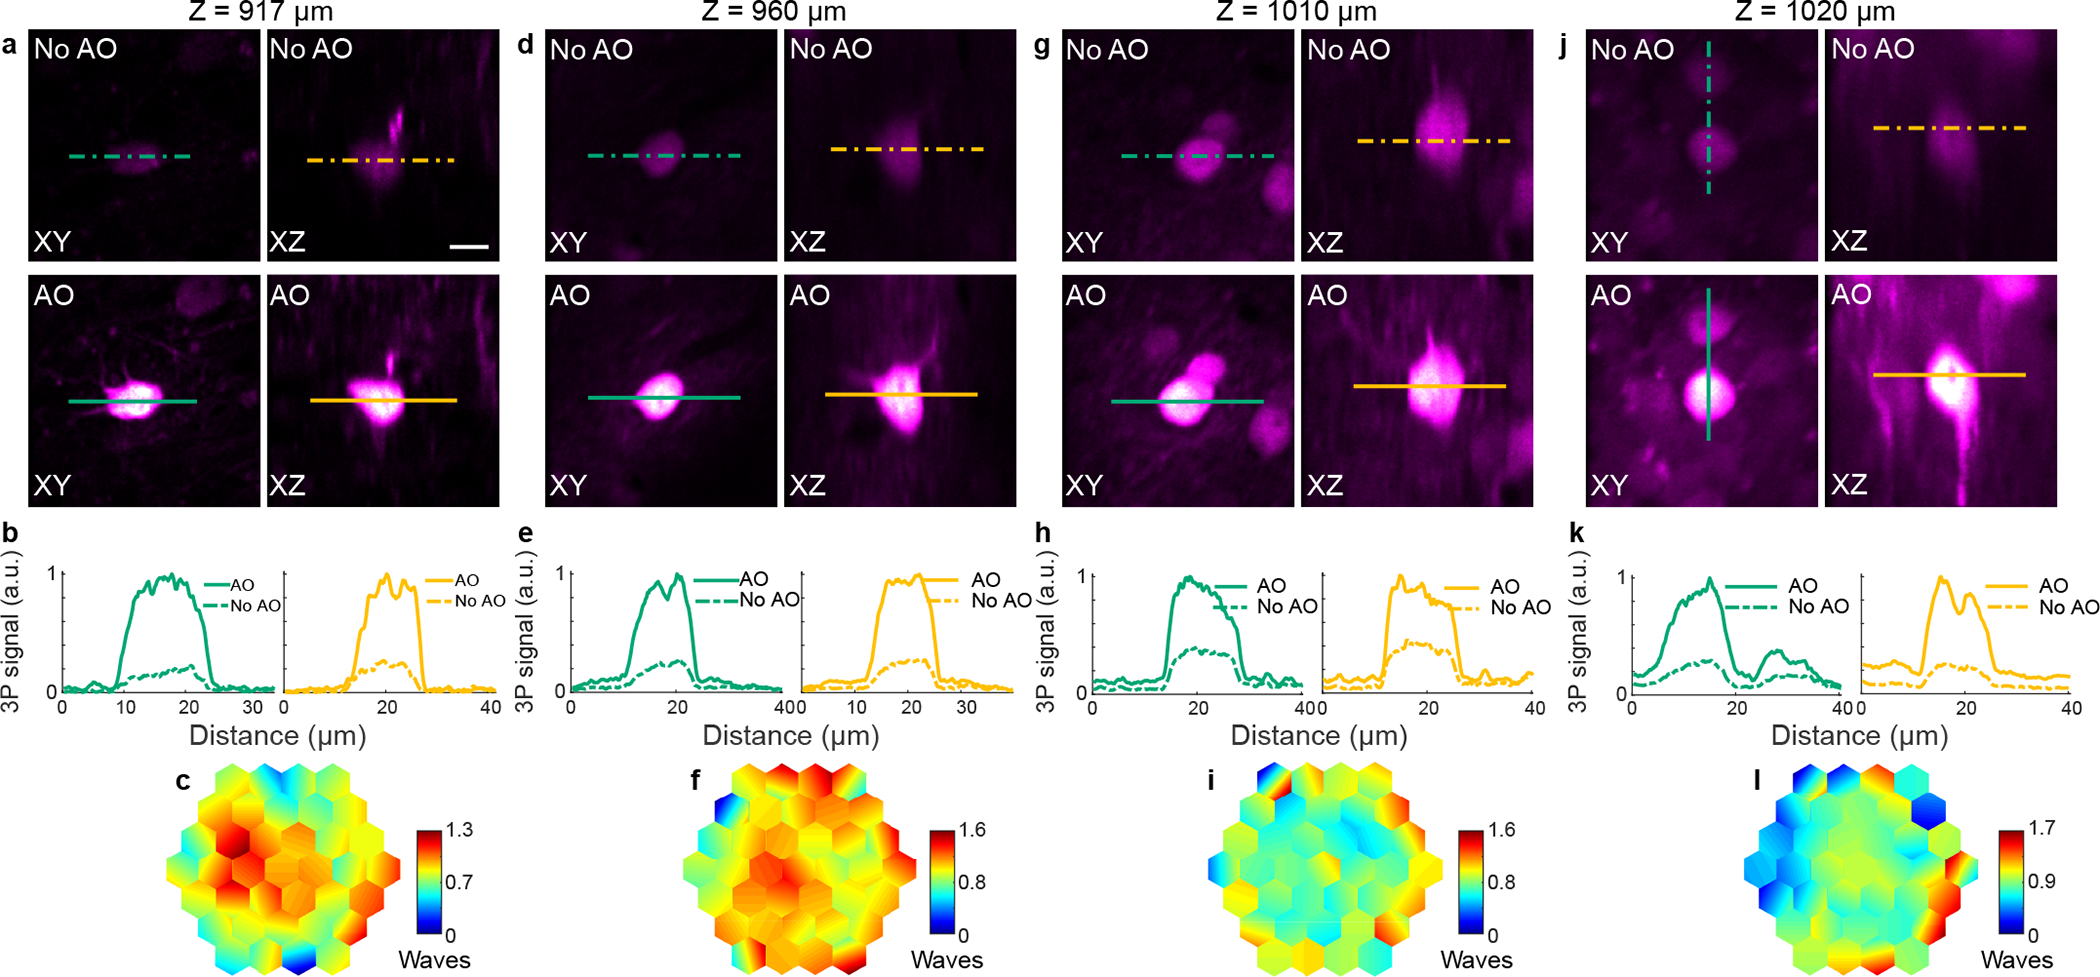
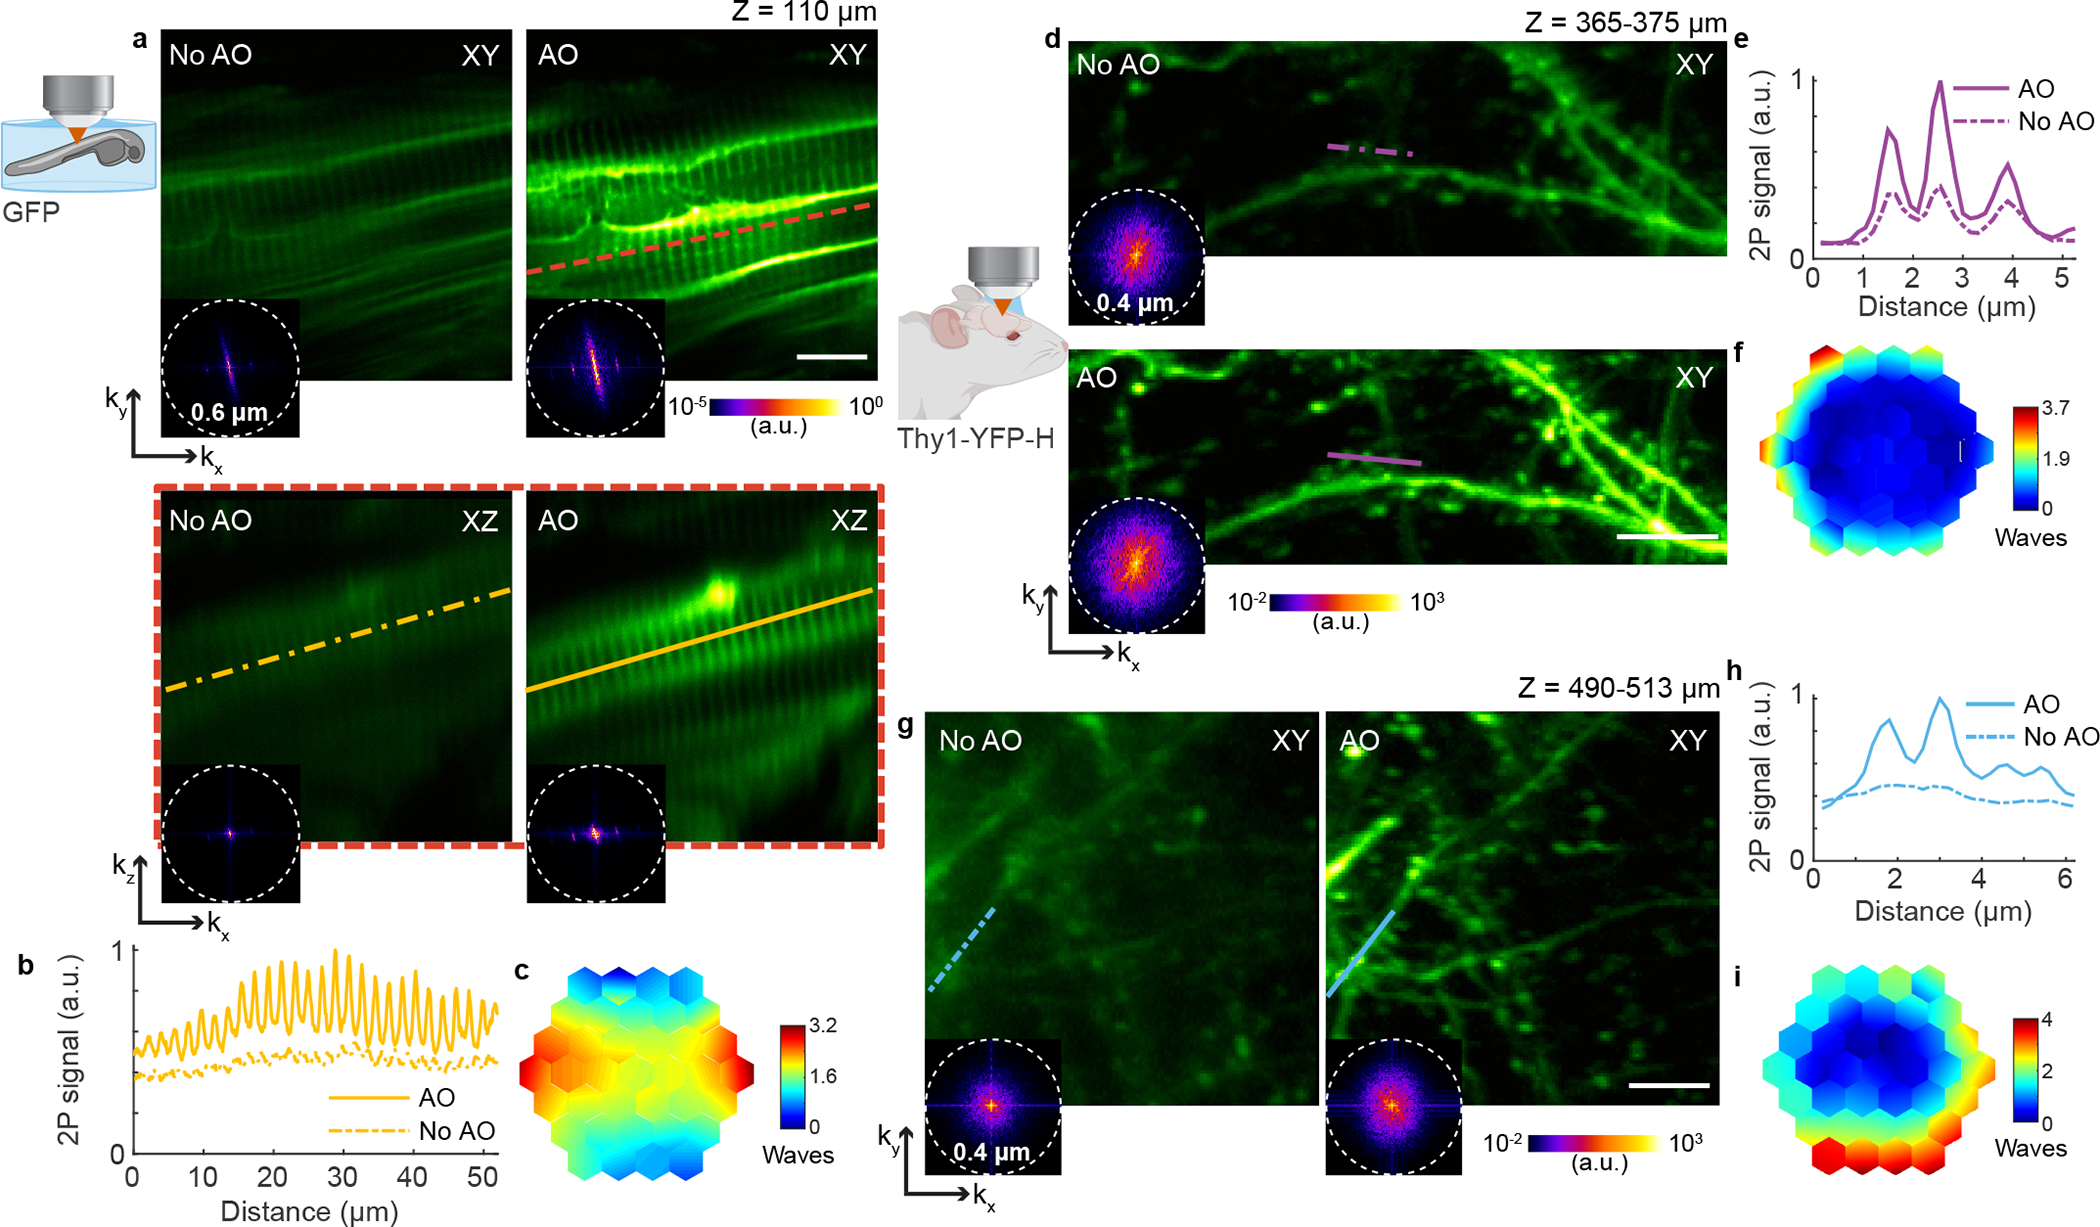
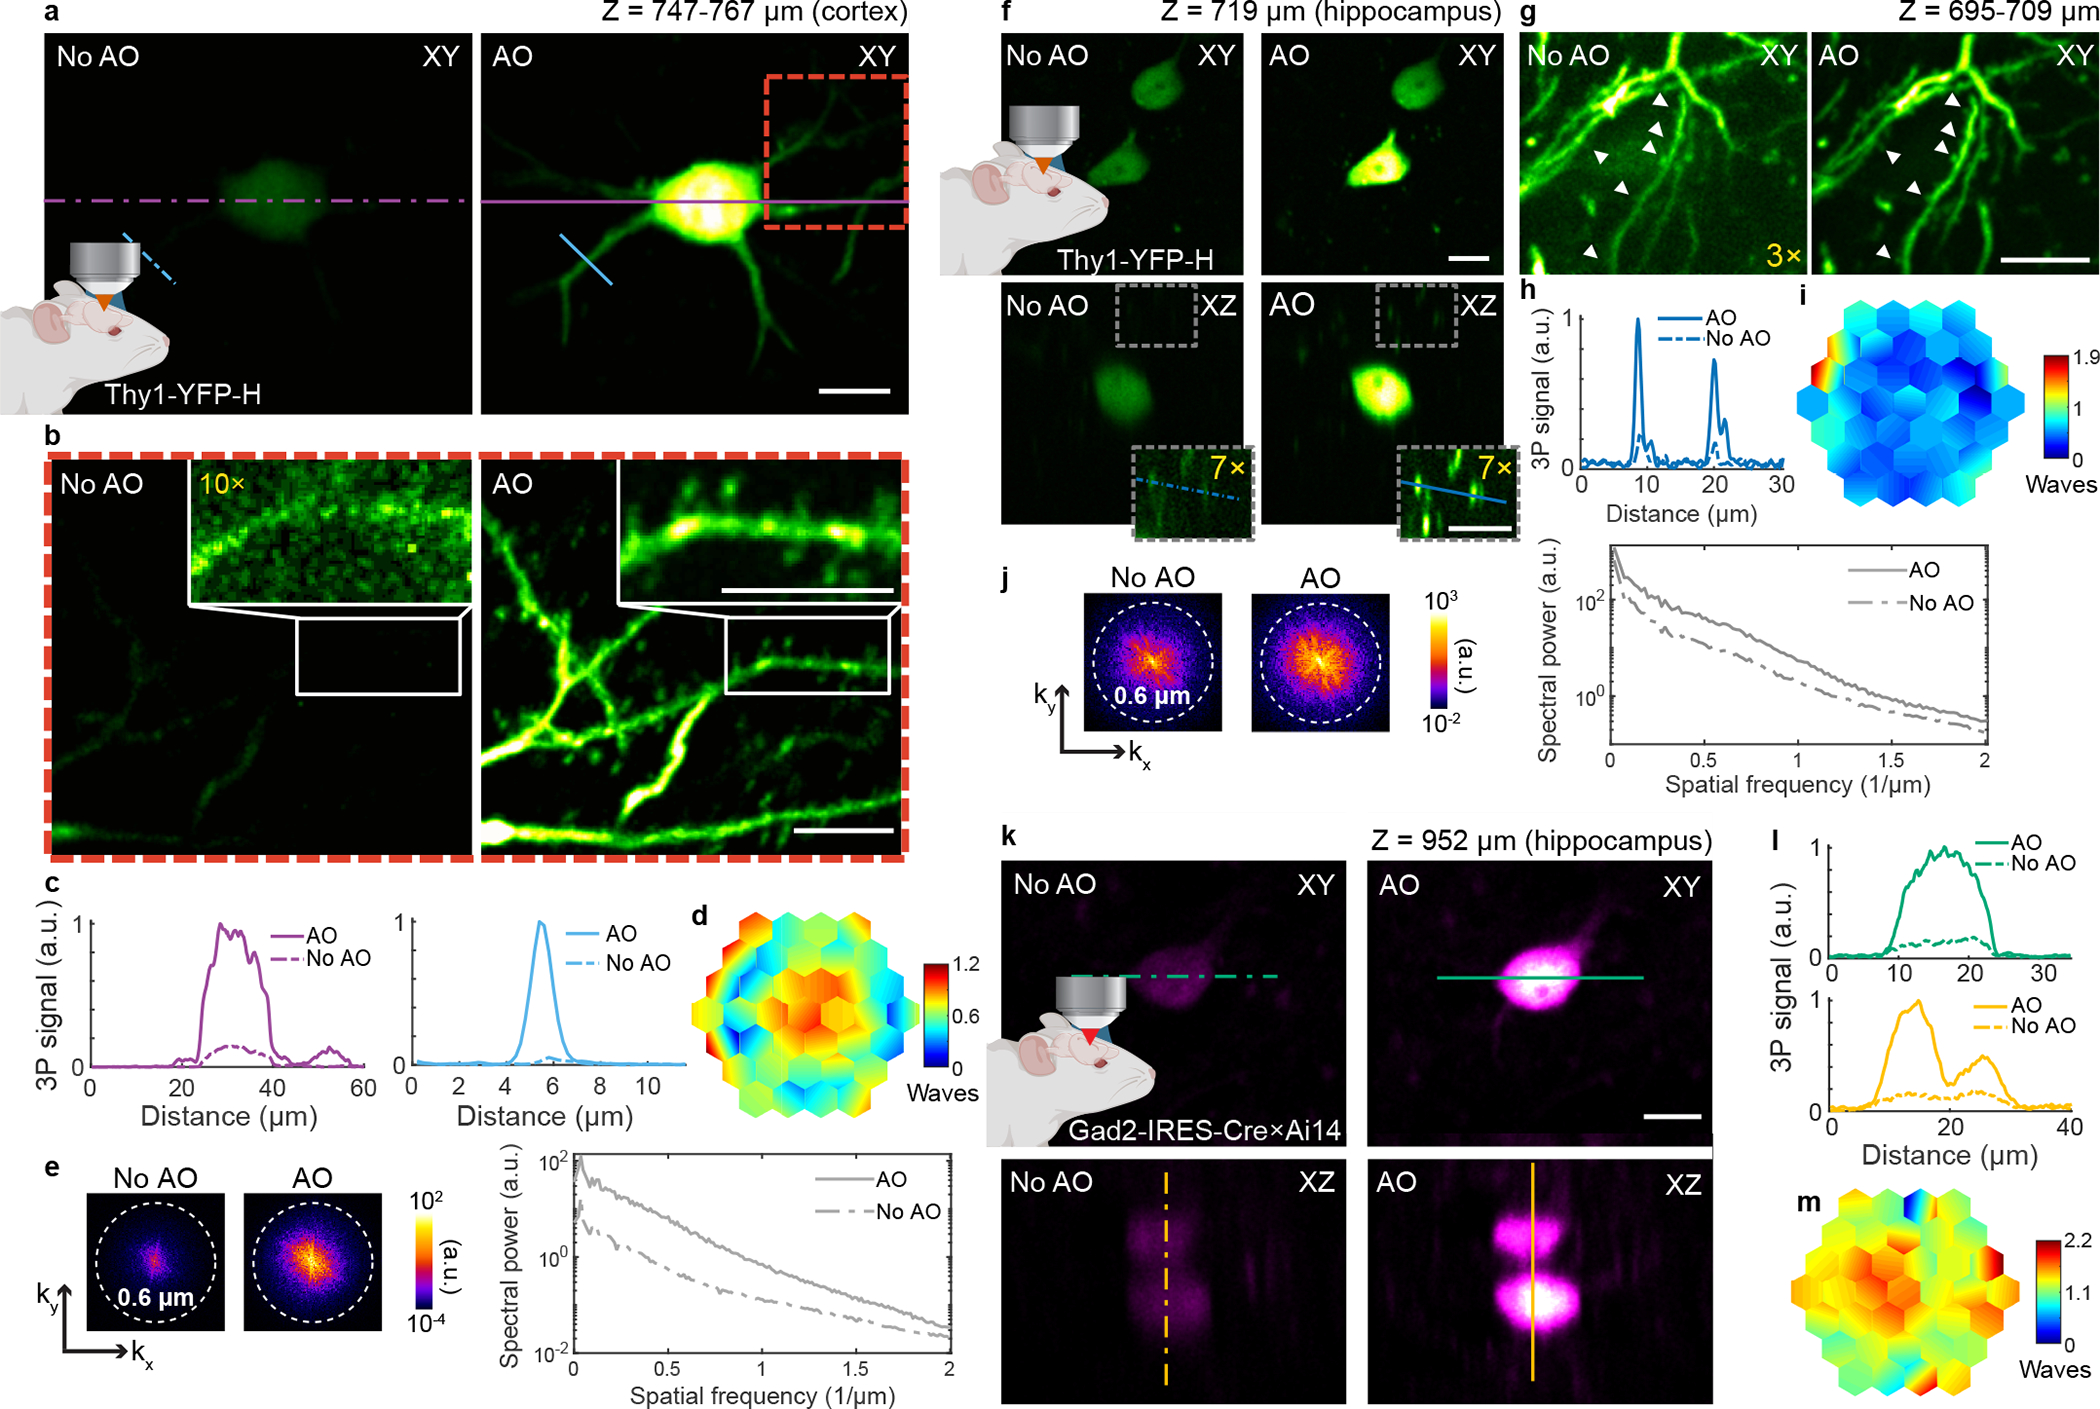
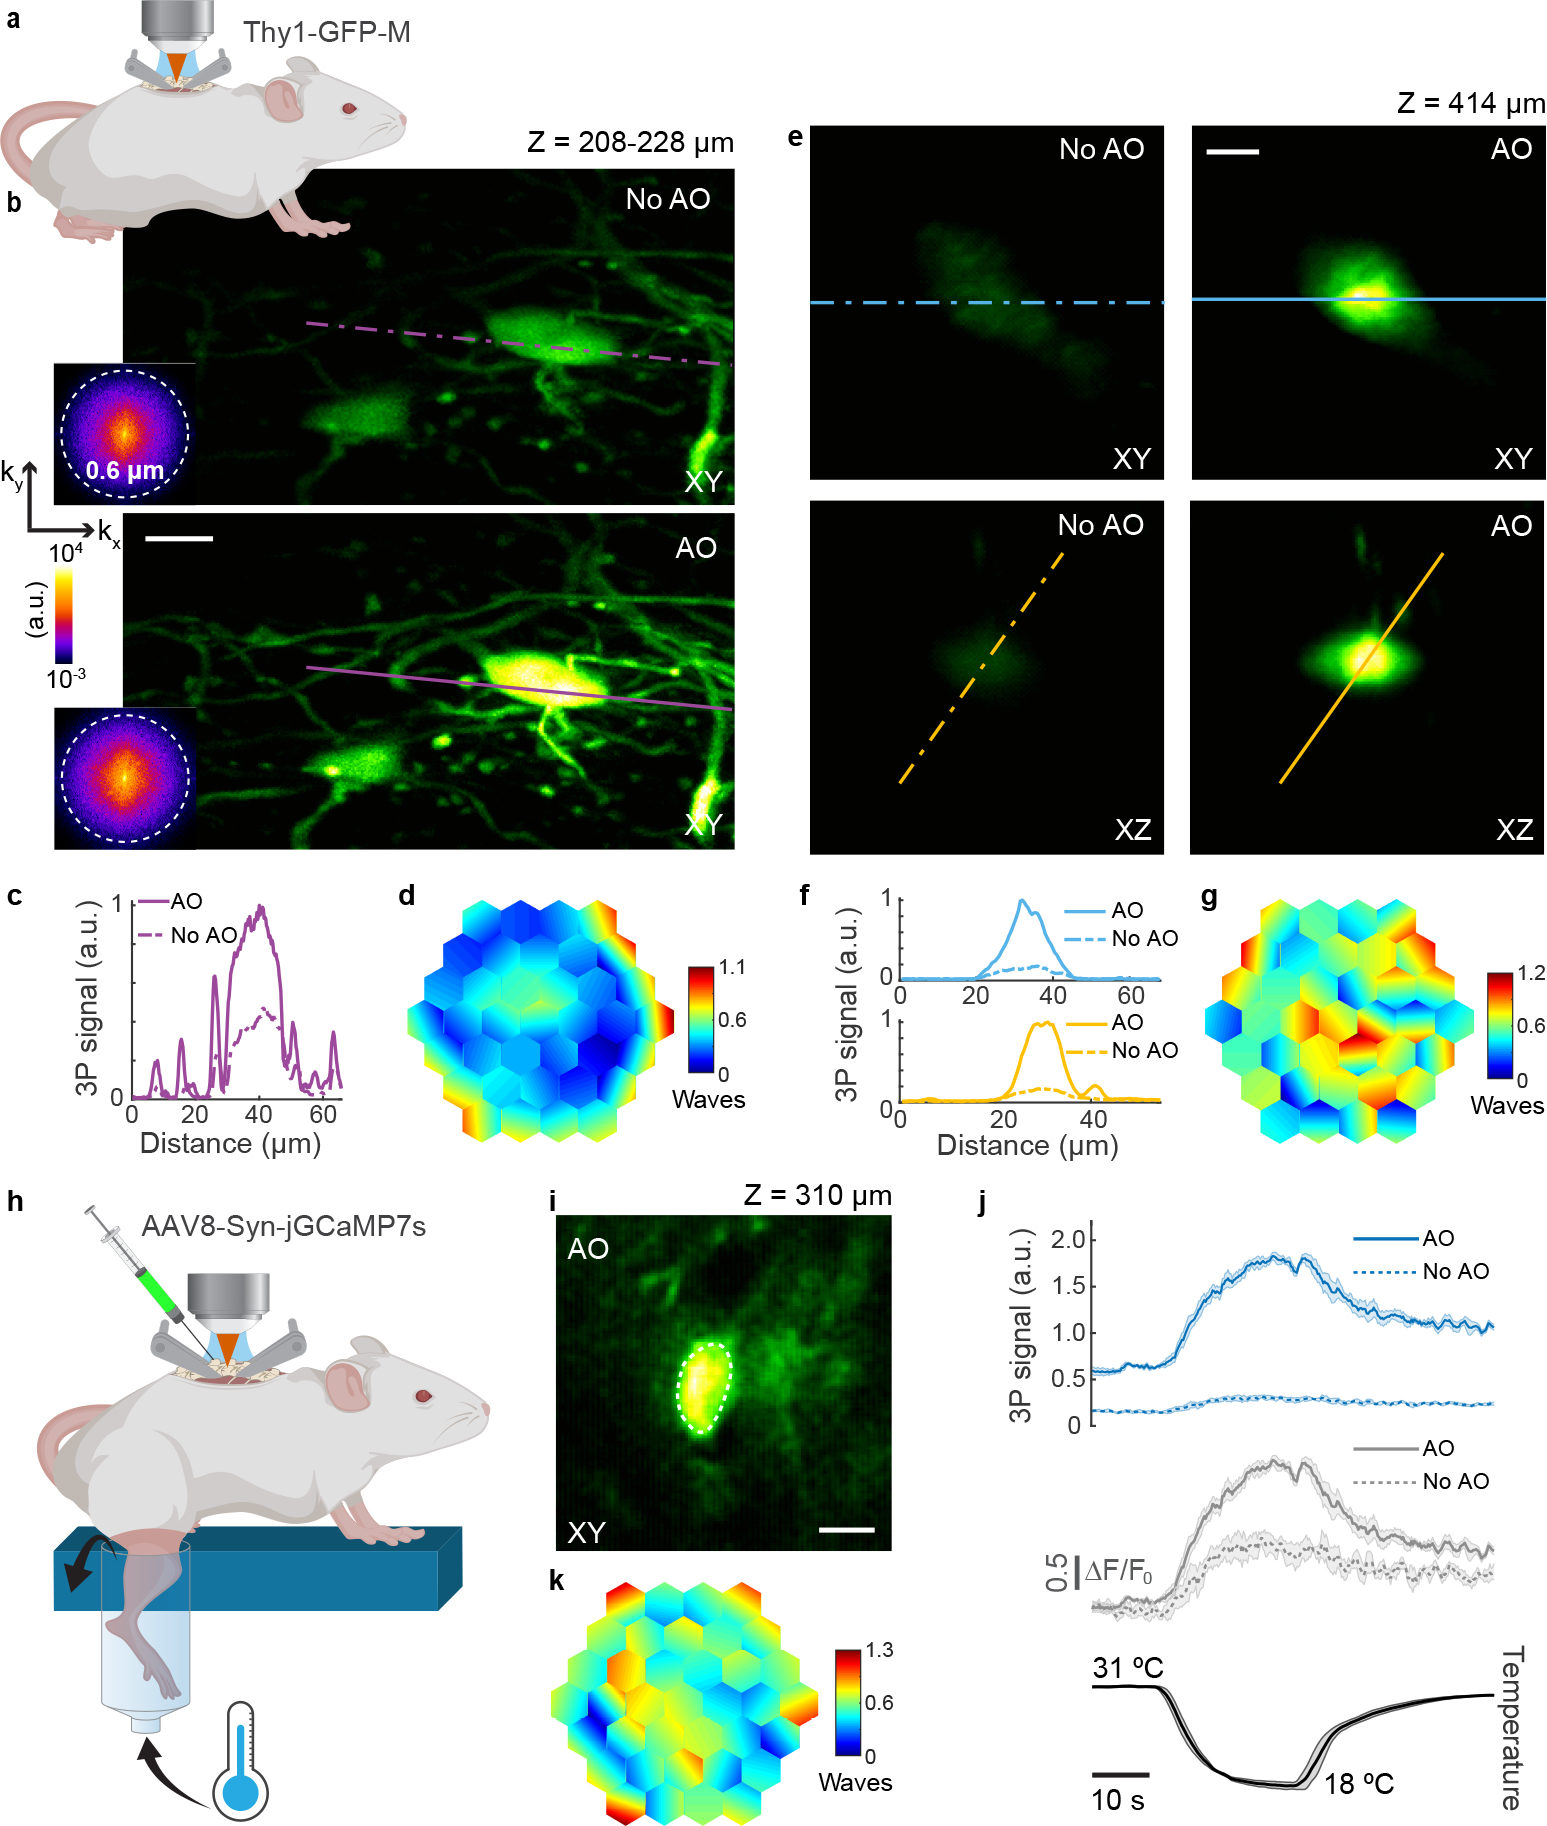
Understanding complex biological systems requires visualizing structures and processes deep within living organisms. We developed a compact adaptive optics module and incorporated it into two- and three-photon fluorescence microscopes, to measure and correct tissue-induced aberrations. We resolved synaptic structures in deep cortical and subcortical areas of the mouse brain, and demonstrated high-resolution imaging of neuronal structures and somatosensory-evoked calcium responses in the mouse spinal cord at great depths in vivo.


Conflict of interest statement

Competing interests

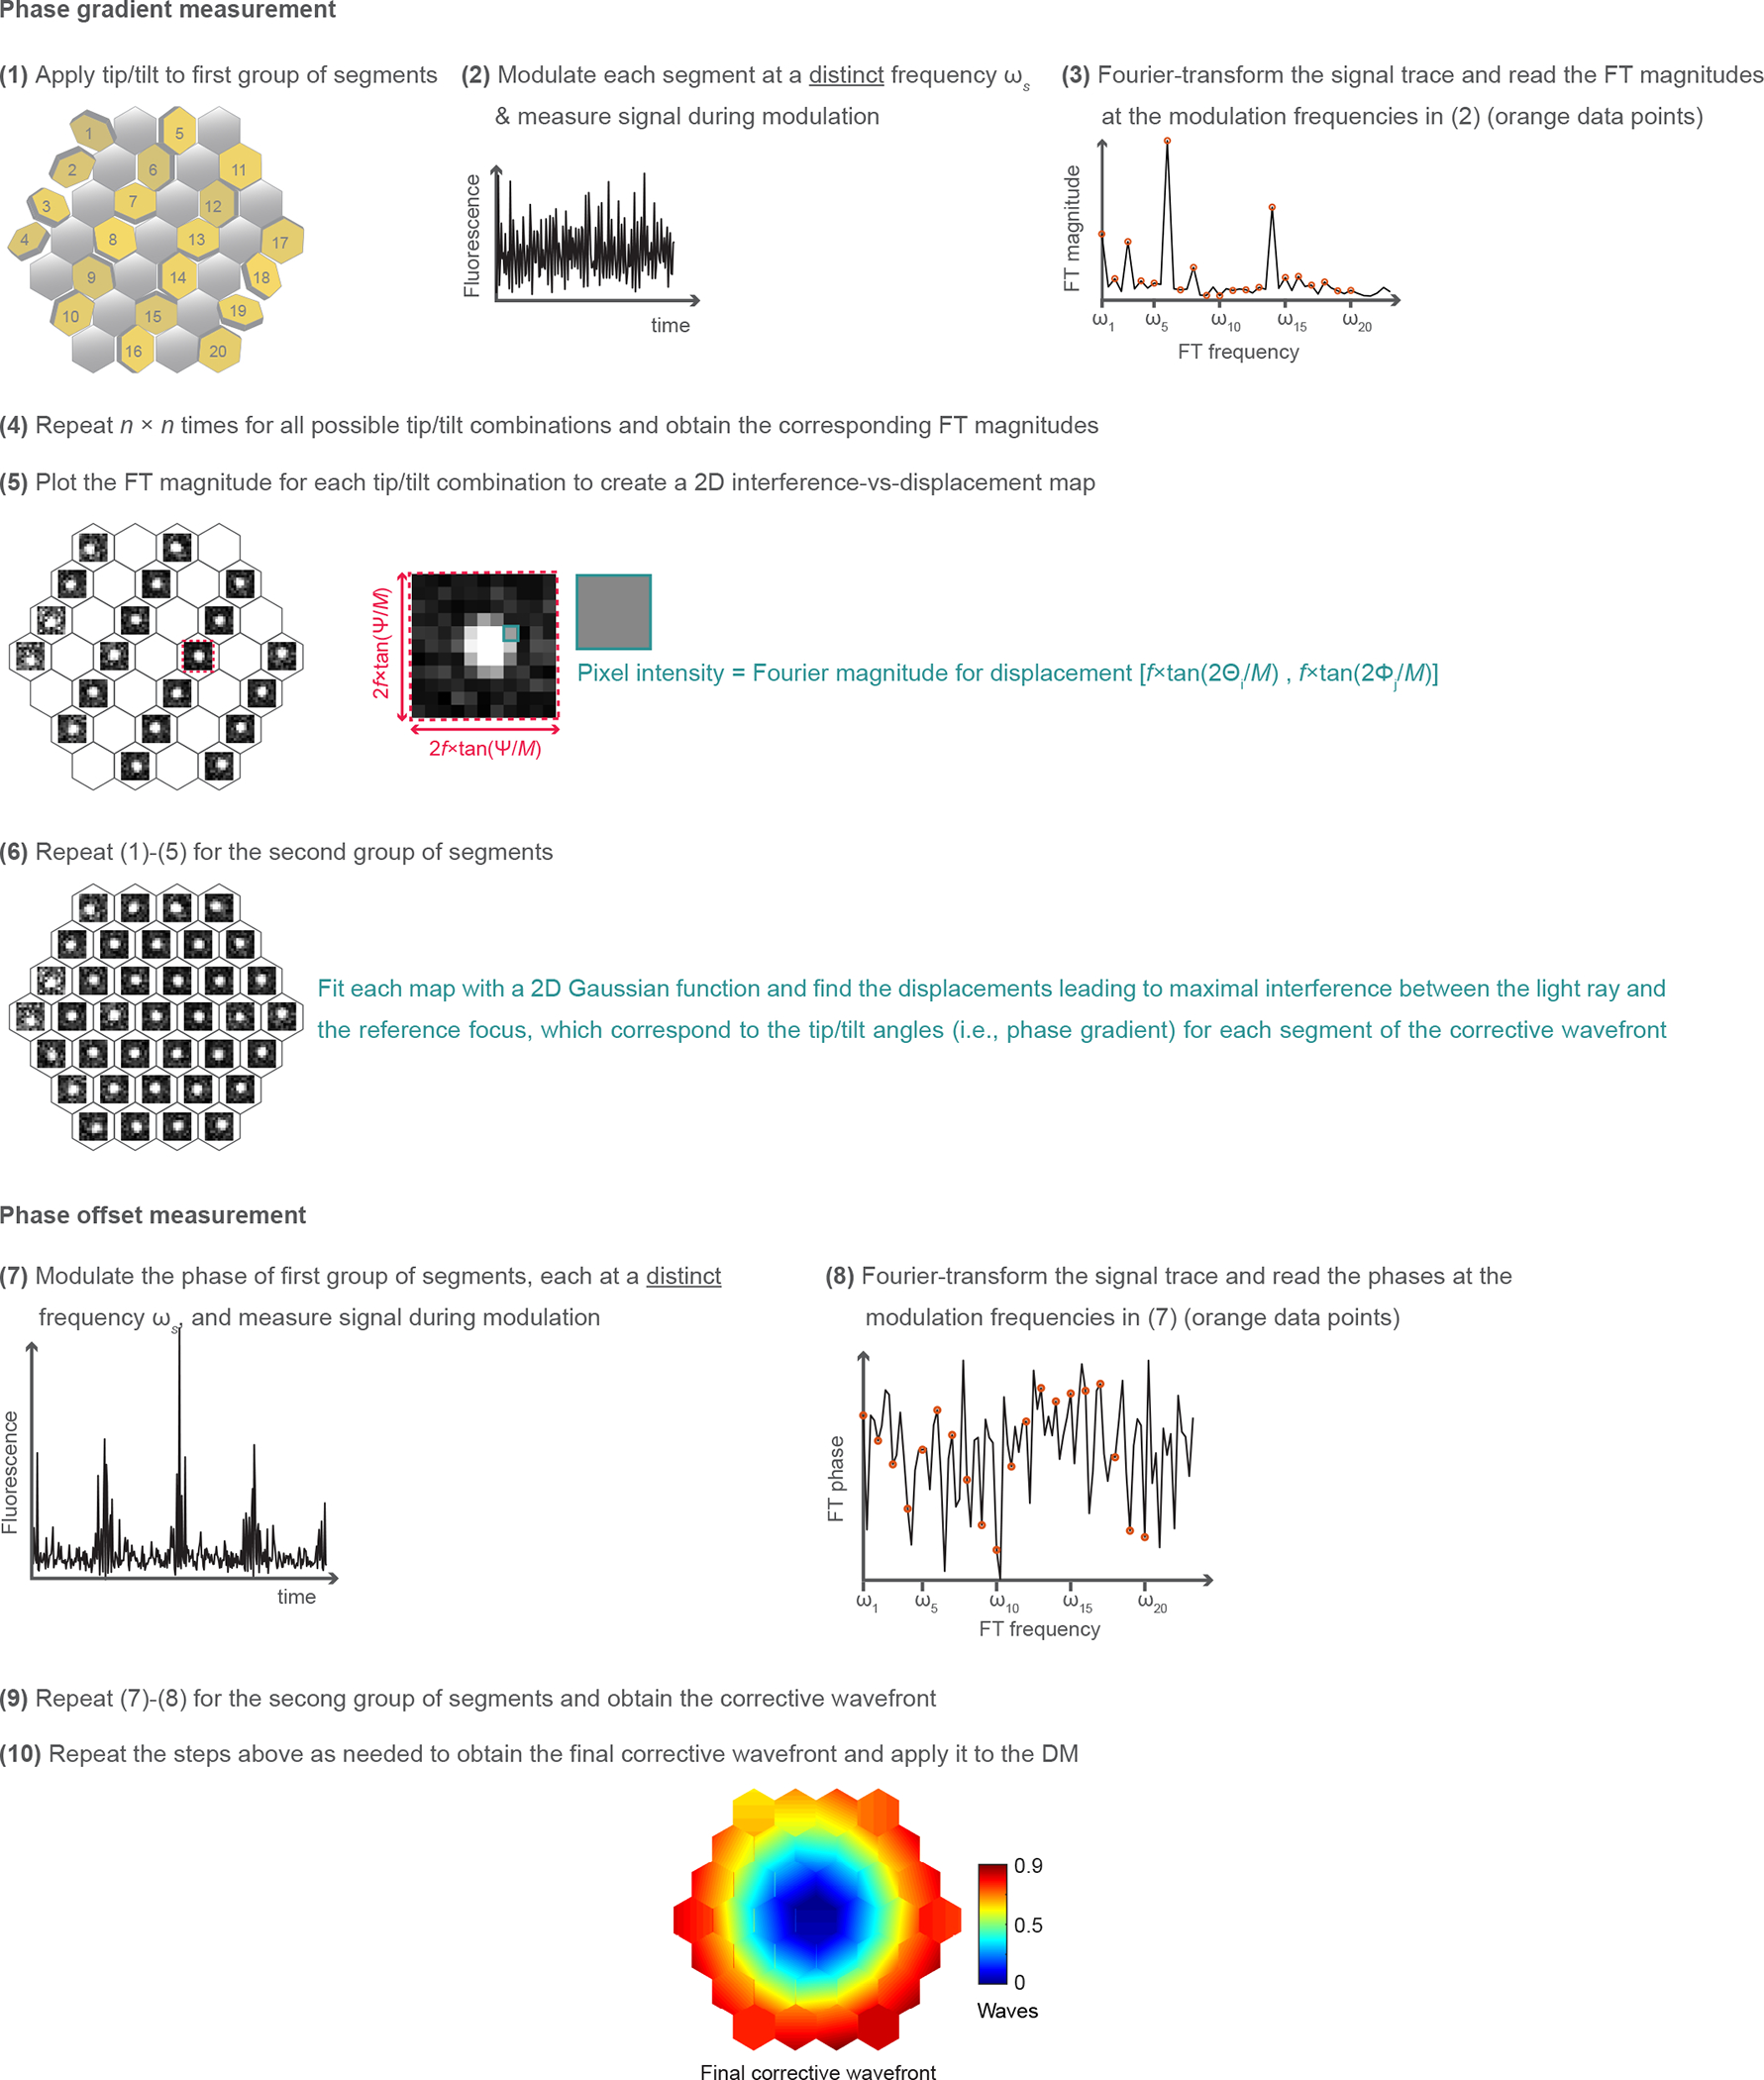
N.J. and Howard Hughes Medical Institute have filed patent applications that relate to the principle of frequency-multiplexed aberration measurement. T.G.B. has a financial interest in Boston Micromachines Corporation (BMC), which produced commercially the deformable mirror used in this work. The remaining authors declare no competing interests.

Figures

Extended Data Fig. 1 |
Extended Data Fig. 1 |. Schematics of the aberration measurement method.
(1) We fix the tip, tilt, and piston of one group of 17 segments, and add to the remaining 20 pupil segments a specific tip angle Θi and tilt angle Φj (i, j = 1,2,…n) chosen randomly from an array of n angles spaced between −Ψ/2 and Ψ/2. (2) We modulate the phase or intensity of all 20 beamlets, at a distinct frequency ωs (s = 1,2,…20), and record the fluorescence signal. (3) We Fourier transform (FT) the recorded signal trace and measure the Fourier magnitudes at each ωs. (4) This procedure is repeated n × n times for all tip and tilt angles. (5) For each beamlet, we plot the Fourier magnitudes versus the displacements (Xi, Yj) and construct a 2D map of interference strength of this beamlet with the reference focus at different focal displacements. Here, Xi = f*tan(2Θi/M) and Yj = f*tan(2Φj/M); f: focal length of the objective; M: magnification from the DM to objective back focal plane. (6) We repeat steps (1)-(5), with the group of 20 pupil segments fixed, while modulating the remaining 17 segments. We fit each map with a 2D Gaussian function and find the displacements leading to maximal interference between the light ray and the reference focus, corresponding to the tip and tilt angles for each segment of the corrective wavefront. (7) We modulate the phases of the first 20 rays by piston-displacing each corresponding mirror segment at a distinct frequency ωs while keeping the phases of the remaining rays constant. The resulting fluorescence trace is recorded. (8) We FT the recorded fluorescence trace and read out the phase offsets that would lead to constructive interference with the reference focus at the modulation frequencies ωs. (9) We modulate the phases of the remaining 17 segments while keeping the phases of the first 20 segments unchanged and obtain the corrective wavefront. (10) We repeat the steps above as needed to obtain the final corrective wavefront and apply it to the DM. See detailed description in Methods.
Extended Data Fig. 2 |
Extended Data Fig. 2 |. Schematics of AO 2P and 3P fluorescence microscopes, and example system correction.
a,b, Components of AO 2P and 3P fluorescence microscopes, respectively. DM, deformable mirror; SLM, spatial light modulator (used to introduce artificial aberration); L, lenses; X and Y, galvanometers; PMT, photomultiplier tube. c, Lateral and axial 3P images of a 1-μm-diameter red fluorescent bead, under 1300 nm excitation, taken without and with AO. Post-objective power: 0.13 mW. d, Signal profiles along the purple and yellow lines in c. e, Corrective wavefront applied to the DM. Scale bar, 1 μm. Microscope objective: NA 1.05 25×. Data representative of n>20 bead images taken during n>20 imaging sessions.
Extended Data Fig. 3 |
Extended Data Fig. 3 |. Correcting artificial aberrations for 2P microscopy using phase versus intensity modulation and signal from fluorescent features of different sizes.
a,b, Artificial aberration introduced with the SLM and corrective wavefront on the DM, respectively. c,d, Axial images of 0.5-μm- and 10-μm-diameter fluorescent beads, respectively, without AO, with AO (phase modulation), and under ideal aberration-free conditions (without artificial aberrations applied to the SLM). Digital gains were applied to No AO images to increase visibility. Post-objective power: 6 and 2.3 mW, respectively. e,f, 2P signal versus iteration number for 0.5-μm- and 10-μm-diameter beads, respectively, using phase and intensity modulation. Scale bars: 1 μm in c and 5 μm in d. Microscope objective used: NA 0.8 16×. n = 1 bead in c and d, respectively.
Extended Data Fig. 4 |
Extended Data Fig. 4 |. AO recovers spatial frequency components in 2P images of neuronal structures in the living mouse brain.
a-d, Imaging of dendrites in the cerebral cortex of Thy1-YFP-H mice. a,c, Maximum intensity projections of dendrites at 365–375 μm and 490–513 μm below dura, respectively, under 920 nm excitation, without and with AO (same images as in Fig. 1). b,d, Spatial frequency space representations of the 2P images in a and c, respectively (left), and their radially averaged profiles (right). Scale bars, 5 μm. Microscope objective: NA 1.05 25×. Representative results from 13 fields of view and 3 mice.
Extended Data Fig. 5 |
Extended Data Fig. 5 |. AO improves 3P imaging of beads in a capillary tube.
a, Schematics of sample geometry of 1-μm-diameter fluorescent beads in an air-filled capillary tube. b, Lateral and axial (along red dotted line) images of beads without and with AO (phase modulation). Post-objective power: 0.13 mW. Digital gains were applied to No AO images to increase visibility. c,d, 3P signal improvement (AO/No AO) and axial full width at half maximum (FWHM) of a representative bead (white arrowhead in b) as a function of the iteration #, respectively. e, Corrective wavefront, unwrapped (modulo-2π) for visualization purposes. Scale bar, 5 μm. Microscope objective: NA 1.05 25×. Representative results from 2 imaging sessions.
Extended Data Fig. 6 |
Extended Data Fig. 6 |. AO improves in vivo 3P imaging of cortical neurons in the mouse brain.
a, Lateral and axial images of a neuronal cell body (Thy1-YFP-H), at 757 μm below dura, under 1300 nm excitation, without and with AO (same cell body as in Fig. 2a). Post-objective power: 17 mW. b, Signal profiles along the purple and yellow lines in a. c, Maximum intensity projection (MIP) of same neuron as in a, 747–767 μm below dura, under 1300 nm excitation, without and with AO. Post-objective power: 17 mW. d, MIP of the yellow square in c, at 747–757 μm below dura, without and with AO. Insets in d, zoomed-in views of dendrite in white box. 10× digital gain was applied to the inset without AO to improve visibility. Post-objective power: 20 mW. e, Lateral and axial images of a neuron in the mouse cortex (Thy1-GFP-M), at 687 μm below dura, under 1300 nm excitation, taken without and with AO. Post-objective power: 35 mW. f, Signal profiles along the purple and yellow lines in e. g, Corrective wavefront in e. h, MIP of a neuron in the mouse cortex (Thy1-GFP-M, different animal than in e), at 624–644 μm below dura, under 1300 nm excitation, without and with AO. Post-objective power: 13 mW. i, Signal profiles along the purple and blue lines in h. j, Corrective wavefront in h. Insets in a and e: spatial frequency space representation of the corresponding fluorescence images. Scale bars, 10 μm. Microscope objective: NA 1.05 25×. Representative results from 32 fields of view and 8 mice.
Extended Data Fig. 7 |
Extended Data Fig. 7 |. Effect of iterations on 3P fluorescence signal improvement for phase and intensity modulation-based aberration correction in the mouse brain in vivo.
a-f, 3P images of a neuron in the mouse cortex (Thy1-YFP-H), 623 μm below dura, under 1300 nm excitation, without AO correction and after running aberration measurement a total of N = 1–5 iterations. a,d Lateral and axial images of the neuron using phase and intensity modulation, respectively. Post-objective power: 20.8 (a) and 23.6 mW (d). b, e, 3P signal improvement (AO/No AO) with iterations, for phase and intensity modulation, respectively. The plotted signal is the average pixel intensity within a 16×16-pixel area around the image maximum. c,f, Corrective wavefronts measured with phase and amplitude modulation, respectively. Scale bars, 10 μm. Microscope objective: NA 1.05 25×. Representative results from 3 fields of view and 2 mice.
Extended Data Fig. 8 |
Extended Data Fig. 8 |. AO enables in vivo 3P imaging of dendritic spines and axonal boutons in deep layers of the mouse cortex.
a, Maximum intensity projection (MIP) of a neuron in the mouse cortex (Thy1-YFP-H), at 601–616 μm below dura, under 1300 nm excitation, without and with AO. Post-objective power: 17 mW. b, Signal profiles along the purple and blue lines in a. c, Corrective wavefront in a. d, MIP of the orange box in a, at 609–619 μm below dura, without and with AO. Post-objective power: 25.6 mW. e, Spatial frequency space representations of the images in d (top) and their radially averaged profiles (bottom). f,g, Zoomed-in views of the red and gray boxes in d, respectively. 4× digital gain was applied to images without AO to improve visibility. White arrowheads: dendritic spines; orange arrowheads: axonal boutons. h, MIP of a neuron in the mouse cortex (Thy1-YFP-H), at 863–875 μm below dura, under 1300 nm excitation, taken without and with AO. Post-objective power: 42 mW. i, Zoomed-in views of the red box in h. 3× digital gain was applied to the image taken without AO to improve visibility. j, Signal profiles along the purple and blue lines in h. k, Corrective wavefront in h. l, Spatial frequency space representation of the images in h (left) and their radially averaged profiles (right). Scale bars: 10 μm in a, d, h, and i; 2 μm in f and g. Microscope objective: NA 1.05 25×. Representative results from 20 fields of view and 5 mice.
Extended Data Fig. 9 |
Extended Data Fig. 9 |. AO improves in vivo 3P imaging of hippocampal structures at different depths in the mouse brain, with 1700 nm excitation.
a-l, 3P images of neurons in the mouse hippocampus at different depths. a,d,g,j, Lateral and axial images of neurons without and with AO, at 917, 960, 1010, and 1020 μm below dura, respectively. Post-objective powers: 26.5 (a), 10 (d), 27 (g), and 24 mW (j). b,e,h,k, Signal profiles along the green and yellow lines in a, d, g, and j, respectively. c,f,i,l, Corrective wavefront in a, d, g, and j, respectively. For a, a Gad2-IRES-Cre × Ai14 (Rosa26-CAG-LSL-tdTomato) mouse was used; for d, g, and j, neurons in wildtype mice were infected by a mix of AAV-Syn-Cre and AAV-CAG-FLEX-tdTomato. Scale bar, 10 μm. Microscope objective: NA 1.05 25×. Representative results from 9 fields of view and 2 mice.
Fig. 1 |
Fig. 1 |. AO improves in vivo 2P imaging of myotomes in zebrafish larva and neuronal structures in the mouse brain.
a, Lateral and axial (along red dashed line) images of myotomes in the mid-trunk of a 4-day-old zebrafish larva Tg(β-actin:HRAS-EGFP), at an imaging depth of 110 μm from the surface, without and with AO (phase modulation). Post-objective power: 13 mW. b, Signal profiles in the axial plane along the yellow lines in a. c, Corrective wavefront in a. d-i, Imaging of dendrites in the cerebral cortex of Thy1-YFP-H mice. d,g, Maximum intensity projections of dendrites at 365–375 μm and 490–513 μm below dura, respectively, under 920 nm excitation, without and with AO (phase modulation). Post-objective power: 31 (d) and 128 mW (g). e,h, Signal profiles along the purple and blue lines in d and g, respectively. f,i, Corrective wavefronts in d and g, respectively. Insets in a, d, and g: spatial frequency space representations of the corresponding fluorescence images; dashed circles: diffraction-limited resolution. Scale bars, 10 μm in a and 5 μm in d and g. Microscope objective: NA 0.8 16× for a and NA 1.05 25× for d and g. Zebrafish imaging: representative results from 3 fields of view and 2 zebrafish larvae; mouse brain imaging: representative results from 13 fields of view and 3 mice.
Fig. 2 |
Fig. 2 |. AO enables in vivo 3P imaging of cortical and hippocampal neuronal structures in the mouse brain, with subcellular resolution.
a, Maximum intensity projection (MIP) of a neuron in the mouse cortex (Thy1-YFP-H), at 747–767 μm below dura, under 1300 nm excitation, without and with AO (phase modulation). Post-objective power: 17 mW. b, Zoomed-in views of the red square in a, at 751–767 μm below dura, without and with AO. Insets, zoomed-in views of the dendrite in white rectangles in b. 10× digital gain was applied to No AO inset to increase visibility. Post-objective power: 20 mW. c, Signal profiles along the purple and blue lines in a. d, Corrective wavefront in a and b. e, Spatial frequency space representations of the images in b (left) and their radially averaged profiles (right). f, Lateral and axial images of neurons in the mouse hippocampus (Thy1-YFP-H), 719 μm below dura, under 1300 nm excitation, without and with AO (phase modulation). Post-objective power: 16 mW. Insets, zoomed-in views of the gray square in e. 7× digital gain was applied to increase visibility. g, MIP of neuronal processes above the cell body in e, at 695–709 μm below dura, without and with AO. White arrows: dendritic spines. Post-objective power: 26 mW. 3× digital gain was applied to image without AO to improve visibility. h, Signal profiles along the blue lines in e. i, Corrective wavefront in e and f. j, Spatial frequency space representations of the images in g (left) and their radially averaged profiles (right). k, Lateral and axial images of neurons in the mouse hippocampus (Gad2-IRES-Cre × Ai14 (Rosa26-CAG-LSL-tdTomato)), 952 μm below dura, under 1700 nm excitation, without and with AO (phase modulation). Post-objective power: 30 mW. l, Signal profiles along the green and yellow lines in i. m, Corrective wavefront in k. Scale bars, 10 μm. Microscope objective: NA 1.05 25×. Cortical imaging: representative results from 32 fields of view and 8 mice; hippocampal imaging: representative results from 15 fields of view and 4 mice.
Fig. 3 |
Fig. 3 |. AO improves in vivo 3P structural and functional imaging in the mouse spinal cord.
a, Schematic of in vivo imaging in the dorsal horn of the mouse spinal cord. b, Maximum intensity projection of spinal cord neurons (Thy1-GFP-M), 208–228 μm below dura, under 1300 nm excitation, without and with AO (phase modulation). Insets: spatial frequency space representations of the corresponding fluorescence images. Post-objective power: 18.3 mW. c, Signal profiles along the purple lines in b. d, Corrective wavefront in b. e, Lateral and axial images of a neuron (Thy1-GFP-M), 414 μm below dura, under 1300 nm excitation, without and with AO (phase modulation). Post-objective power: 89 mW. f, Signal profiles along the blue and yellow lines in e. g, Corrective wavefront in e. h, Schematic for recording calcium activity in jGCaMP7s-expressing neurons of the dorsal horn in the mouse spinal cord (AAV8-Syn-jGCaMP7s), in response to cooling stimuli applied to the skin of the hindlimb. i, Lateral image of a neuron, 310 μm below dura, under 1300 nm excitation, after AO correction. j, (top) 3P fluorescence signal and (middle) calcium transients (ΔF/F0), during (bottom) temperature stimulation, without and with AO (phase modulation), for the neuronal cell body shown in i. 4-trial average; shaded area: s.e.m. Post-objective power: 4.2 mW. k, Corrective wavefront in i. Scale bars, 10 μm. Microscope objective: NA 1.05 25×. Structural imaging: representative results from 7 fields of view and 3 mice; functional imaging: representative results from 3 fields of view, and 2 mice.

References

    1. Horton NG et al. In vivo three-photon microscopy of subcortical structures within an intact mouse brain. Nat. Photonics 7, 205–209 (2013). - PMC - PubMed
    1. Ouzounov DG et al. In vivo three-photon imaging of activity of GCaMP6-labeled neurons deep in intact mouse brain. Nat. Methods 14, 388–390 (2017). - PMC - PubMed
    1. Wang T & Xu C Three-photon neuronal imaging in deep mouse brain. Optica 7, 947–960 (2020).
    1. Kubby Joel A. Adaptive Optics for Biological Imaging. (CRC Press, 2013).
    1. Booth MJ Adaptive optical microscopy: The ongoing quest for a perfect image. Light Sci. Appl 3, 1–7 (2014).

Publication types

Substances