. 2021 Oct;18(10):1204-1212.
doi: 10.1038/s41592-021-01278-1. Epub 2021 Oct 4.

Joint single-cell measurements of nuclear proteins and RNA in vivo

Affiliations

Joint single-cell measurements of nuclear proteins and RNA in vivo

Hattie Chung et al. Nat Methods. 2021 Oct.

Abstract

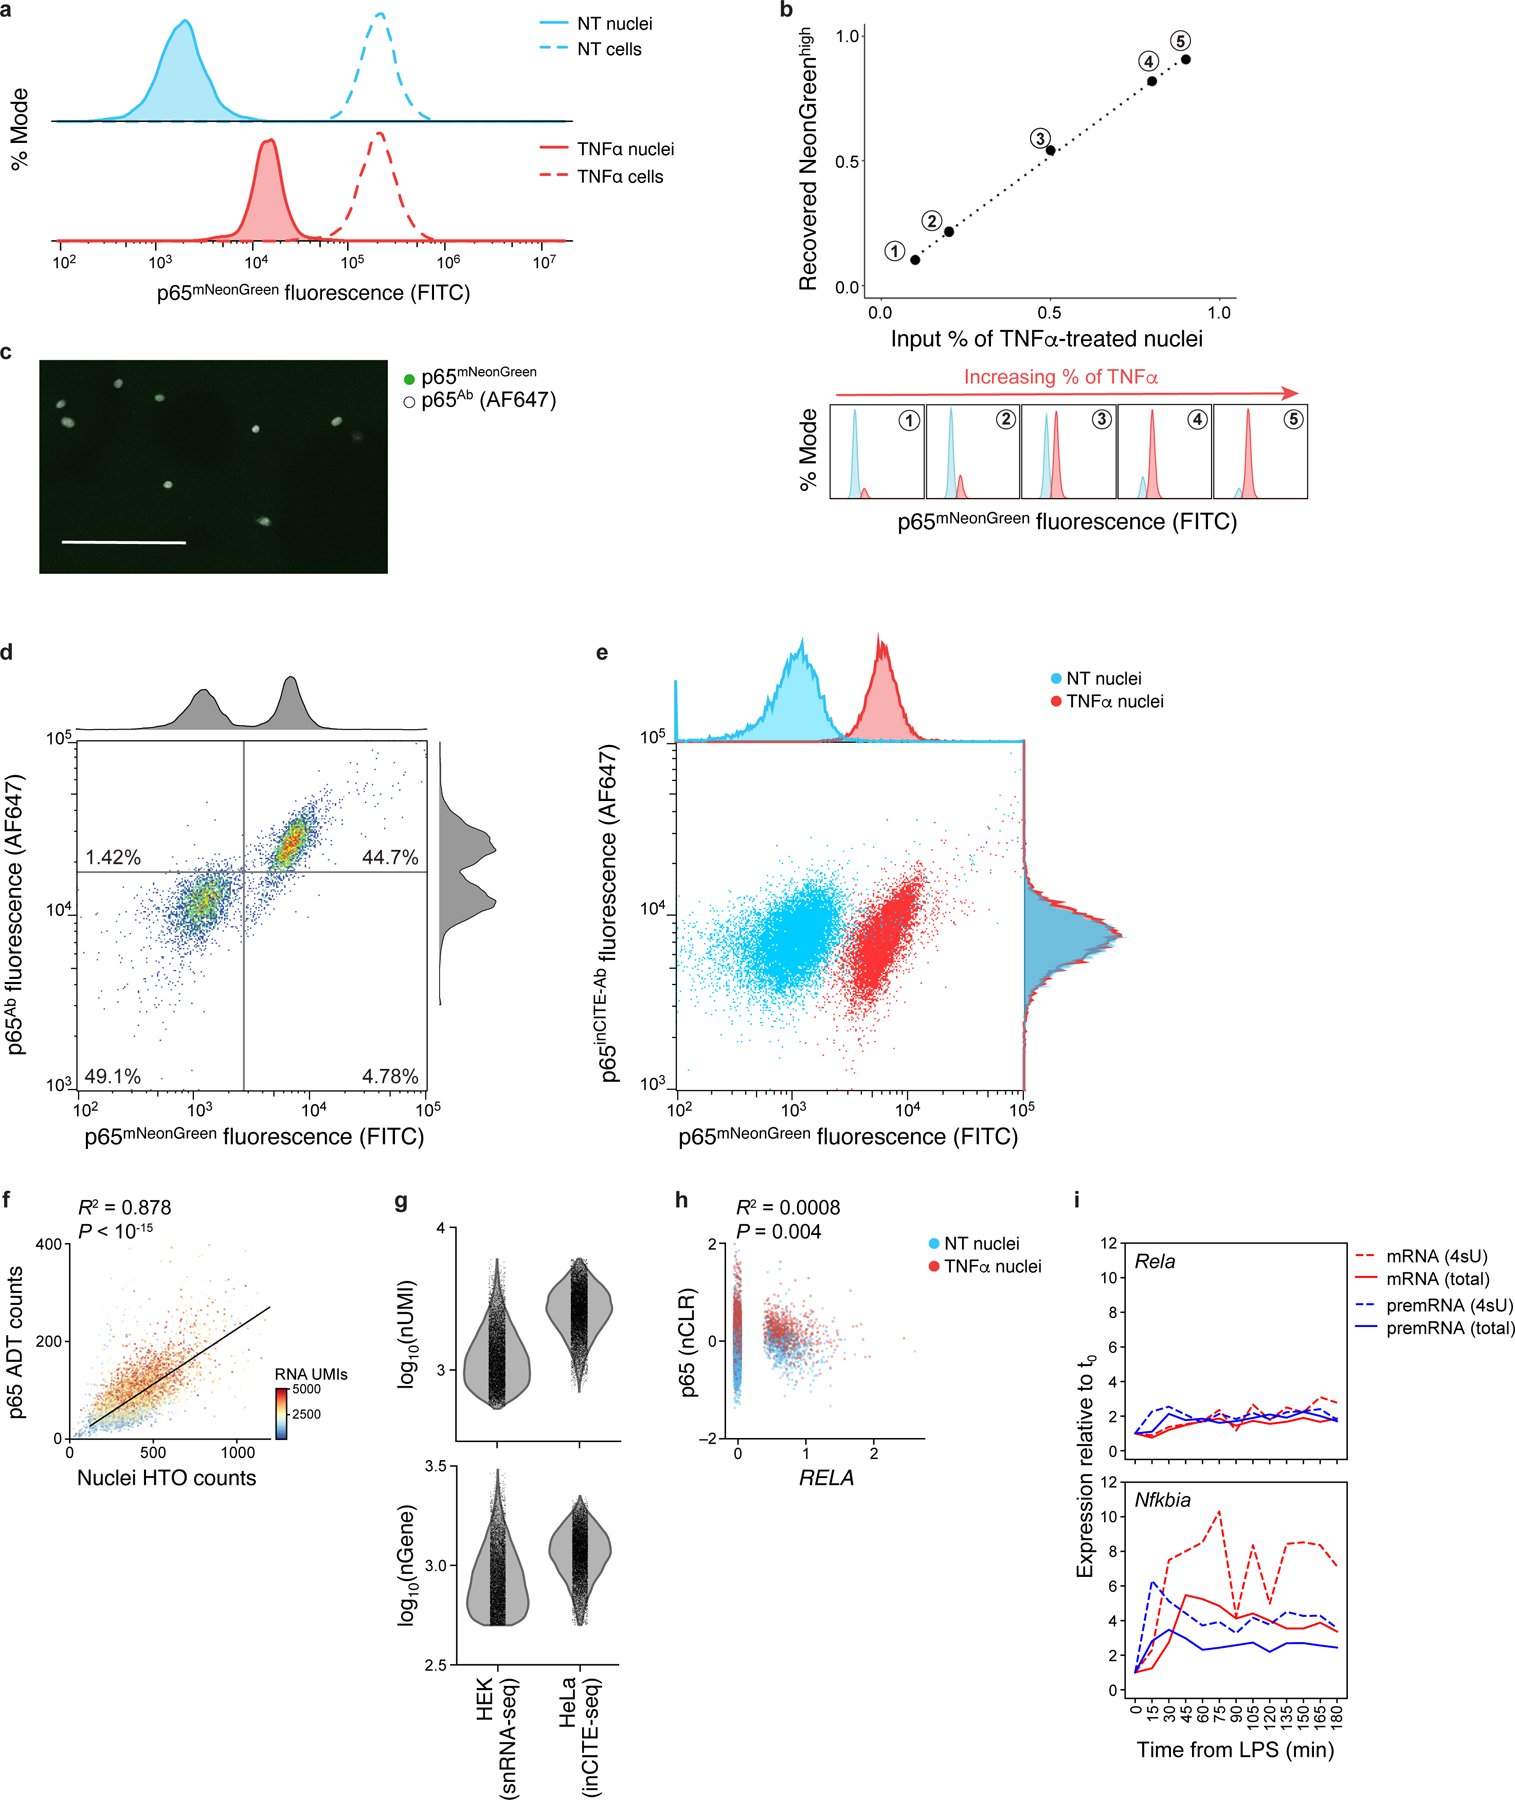
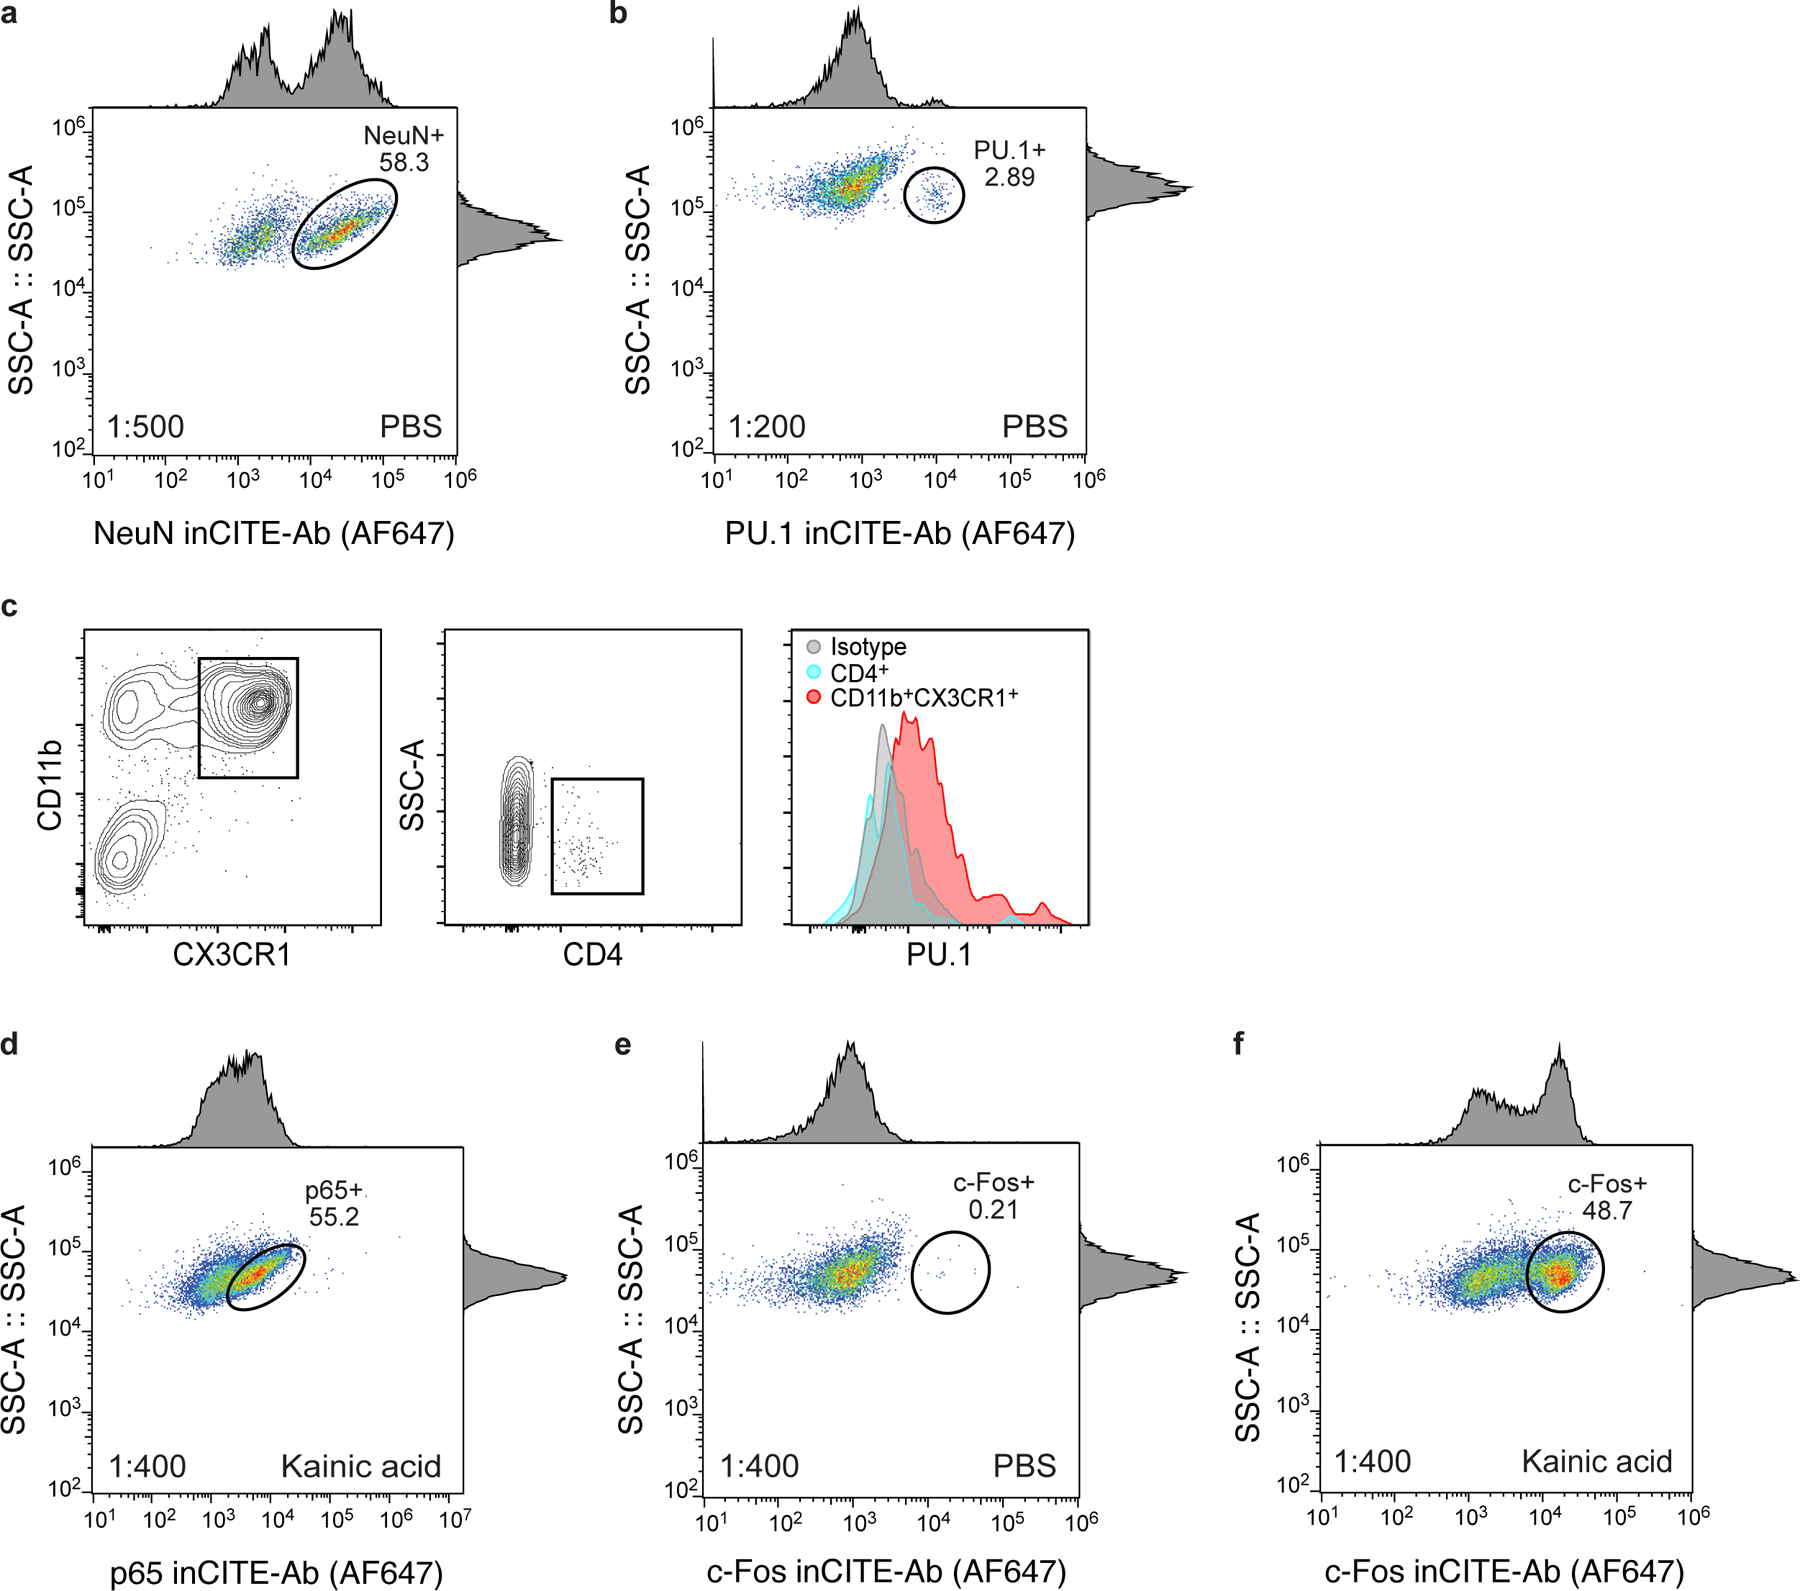
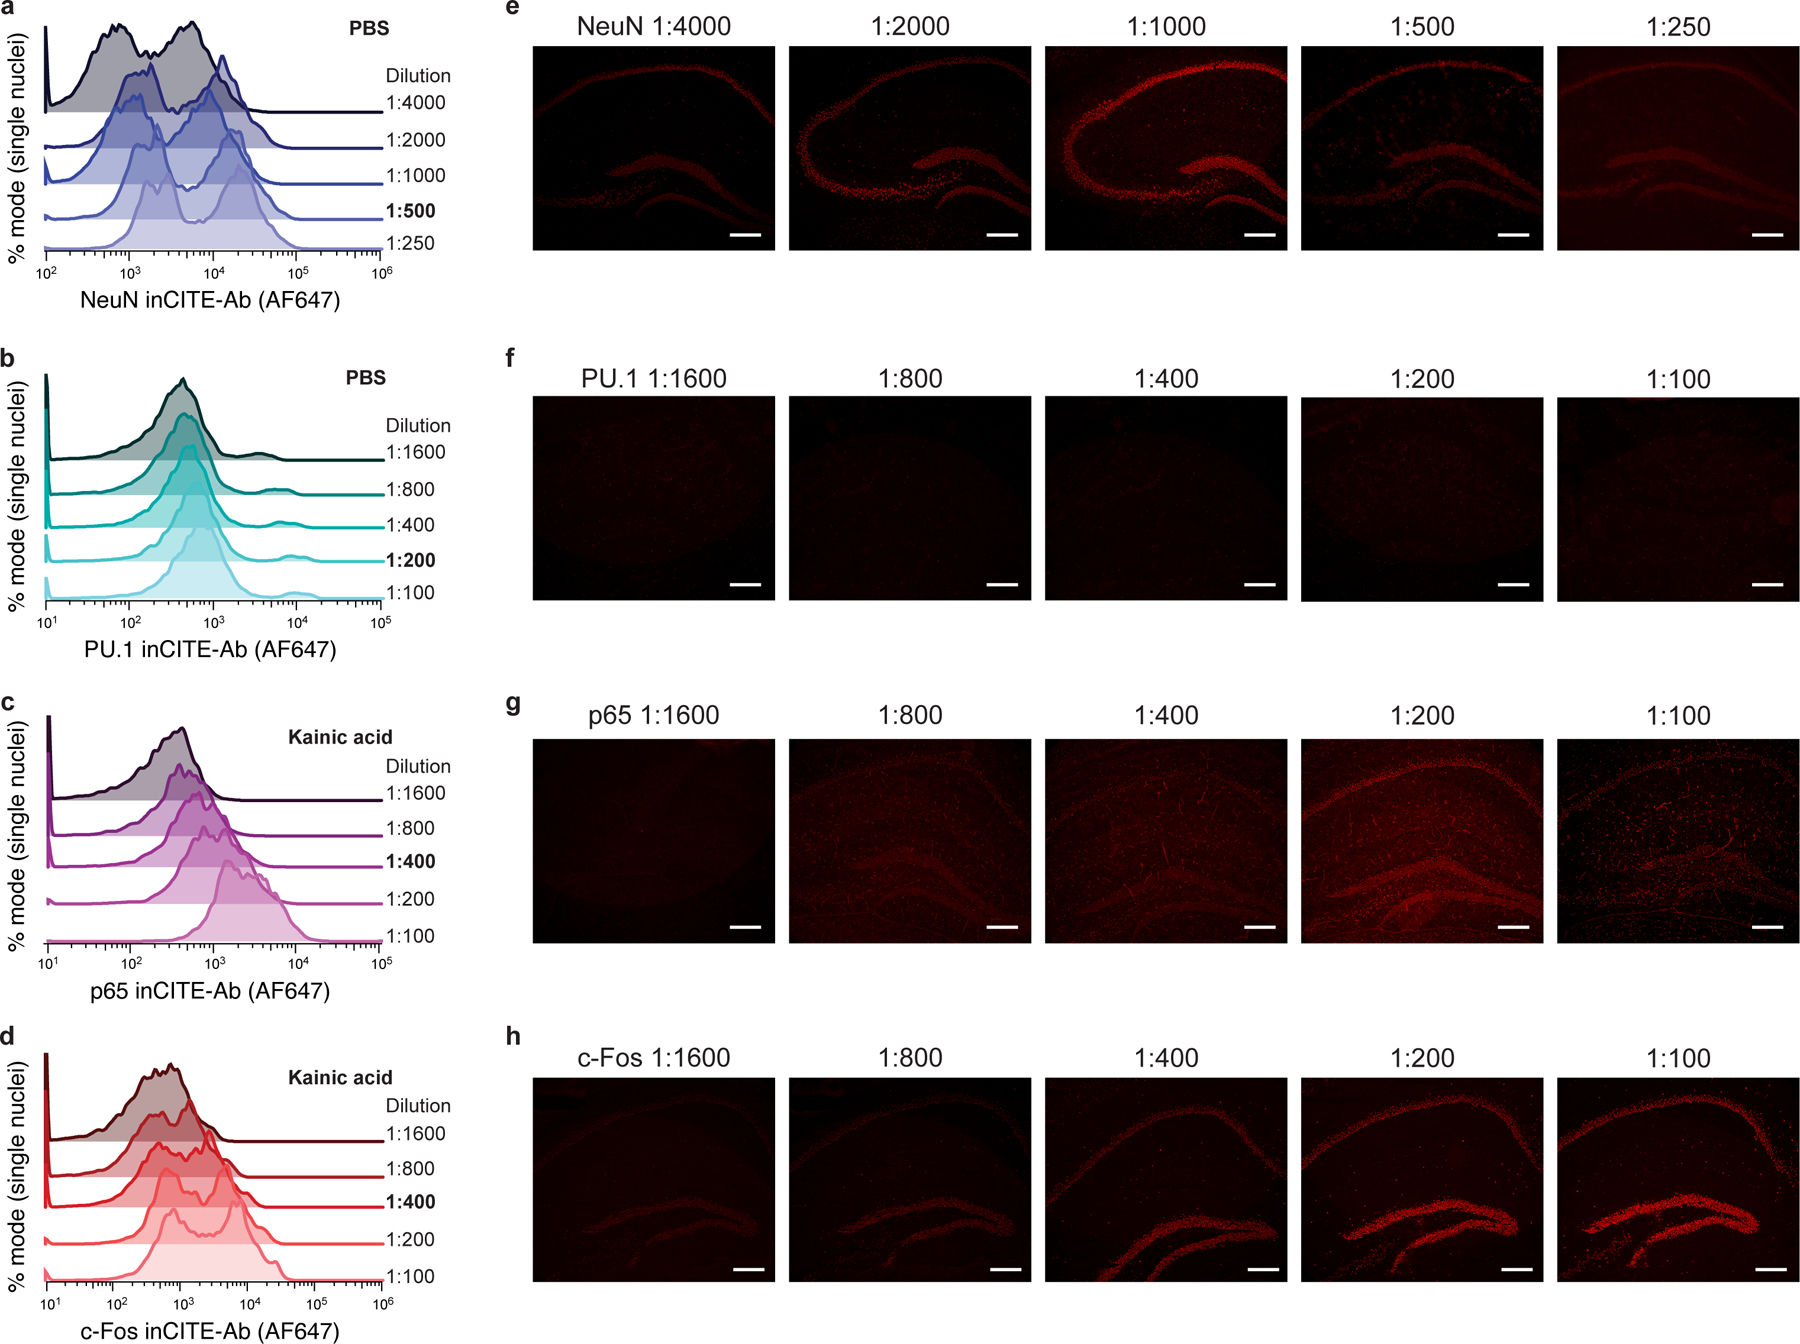
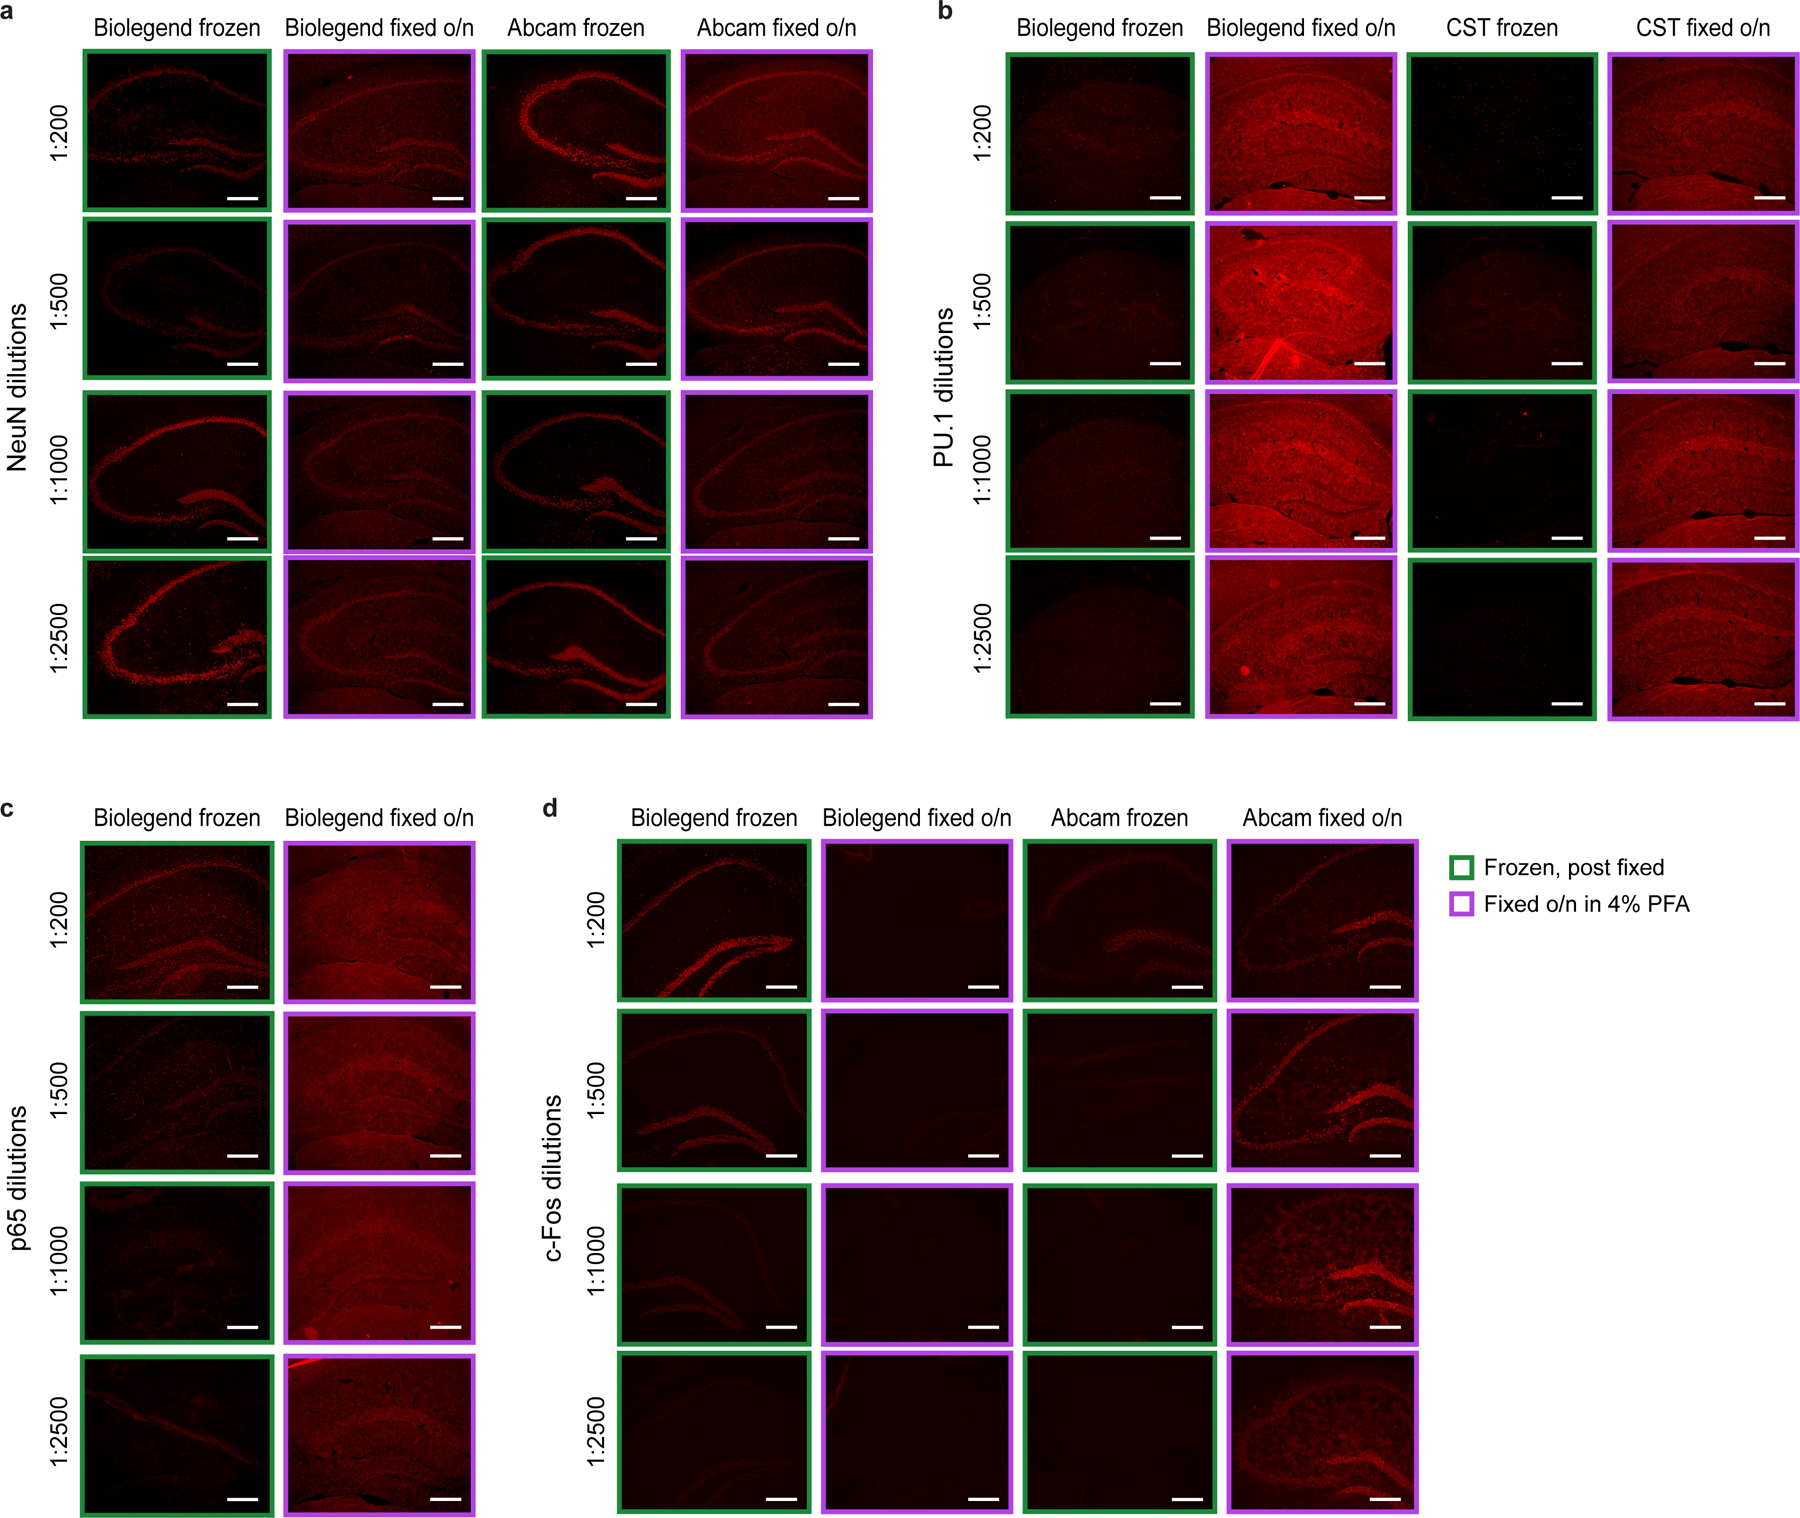
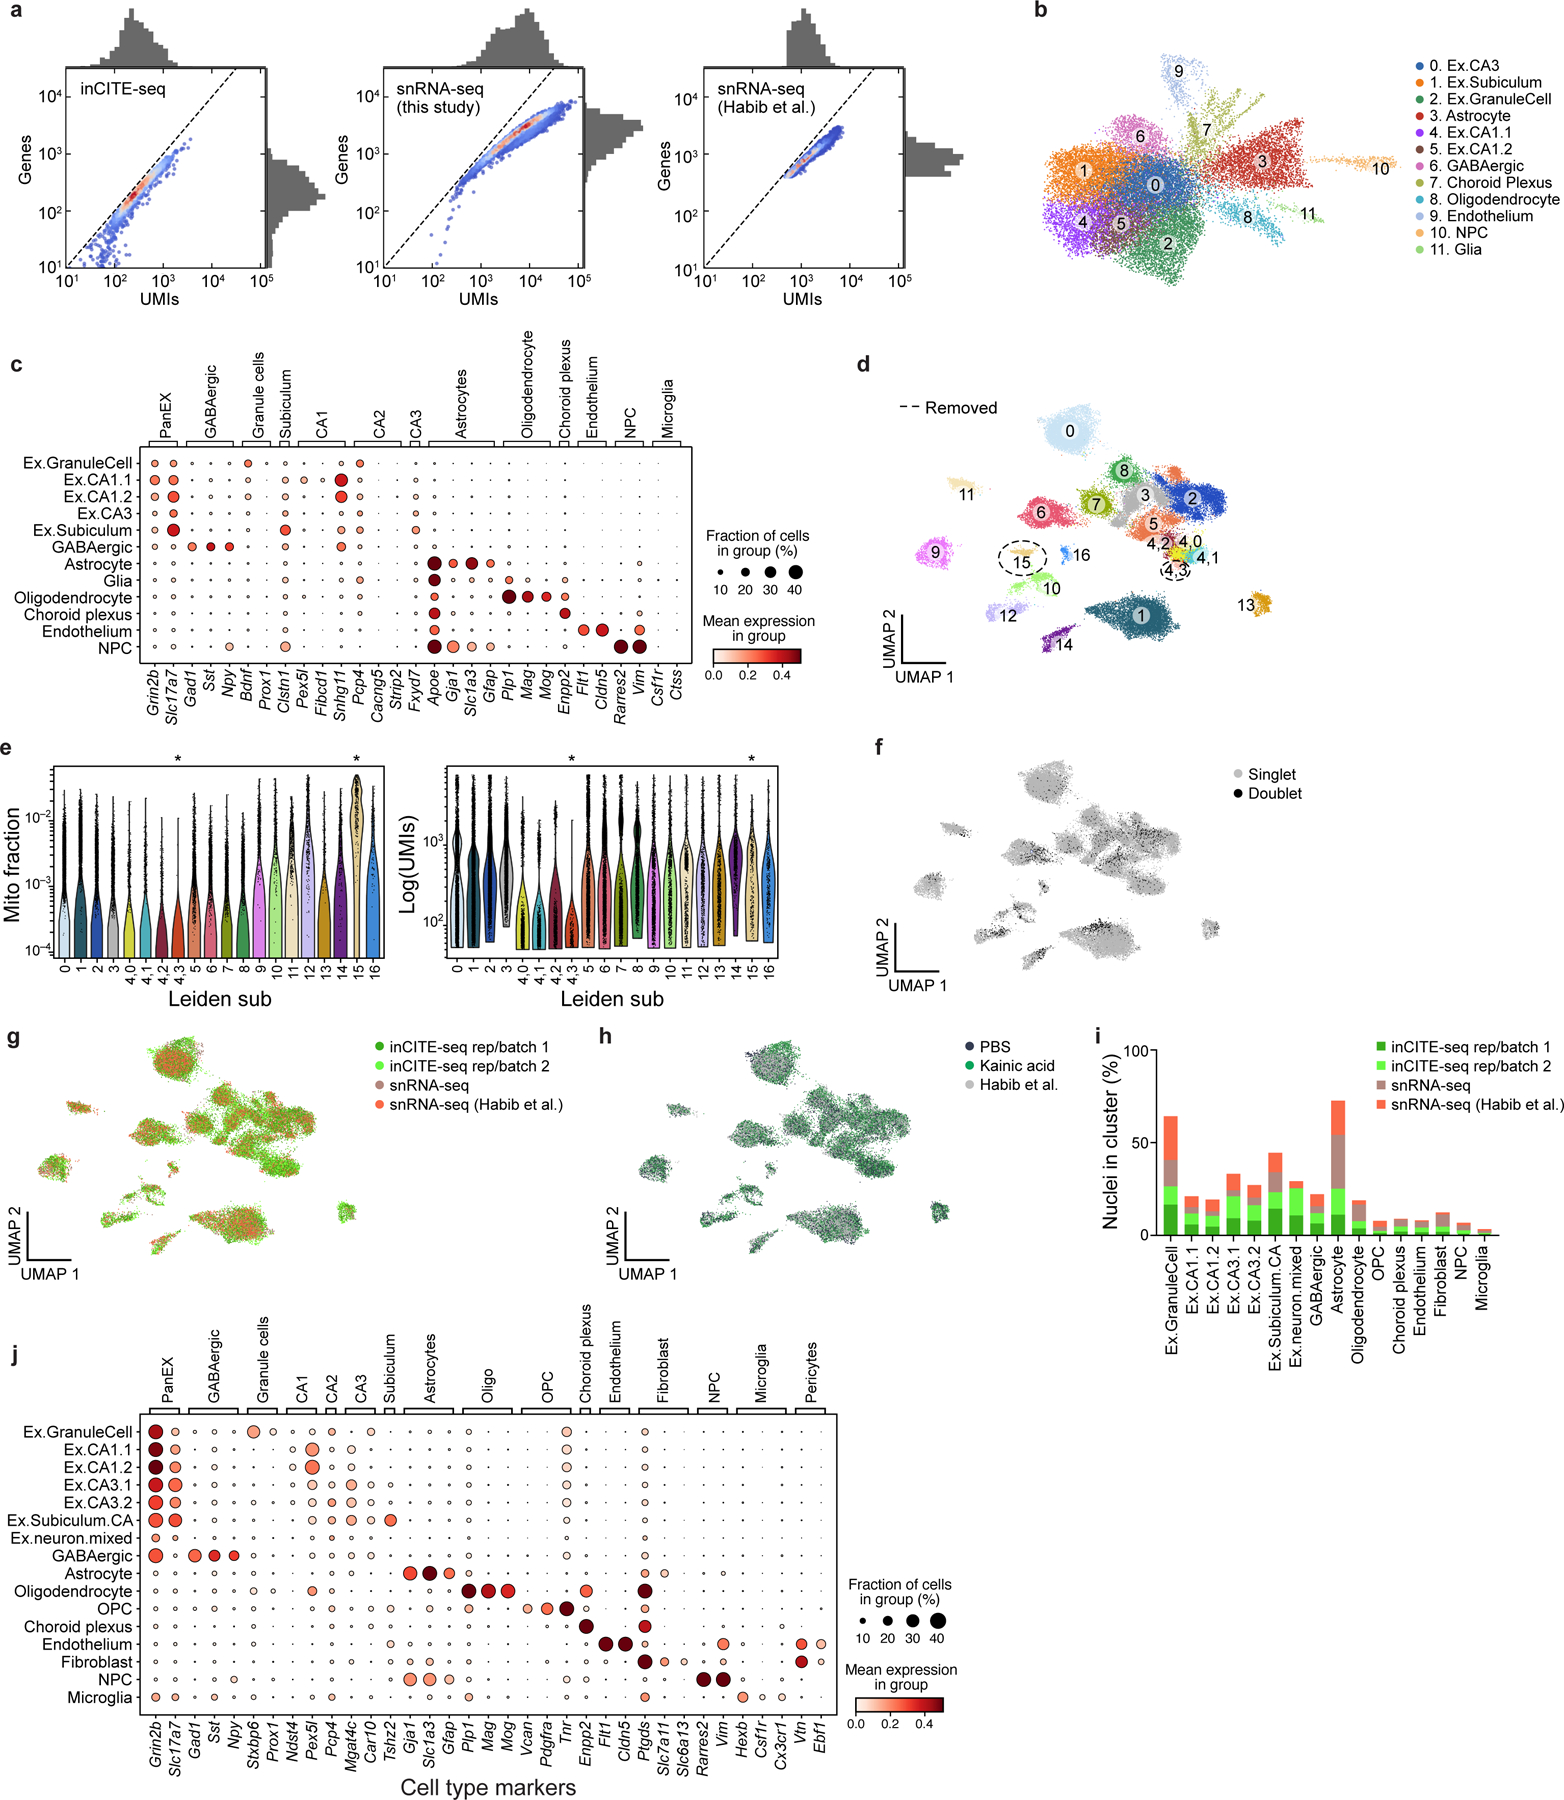
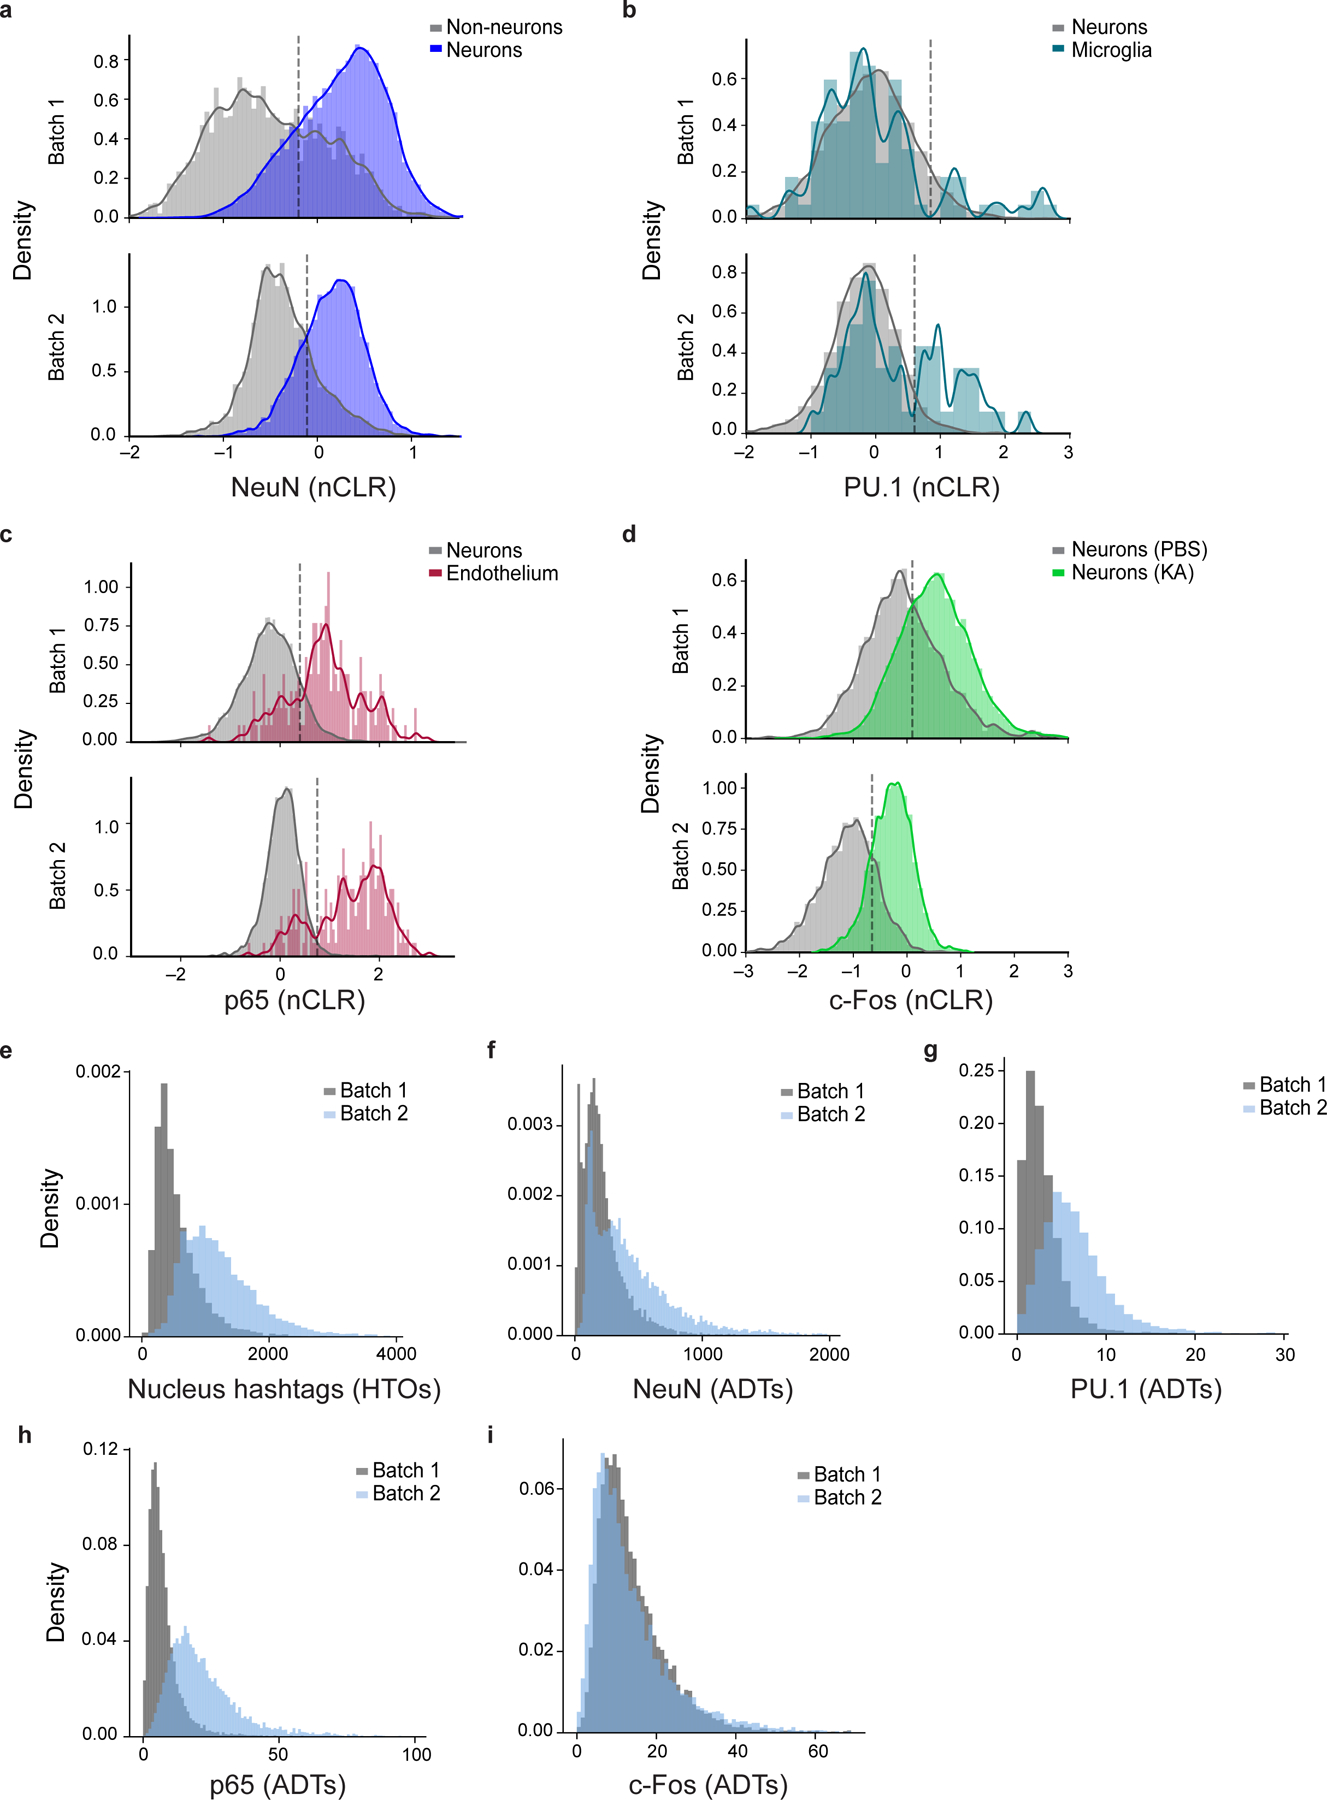
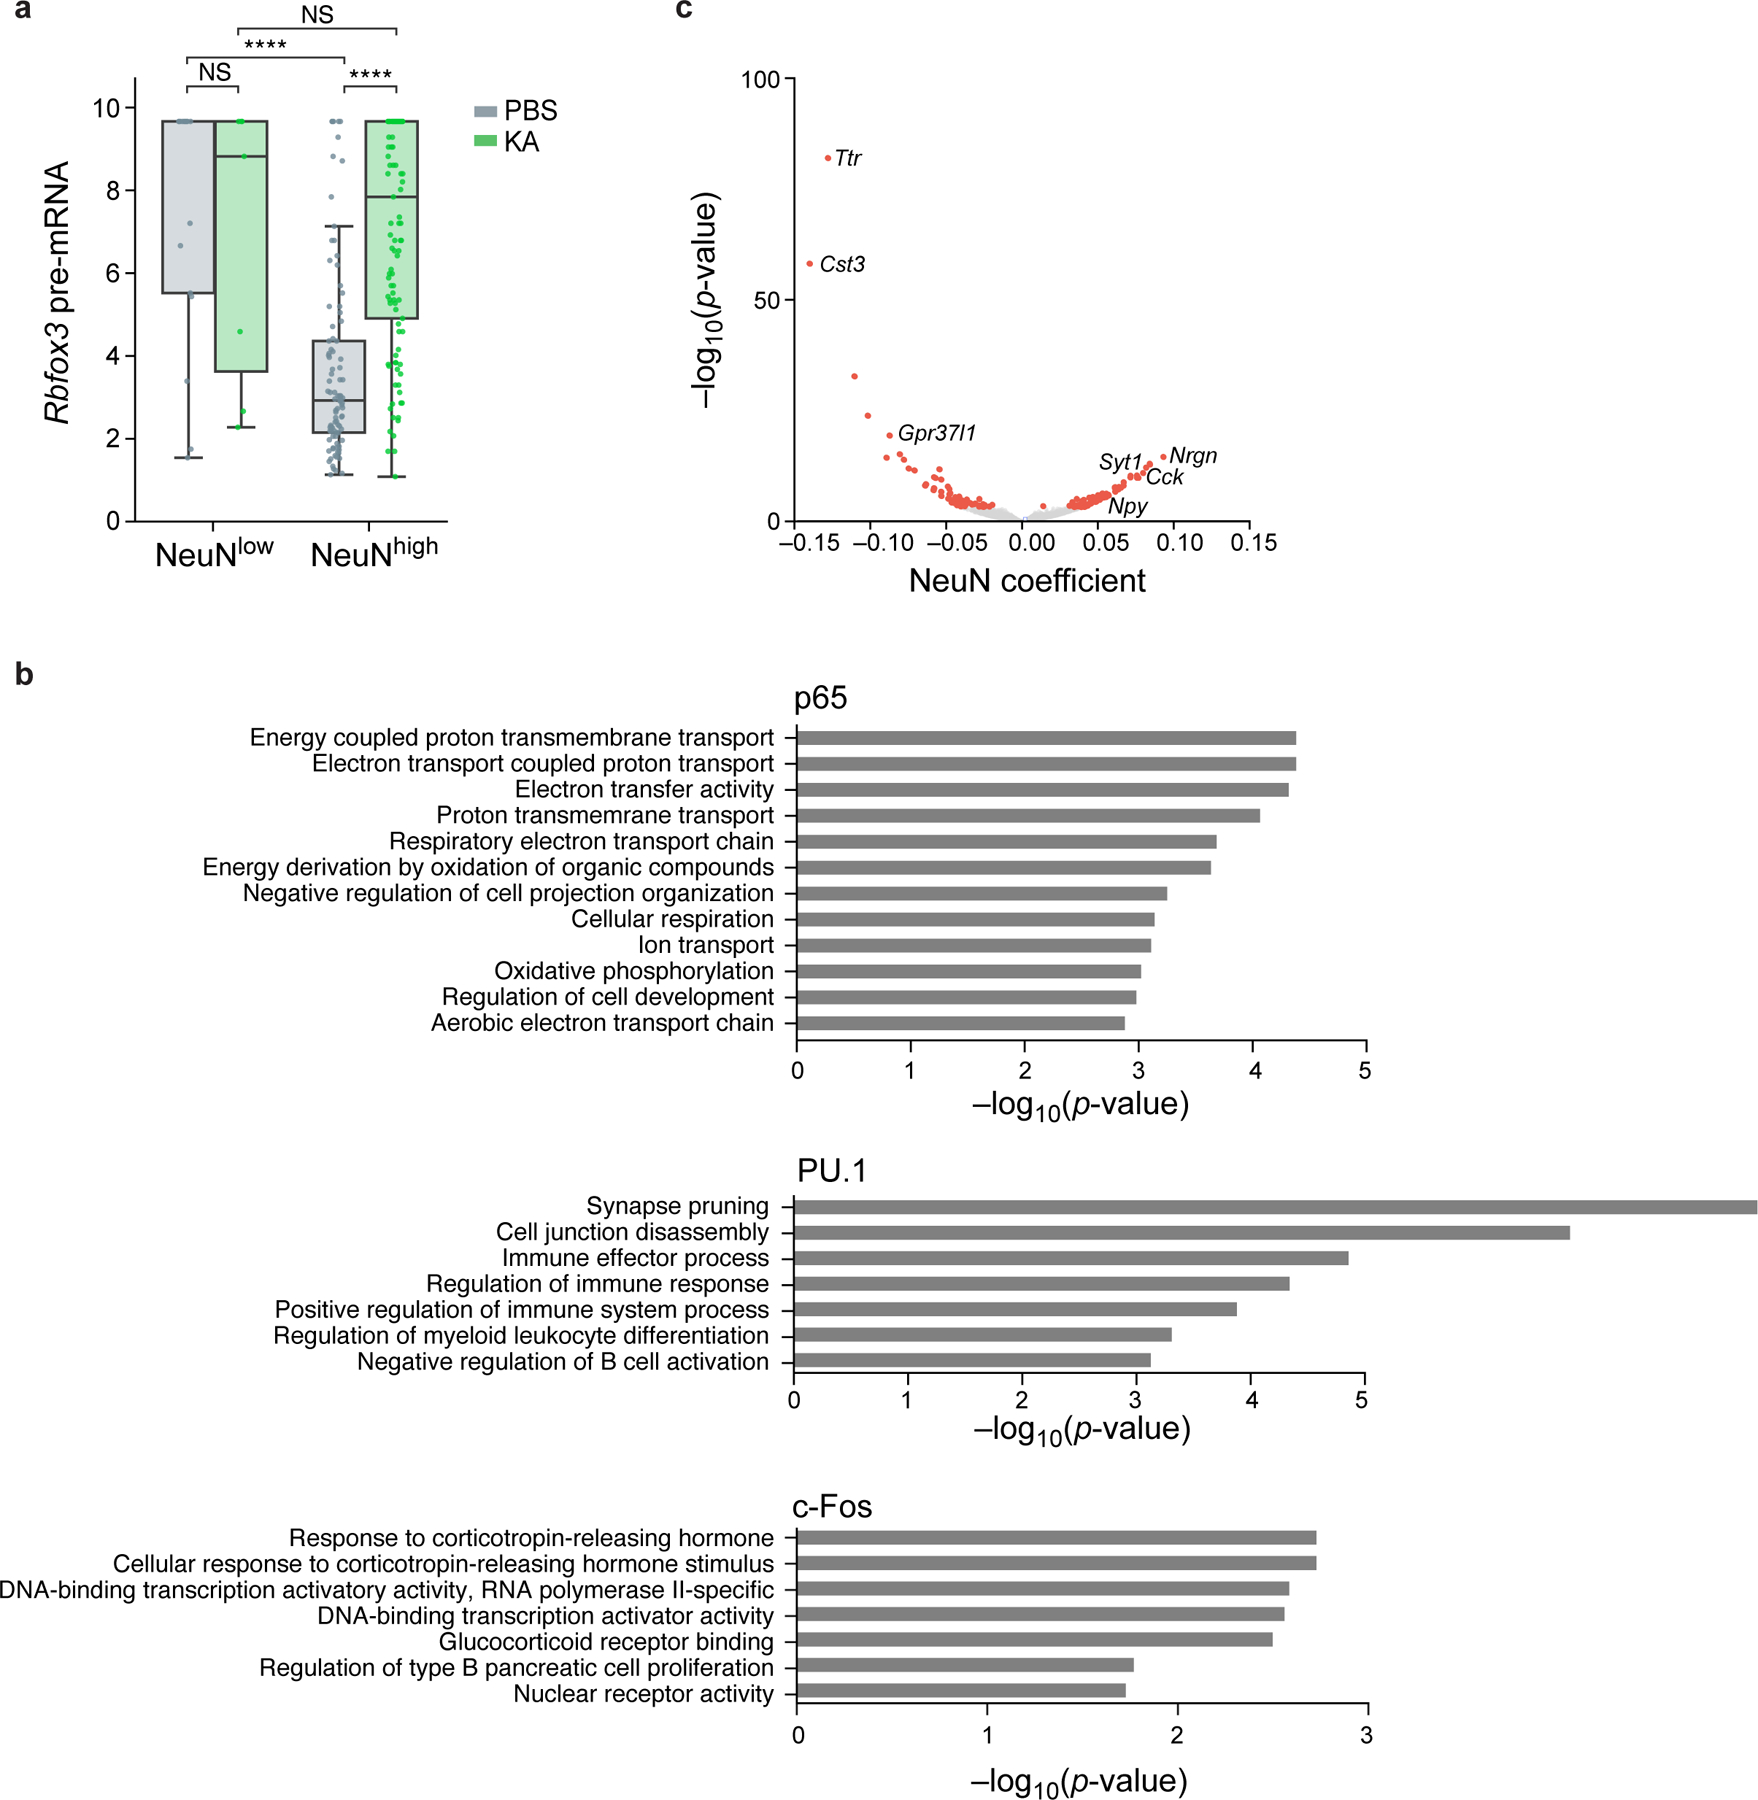
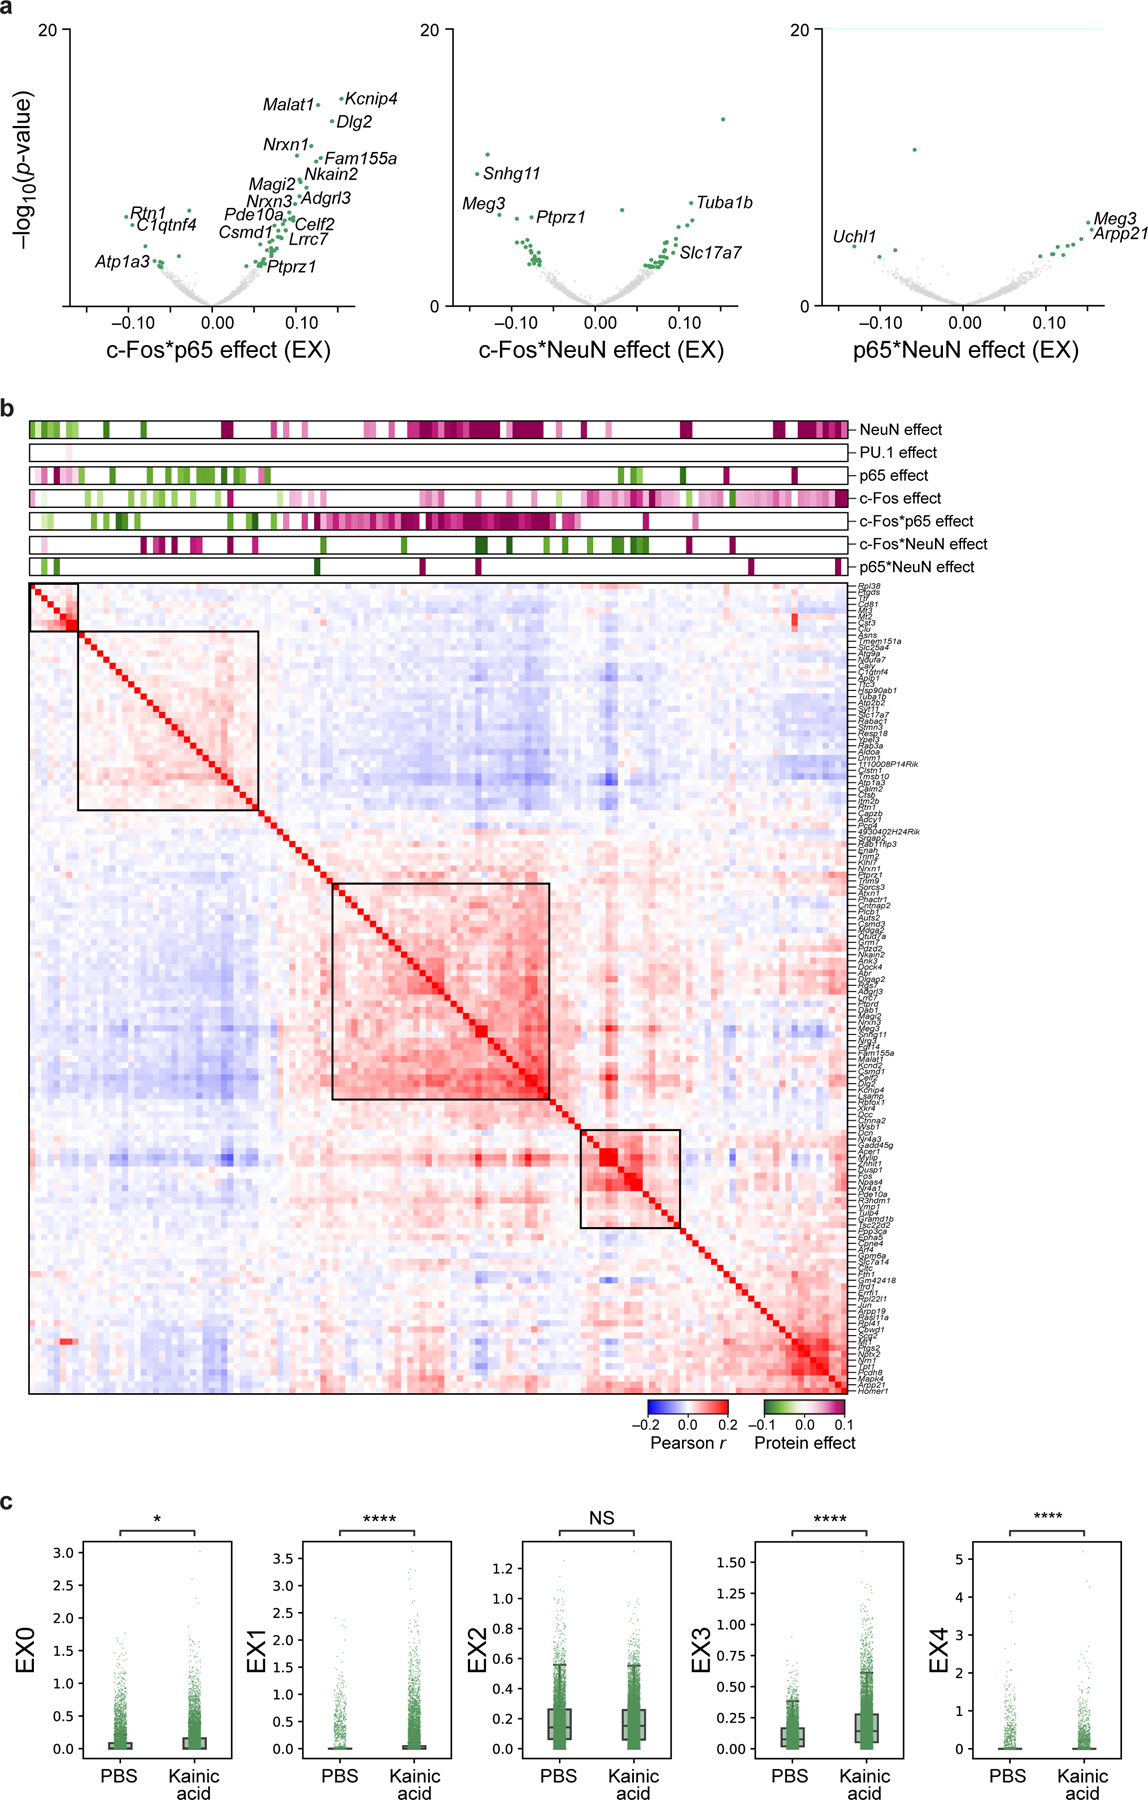
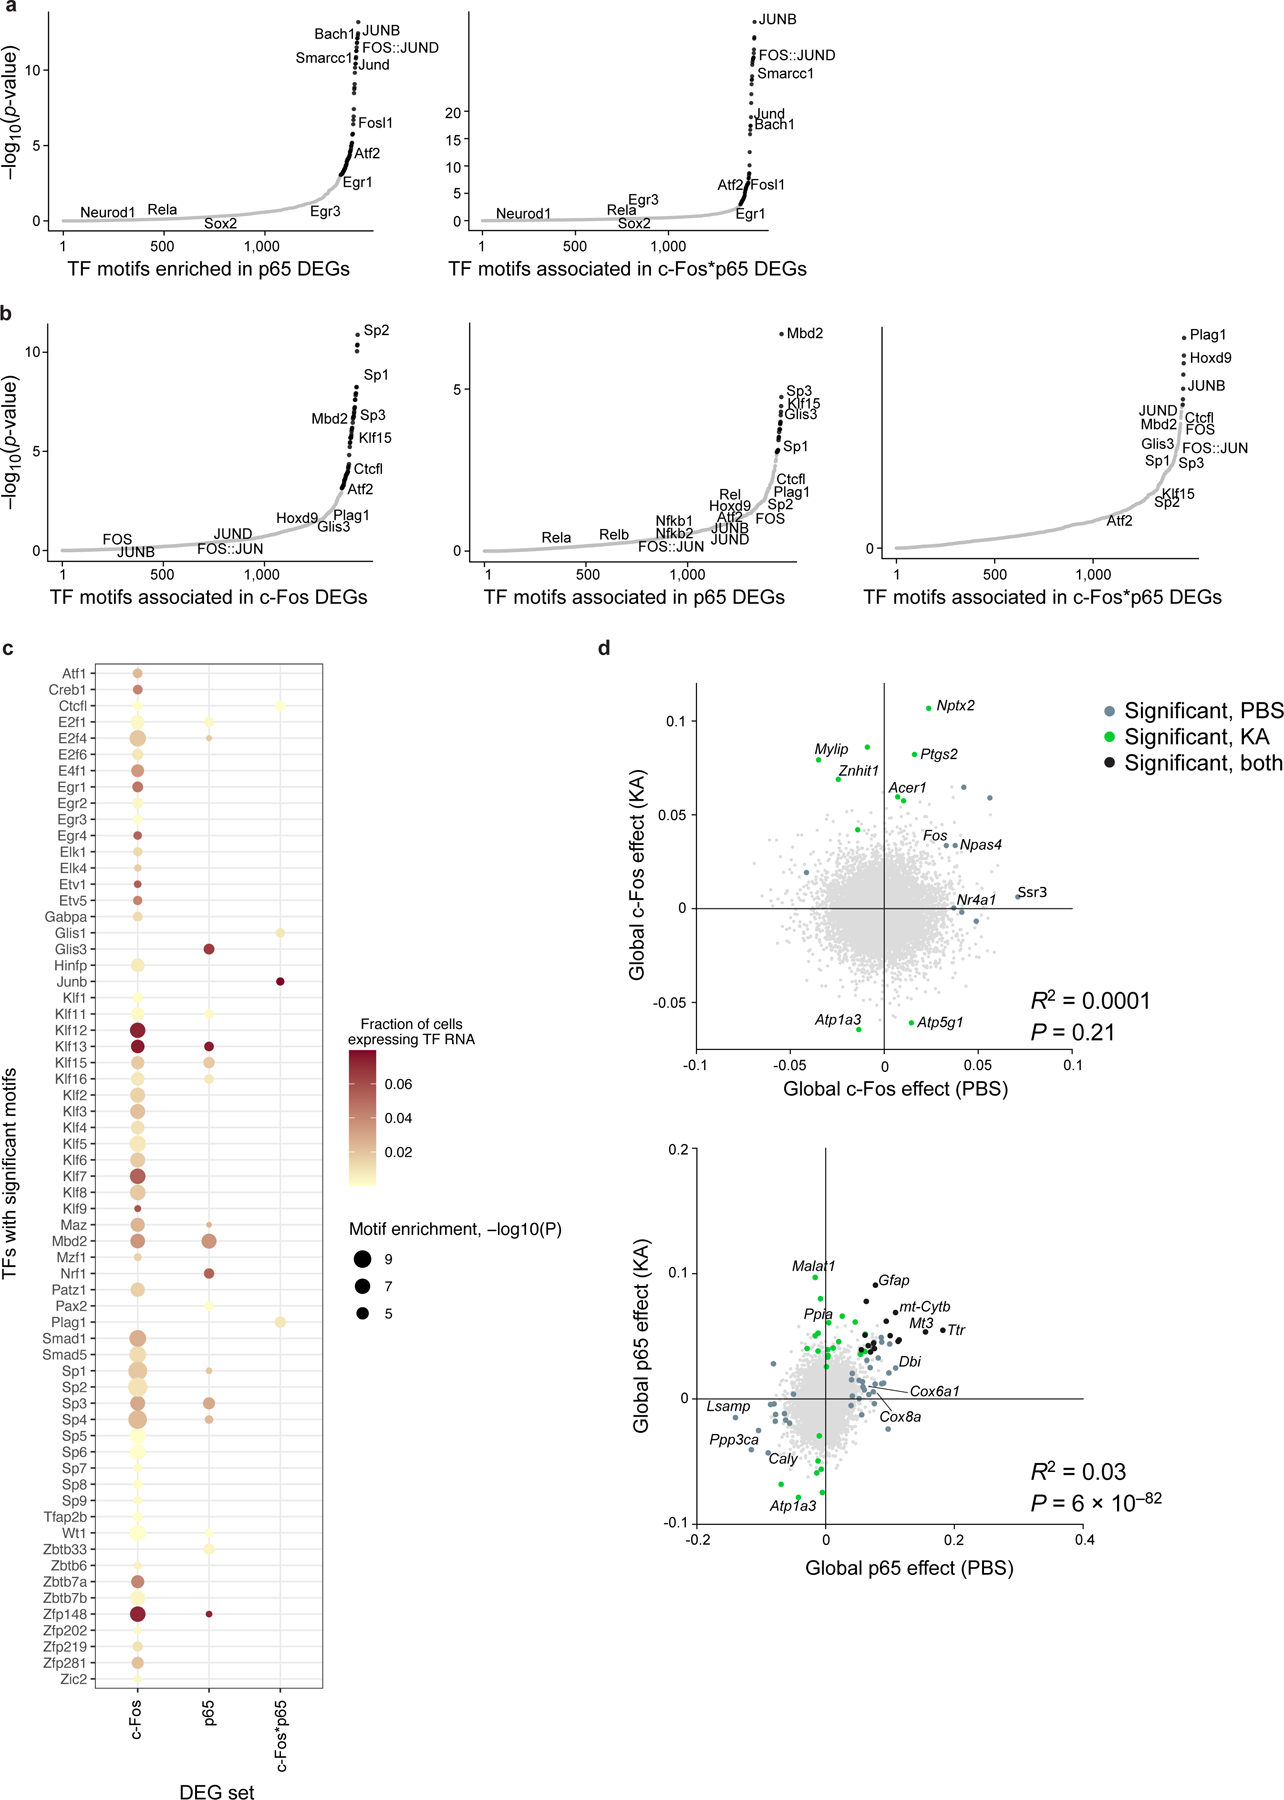
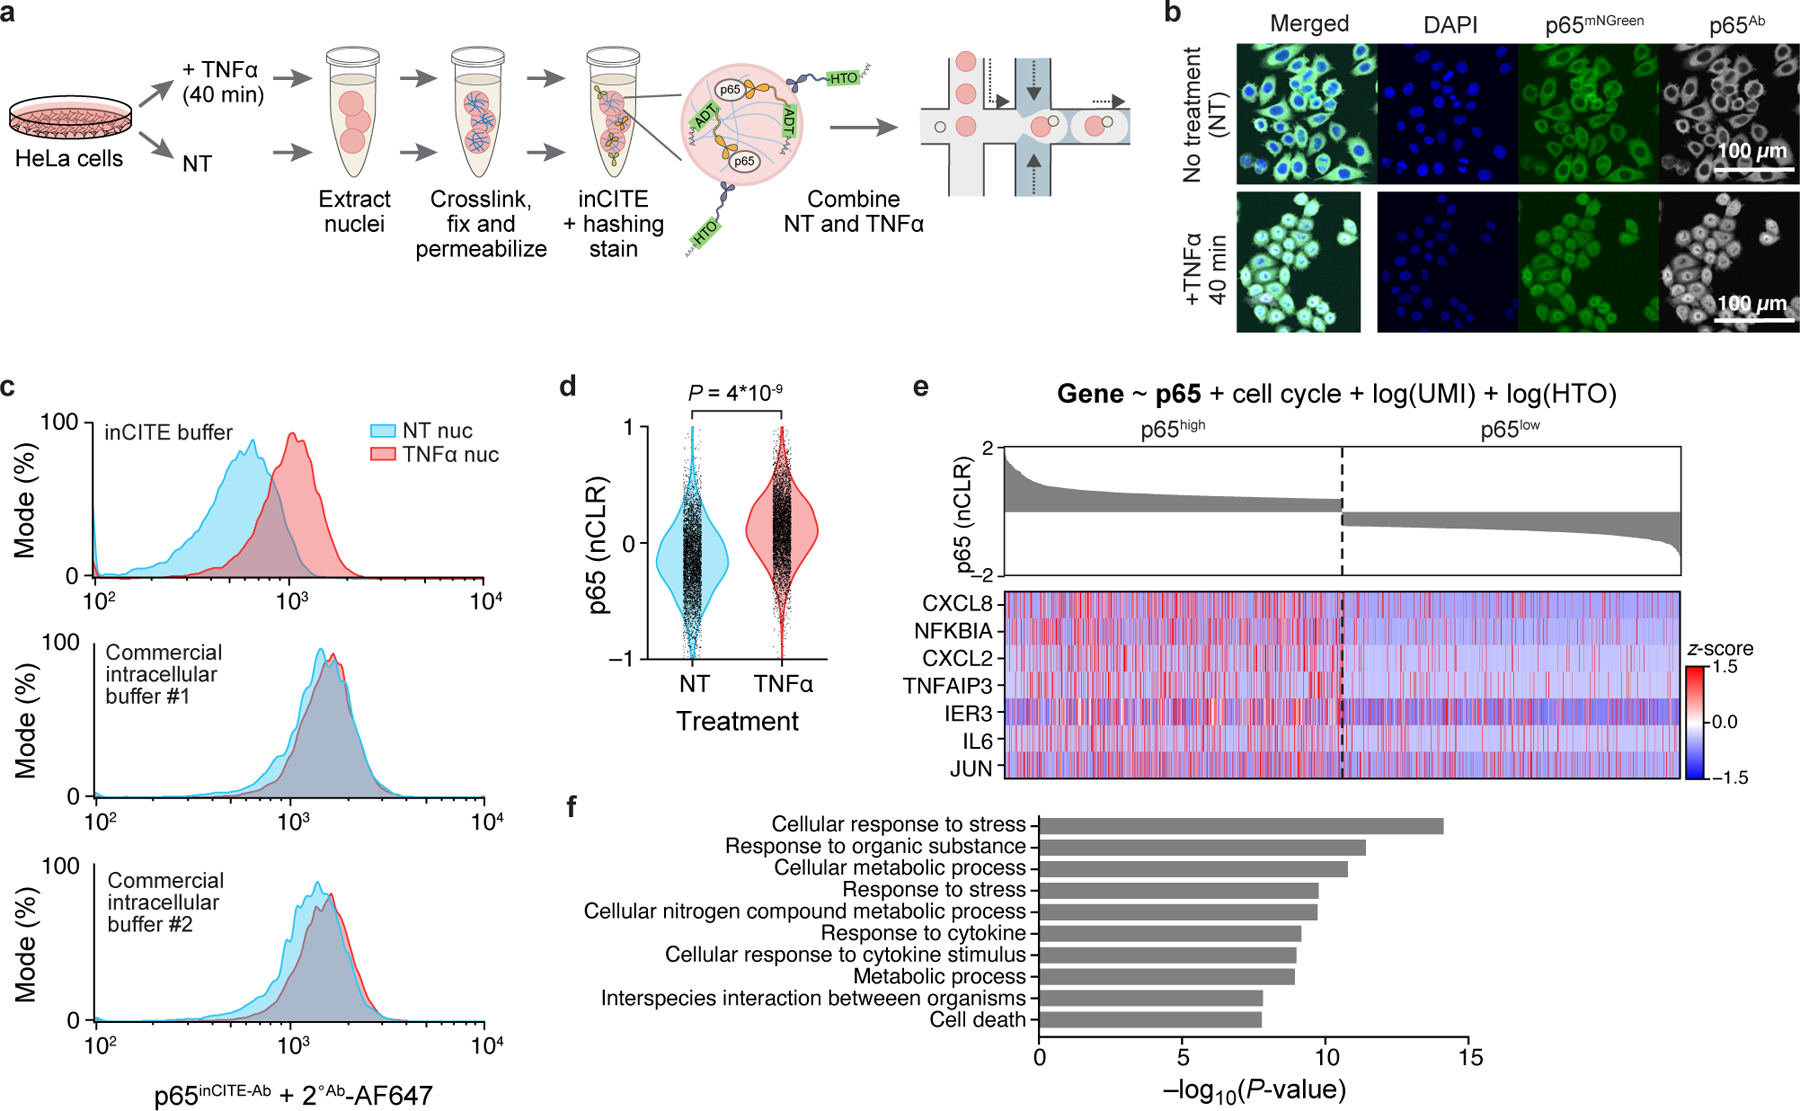
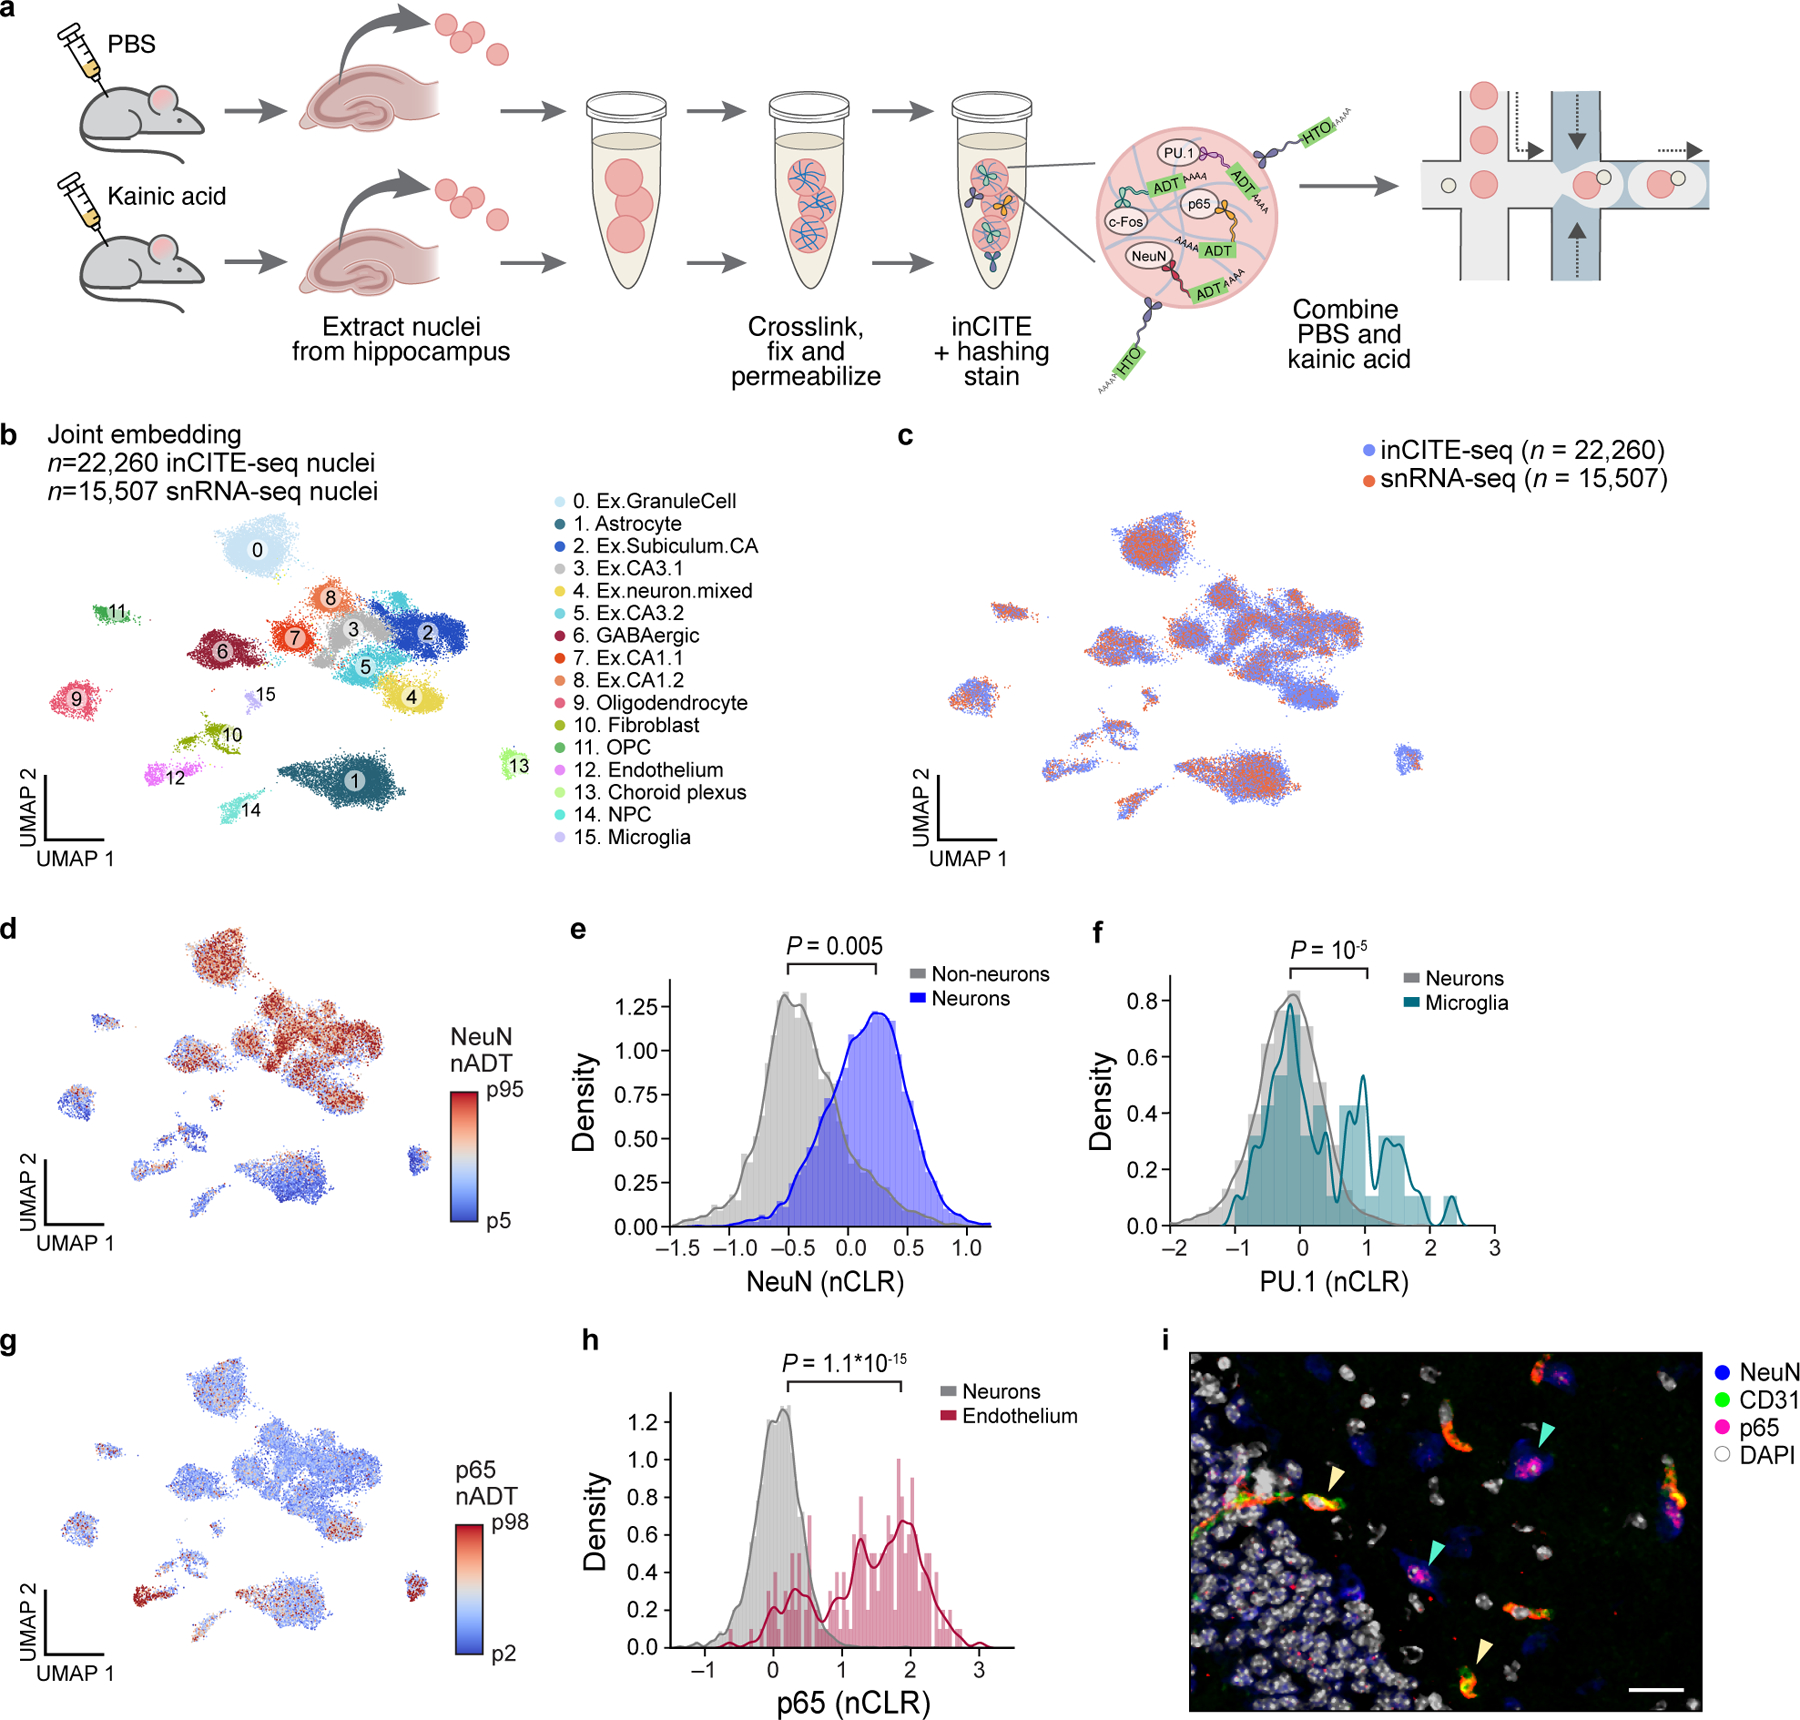
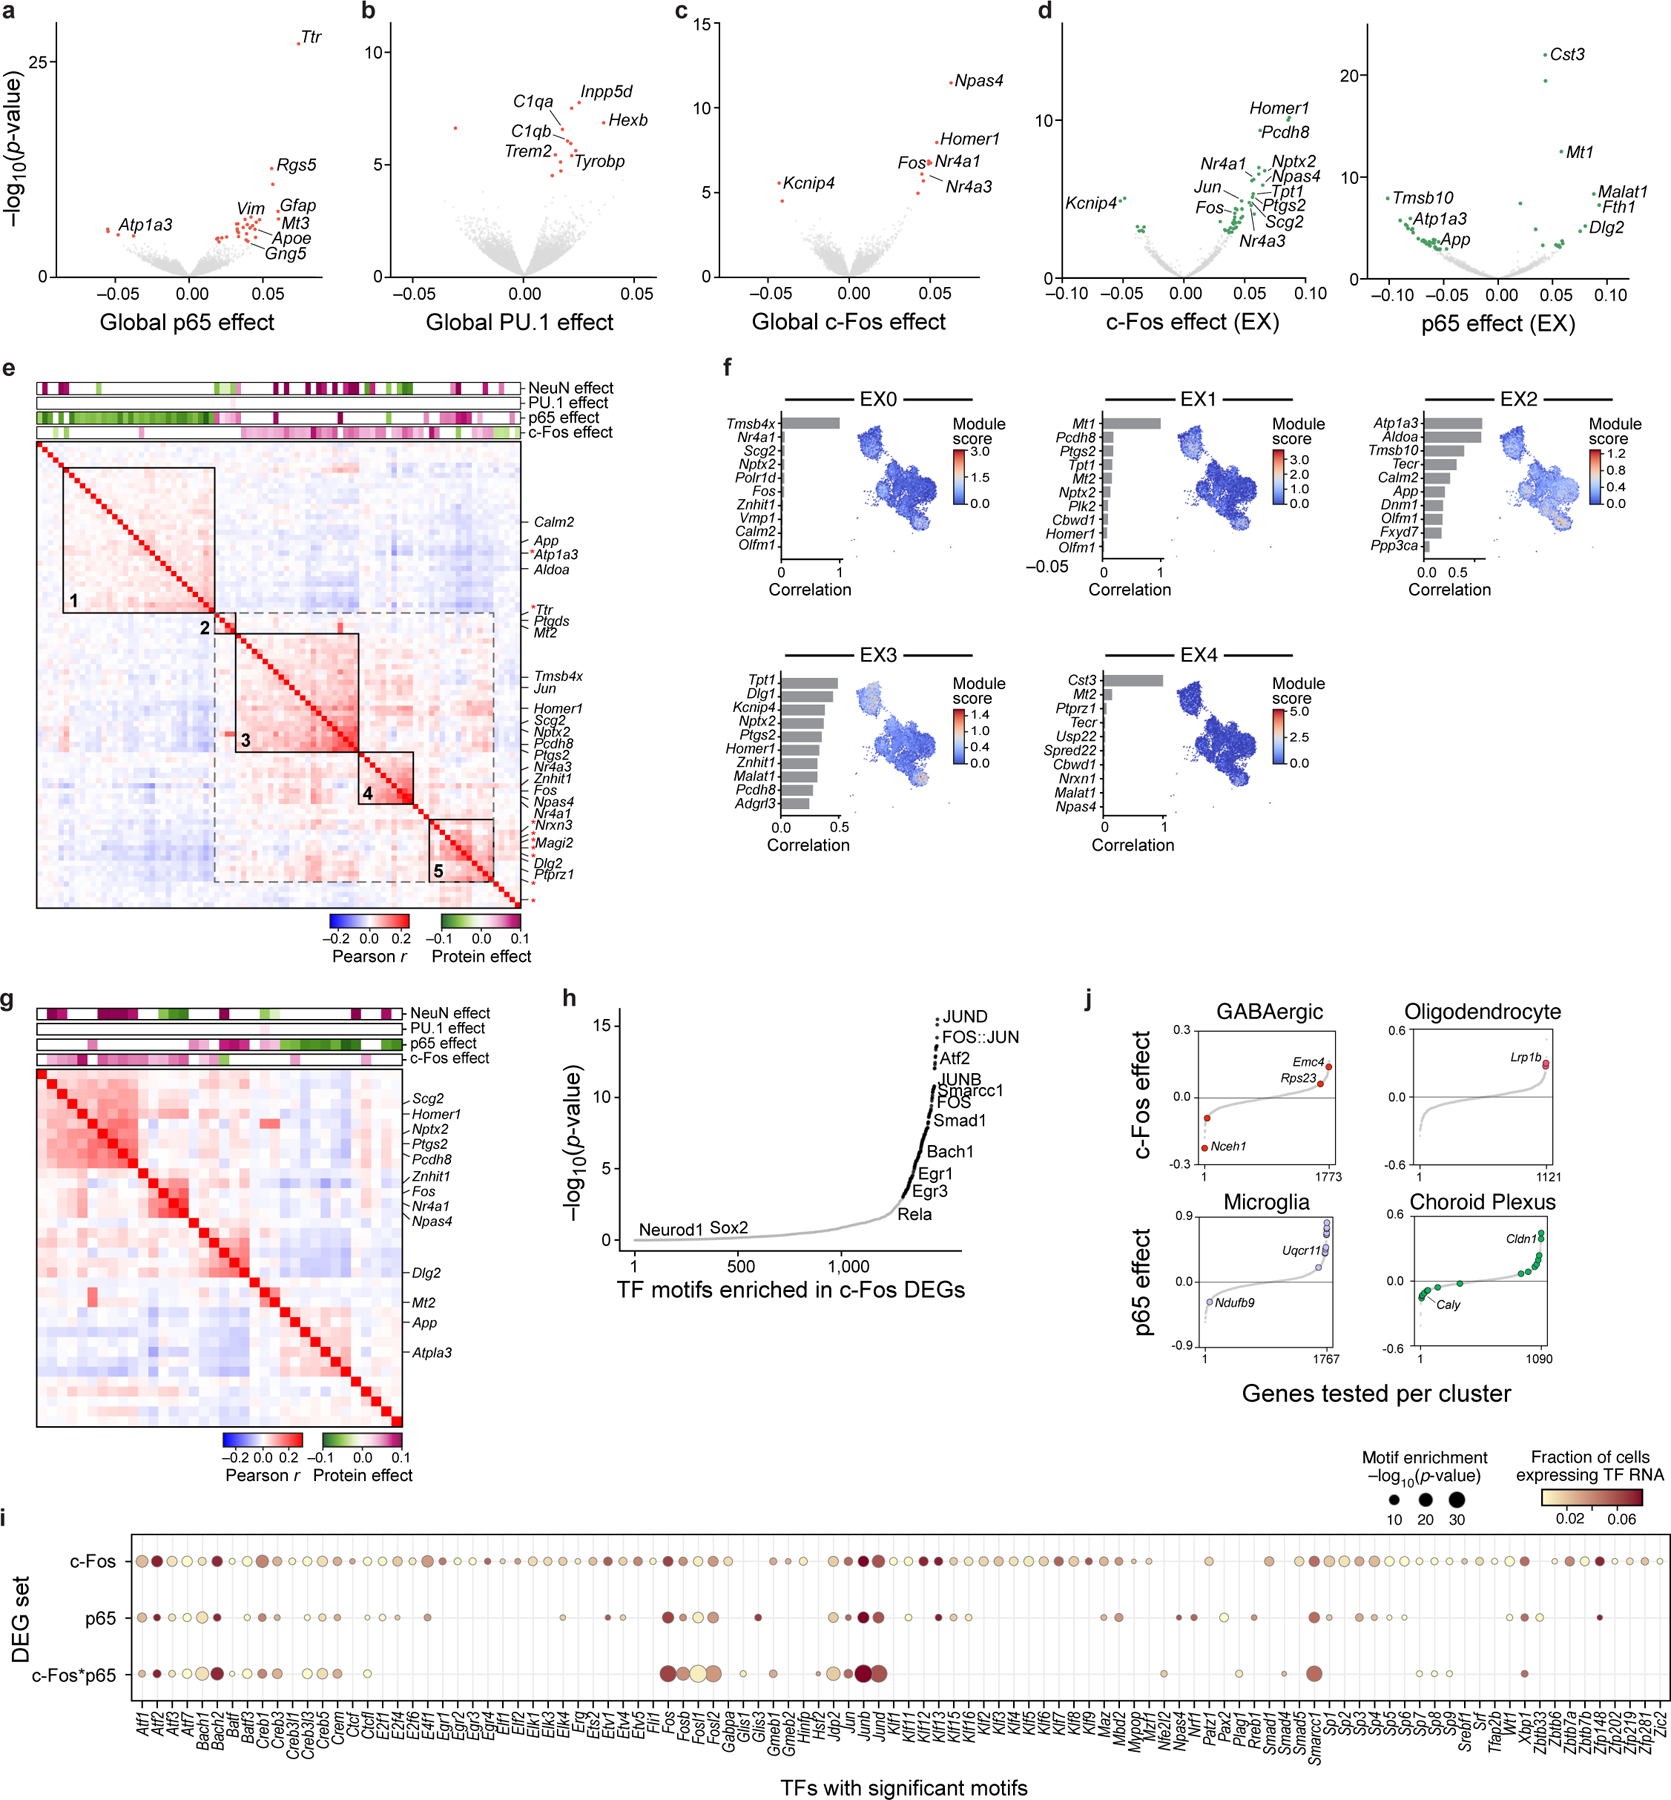
Identifying gene-regulatory targets of nuclear proteins in tissues is a challenge. Here we describe intranuclear cellular indexing of transcriptomes and epitopes (inCITE-seq), a scalable method that measures multiplexed intranuclear protein levels and the transcriptome in parallel across thousands of nuclei, enabling joint analysis of transcription factor (TF) levels and gene expression in vivo. We apply inCITE-seq to characterize cell state-related changes upon pharmacological induction of neuronal activity in the mouse brain. Modeling gene expression as a linear combination of quantitative protein levels revealed genome-wide associations of each TF and recovered known gene targets. TF-associated genes were coexpressed as distinct modules that each reflected positive or negative TF levels, showing that our approach can disentangle relative putative contributions of TFs to gene expression and add interpretability to inferred gene networks. inCITE-seq can illuminate how combinations of nuclear proteins shape gene expression in native tissue contexts, with direct applications to solid or frozen tissues and clinical specimens.


Conflict of interest statement

Competing Interests Statement

A.R. is a founder and equity holder of Celsius Therapeutics, an equity holder in Immunitas Therapeutics, and until August 31, 2020 was an SAB member of Syros Pharmaceuticals, Neogene Therapeutics, Asimov and ThermoFisher Scientific. From August 1, 2020, A.R. is an employee of Genentech. From May 2021, D.P. is an employee of Genentech. B.Y. was formerly an employee of BioLegend and is now an employee of Spatial Genomics. The remaining authors declare no competing interests.

Figures

Extended Data Fig. 1
Extended Data Fig. 1. Optimization of intranuclear antibody staining in HeLa cells.
a. Nuclear p65 levels change after TNFα treatment, while total p65 in cells remains unchanged. Distribution of p65-mNeonGreen reporter fluorescence (x axis; % mode of singlet nuclei, y axis) measured by flow cytometry of nuclei (solid line) vs. cells (dashed line) from untreated (“NT”, blue) or TNFα treated cells (red). b. Flow cytometry distinguishes p65-mNeonGreen signals across mixtures of NT and TNFα. Top: Flow cytometry measures of mNeonGreenhigh fraction (x axis) match the input fraction of TNFα nuclei (x axis). Bottom: Corresponding high (red) and low (blue) mNeonGreen distributions. c. Immunofluorescence of nuclei smeared onto a slide after intranuclear p65 stain in suspension, showing complete antibody diffusion into the nucleus; representative of 3 experiments. Scale: 100μm. d,e. Comparing antibody- and fluorescence reporter-derived p65 levels. Antibody (from Alexa Fluor 647 secondary, y axis) and mNeonGreen (x axis) signal of p65 in an equal mixture of NT and TNFα stimulated nuclei. Histograms: marginal distributions. d. Agreement between unconjugated p65 antibody and mNeonGreen signal. e. No relationship between DNA-conjugated p65inCITE-Ab and mNeonGreen signal using standard intranuclear staining buffer (pre-optimization). f. Relation between nuclei hashtag oligonucleotide (HTO; x axis) counts and p65 antibody-derived tag (ADT; y axis) counts, shown across 10,014 NT and TNFα nuclei, colored by the number of RNA UMIs. Top left: Pearson R2 and associated P-value (two-sided t-test). To control for this relation, we normalize protein ADT counts by nuclei HTO counts (Methods). g. Comparing RNA complexity from inCITE-seq (fixed HeLa nuclei) and MULTI-seq (unfixed HEK nuclei, from McGinnis et al.) by the distribution of the number of detected transcripts (UMIs; top) and genes (bottom). h. Low correlation between p65 protein (y axis, nCLR) and RELA RNA levels (x axis, log normalized), with Pearson R2 and associated P-value (two-sided t-test). Dots: nuclei colored by treatment (NT, blue; TNFα, red). i. Dynamics of gene expression after LPS stimulation in mouse dendritic cells, from Rabani et al., measured across time (x axis). Relative expression to steady state, t0 (y axis): pre-mRNA precursor (blue) and mRNA (red) for total (solid) vs. 4sU labeled (dashed) RNA, shown for Rela (top) and Nfkbia (bottom), a p65 target as in Fig. 1e.
Extended Data Fig. 2
Extended Data Fig. 2. Flow cytometry of inCITE targets on nuclei or cells extracted from frozen mouse hippocampus.
Flow cytometry of nuclei populations from the mouse hippocampus after intranuclear stains with inCITE antibodies, followed by Alexa Fluor 647-conjugated secondary stain: NeuN in PBS (a), PU.1 in PBS (b), p65 in kainic acid (KA) (d), and c-Fos in PBS (e) and kainic acid (KA) (f) treated mice. Axes show fluorescence signal (x axis) and side scatter (y axis) of singlet nuclei (dots); histograms show marginal distributions. Oval gates show NeuNhigh (a, 58.3%), PU.1high (b, <3%), p65high (d, 55.2%), c-Foshigh (0.21% in PBS (e), and 48.7% after KA treatment (f)). c. Right: Distribution of PU.1 in microglia (CD11b+ CX3CR1+, red), CD4+ cells (blue) and isotype (gray) cells measured by flow cytometry (left and middle panels) after simultaneous surface protein and intracellular protein stains (Methods).
Extended Data Fig. 3
Extended Data Fig. 3. Antibody signal varies across concentration regimes.
Antibody stains of the mouse hippocampus (extracted nuclei or in situ) with inCITE antibodies across a wide range of dilutions, targeting NeuN in PBS (a,e), PU.1 in PBS (b,f), p65 in kainic acid (c,g), and c-Fos in kainic acid (d,h) treated mice. Antibody-derived fluorescence measured by Alexa Fluor 647-conjugated secondary antibody stain. a-d. Histograms are normalized as % mode of nuclei singlets. Antibody dilutions are indicated to the right of each axis, with dilutions used for inCITE-seq in bold (NeuN 1:500, PU.1 1:200, p65 1:400, c-Fos 1:400). e-h. In situ immunofluorescence of frozen mouse hippocampus with inCITE antibodies across different dilutions, matching the concentrations used in flow cytometry; representative of 2 independently conducted experiments. Scale bars, 100μm.
Extended Data Fig. 4
Extended Data Fig. 4. Impact of tissue preparation on epitope detection by antibodies.
Comparing in situ immunofluorescence of antibody stains (followed by Alexa Fluor 647-conjugated secondary stain) in mouse hippocampus tissue that were immediately frozen (green box) or frozen after overnight fixation in 4% PFA (purple box, Methods) across a wide range of antibody dilutions. Images are representative of 2 independent experiments. a. NeuN in PBS. Biolegend NeuN antibody (clone 1B7) used for inCITE and Abcam NeuN antibody (clone EPR12763). b. PU.1 in PBS. Biolegend PU.1 antibody (clone 7C2C34) used for inCITE and Cell Signaling Technology PU.1 antibody (clone 9G7). c. p65 in KA. Biolegend p65 antibody (clone Poly6226) used for inCITE. d. c-Fos in KA treated mice. Biolegend c-Fos antibody (clone Poly6414) used for inCITE and Abcam c-Fos antibody (ab190289). Scale bars, 100μm.
Extended Data Fig. 5
Extended Data Fig. 5. Comparing and combining single nucleus RNA profiles from inCITE-seq and snRNA-seq of mouse hippocampus.
a. Comparing the complexity of RNA profiles from inCITE-seq and standard snRNA-seq of the mouse hippocampus. Distributions (marginals) of the number of UMIs (x axis) and genes (y axis) from inCITE-seq (left), matching mouse hippocampus snRNA-seq in this study (middle), and previously published snRNA-seq (right). Scatter plot shows the density of individual nuclei (dots) calculated with a Gaussian kernel estimate. b,c. Major cell types from the adult mouse hippocampus identified from inCITE-seq RNA profiles alone. b. UMAP embedding of 24,444 single nucleus inCITE-seq RNA profiles (dots) colored by annotated cluster (number). c. Expression of marker genes (columns) used for annotating cell type clusters (rows), showing mean expression of log normalized counts (dot color) and proportion of expressing cells (dot size). d-j. Enhanced cell type distinctions and annotation by combining RNA profiles from inCITE-seq and snRNA-seq. Joint UMAP embedding of 22,260 inCITE-seq and 15,507 snRNA-seq RNA profiles (dots) colored by unsupervised leiden clusters or subcluster of leiden group 4 (numbers) (Methods). e. Distribution of mitochondrial fraction of total gene content (y axis, left) and total transcript counts (y axis, right) in each leiden cluster or subcluster of leiden group 4 (x axis, both). Asterisks indicate cluster 15 (n=327 nuclei) and subcluster 4,3 (n=179 nuclei) that were removed for high mitochondrial content and for low RNA complexity, respectively. f-h. UMAP embedding as in Fig. 2d colored by doublets that were removed from subsequent analyses (n=3,059 doublets, (f)), batch and assay (g), or condition (h). i. Percent of nuclei (y axis) from each batch/assay (color) in each cluster (x axis). j. Mean expression of log normalized counts (dot color) and proportion of expressing cells (dot size) of marker genes (columns) used for annotating cell type clusters in d (rows).
Extended Data Fig. 6
Extended Data Fig. 6. Protein levels by inCITE-seq batch (replicate).
a-d. Distribution of protein levels (x axis, nCLR) shown as kernel density estimates of NeuN (a), PU.1 (b), p65 (c), or c-Fos (d) in each batch (top: batch 1; bottom: batch 2) in biologically relevant subsets as foreground (color) and appropriate background set of nuclei (grey). Dashed line: Batch-specific threshold used to partition protein level as high vs. low. e-i. Density distribution of (e) nucleus hashtag counts (x axis, HTOs) or (f-i) antibody-derived tags (x axis, ADTs) of inCITE target proteins, colored by batch (batch 1, gray; batch 2, blue).
Extended Data Fig. 7
Extended Data Fig. 7. Protein effects on global gene expression.
a. Relation between unspliced pre-mRNA expression of Rbfox3 and nuclear protein levels of NeuN. Distribution of pre-mRNA levels (Z score of log-normalized counts, y axis) in nuclei with high or low levels of NeuN (x axis) after PBS (gray) or KA (green) treatment (NeuN thresholds in Extended Data Fig. 6). Boxplots show the median (centre line), box bounds represent first and third quartiles, and whiskers span from each quartile to the minimum or the maximum (1.5 interquartile range below 25% or above 75% quartiles). Dots correspond to 227 individual nuclei with non-zero pre-mRNA levels measured across n=2 biologically independent samples. Significance, from left: P=5*10−15, P=9*10−5 two-sided Mann-Whitney test. NS – not significant. b. Functional gene sets enriched in TF associated genes. Enrichment (−log10(P-value), x axis, hypergeometric test) of Gene Ontology (GO) terms (y axis) in genes significantly associated (from top to bottom) with p65 (33 genes), PU.1 (13 genes), and c-Fos (10 genes). c. Genes associated with NeuN. Effect size (x axis) and associated significance (y axis, −log10(P-value)) for the association of each gene (dots) with NeuN by a model of gene expression as a linear combination of the four inCITE-seq target proteins after regressing out treatment and cell type (Methods). Select genes are labeled. Colored dots: Benjamini-Hochberg FDR <5%.
Extended Data Fig. 8
Extended Data Fig. 8. Genes and modules associated with TFs within excitatory (EX) neurons.
a. Genes associated with protein-protein pairs in the interaction model, identified by modeling gene expression across excitatory neurons as a linear combination of individual proteins and their pairwise interactions after regressing out treatment. Effect size (x axis) and significance (y axis, −log10(P-value)) for DEGs (dots) associated with each protein-protein interaction term: p65 and c-Fos (left), c-Fos and NeuN (middle), and p65 and NeuN (right). Select genes are labeled. Colored dots: Benjamini-Hochberg FDR<5%. b. Pearson correlation coefficient (red/blue colorbar) of pairwise gene expression profiles (rows and columns) significantly (FDR<5%) associated positively (purple) or negatively (green), with c-Fos (additive model), p65 (additive model), or c-Fos*p65 (interaction model), ordered by hierarchical clustering. Top bars: Effect size of each protein or protein-protein pair. c. Treatment effect on gene programs. Program scores (y axis) for 5 EX programs (in Fig. 4f) of 15,226 individual nuclei (dots) from PBS or KA treated mice (x axis) measured across 2 biologically independent experiments. Boxplots show the median (centre line), box bounds represent first and third quartiles, and whiskers span from each quartile to the minimum or the maximum (1.5 interquartile range below 25% or above 75% quartiles). Significance, from left: P=0.049, P=2.7*10−271, P=2.2*10−199, P=6.1*10−7, two-sided Mann-Whitney test. NS – not significant.
Extended Data Fig. 9
Extended Data Fig. 9. Treatment-dependent cis-regulatory elements and TF-associated genes.
a-c. Prediction of co-regulatory patterns by TF motif enrichment in DEGs associated with c-Fos or p65 (additive model), or their interaction c-Fos*p65 (interaction model). a,b. Significance (−log10(P-value), y axis) and rank order (x axis) of TF motifs (dots) enriched in enhancers of DEGs associated with each protein (additive model) or protein-protein (interaction model) term in excitatory neurons, using enhancers of PBS (a) or KA (b) treated sample as background. Black: significant motifs (P<10−3, hypergeometric test); gray: not significant. c. TF motif enrichment (columns; dot size, −log10(P-value)) and proportion of excitatory neuron nuclei expressing the RNA (color) of significant TFs (rows) in the enhancers of c-Fos (additive model), p65 (additive model), or c-Fos*p65 (interaction model) DEGs, compared to other enhancers within the KA treated sample. d. Treatment-dependence of gene association with c-Fos and p65. Global effect size of genes (dots) associated with c-Fos (left) and p65 (right), after PBS (x axis) or KA treatment (y axis) (Methods). Colored dots: genes with significant coefficients (Benjamini-Hochberg FDR<5%) in PBS (gray), KA (green), or both (black). Select genes are labeled. Bottom right: linear correlation R2 and associated P value (two-sided t-test).
Figure 1.
Figure 1.. InCITE-seq simultaneously measures intranuclear protein and RNA levels at single nucleus resolution.
a. Overview of inCITE-seq for droplet-based profiling of nuclear proteins with nucleus hashing in HeLa cells. b. In situ fluorescent images of HeLa cells expressing a p65-mNeonGreen reporter (p65mNGreen) stained with anti-p65 antibody (p65Ab followed by Alexa Fluor 657 conjugated secondary), sampled without treatment (no treatment, “NT”; top) or 40 min after TNFα treatment (bottom); representative of 4 independently conducted experiments. Scale bar, 100μm. c. Flow cytometry of HeLa nuclei stained with p65inCITE-Ab followed by Alexa Fluor 647 secondary (x axis) sampled from NT (blue) or 40 min after TNFα treatment (red). Buffers, from top to bottom: optimized inCITE buffer with dextran sulfate, commercial buffer #1, commercial buffer #2 (Methods). d. Distribution of p65 levels (nCLRs) in NT (blue) and TNFα treated (red) nuclei profiled by inCITE-seq (P=4*10−9, two-sided Kolmogorov-Smirnov test). e. Expression (Z score, color bar) of the top 7 genes (rows) positively associated with p65 levels identified by a linear model (top, Methods) across nuclei (columns), visualized for the top decile (p65high) and bottom decile (p65low) of p65 nuclear protein levels by inCITE-seq (bar plot, top, nCLR). f. Top 10 Gene Ontology terms (y axis) significantly enriched (−log10(P-value), x axis, hypergeometric test) in 142 genes positively associated with p65 levels.
Figure 2.
Figure 2.. In vivo application of inCITE-seq shows cell type-specific protein expression in the mouse hippocampus.
a. InCITE-seq of the mouse hippocampus after kainic acid or PBS (control) treatment, with nucleus hashing. b. Cell types from the adult mouse hippocampus identified by joint embedding of inCITE-seq and snRNA-seq. UMAP embedding of single nucleus RNA profiles from two batches of inCITE-seq (n=22,260) and two snRNA-seq experiments (this study and Habib et al., n=15,507) of the mouse hippocampus, after regressing out treatment and batch (Methods), colored by cluster and annotated post hoc (color legend). “Ex”: excitatory neurons clusters. c. Integration of inCITE-seq and snRNA-seq profiles. UMAP embedding as in (b), colored by assay type (inCITE-seq, blue; snRNA-seq, pink). d,g. UMAP embeddings as in (b), but showing only inCITE-seq nuclei profiles colored by protein levels (nADT) for NeuN (d, 5th to 95th percentile) and p65 (g, color scale from 2th to 98th percentile). e,f,h. Distribution of protein levels (nCLR, x axis) for NeuN in neuronal (blue) and non-neuronal (gray) nuclei (e; P=0.005, two-sided KS test), PU.1 in microglial (turquoise) and neuronal (gray) nuclei (f; P=10−5, two-sided KS test), and p65 in endothelial (fuchsia) and neuronal (gray) nuclei (h; P=1.1*10−15, two-sided KS test), from one batch. Curve: kernel density estimate. i. Immunofluorescence stain of the hippocampus with endothelial marker CD31 (green), NeuN (blue), p65 (pink), and DAPI (white); representative of 3 independently conducted experiments. Yellow arrowheads: co-localization of CD31 and p65. Green arrowheads: lowly expressed p65 in neurons. Scale bar, 50μm.
Figure 3.
Figure 3.. InCITE-seq measures changes in nuclear TF levels after stimulation of the mouse hippocampus.
a. UMAP embedding of inCITE-seq nuclei (as in Fig. 2b) colored by c-Fos protein levels (nADT, color scale from 5th to 95th percentile). Distribution of c-Fos (b,c) or p65 (d) protein levels (nCLR, x axis) shown as a kernel density estimate in neurons of KA vs. PBS treated mice (b, P=10−15, two-sided KS test), in granule cells (GC) vs. cornu ammonis (CA) neurons in KA treated mice (c, P=1.7*10−7, two-sided KS test), or in neurons of KA vs. PBS treated mice (d, not significant; P=0.15 two-sided KS test). e,f,g. Immunofluorescence stain of the hippocampus after PBS (gray border) or KA (green border) treatment; representative of 3 independent experiments. Major hippocampal features denoted: dentate gyrus (DG), cornu ammonis (CA). e. Stain of c-Fos (red), NeuN (green), and DAPI (blue). Left: scale bar, 600μm. Right: close-up of the DG (dashed box) shows heterogeneity in c-Fos intensity; scale bar, 100μm. f. Stain of SST (red), c-Fos (green), and DAPI (blue). Left: scale bar, 100μm. Right: close-up of the DG (dashed area box); scale bar, 30μm. g. Immunofluorescence stains of p65 (red), NeuN (green), and DAPI (blue), PBS or KA treatment. Left: all stains. Right: p65 stain. Scale bar, 100μm. h. Distribution of mRNA levels (Z score of log-normalized counts, y axis) in nuclei with high or low levels (defined in Extended Data Fig. 6) of the encoded protein (x axis) under PBS (gray) or KA (green) treatment. Boxplot: centre line indicates median, box bounds represent first and third quartiles, whiskers span from each quartile to the minimum or the maximum (1.5 interquartile range below 25% or above 75% quartiles). Dots: nuclei with non-zero mRNA levels measured across n=2 biologically independent samples, with 1,696 nuclei, 214 nuclei, and 653 nuclei shown for Fos, Rela, and Rbfox3, respectively. Significance, from bottom-left to top-right: P=2*10−6, P=9*10−5, P=4*10−6, P=9.7*10−3, two-sided Mann-Whitney test. NS – not significant.
Figure 4.
Figure 4.. Inferring TF effects on gene and module expression using joint protein and transcriptome measurements.
a-c. Global association of TFs to genes. Significance (y axis, −log10(P-value)) and effect size (x axis) for genes (dots) associated with p65 (a), PU.1 (b), and c-Fos (c) protein levels across all nuclei, by a model of gene expression as a linear combination of TFs/proteins. Colored dots: Benjamini-Hochberg FDR<5%; select genes labeled. d. Genes associated with each TF within excitatory neurons (EX). Volcano plot axes for c-Fos (left) or p65 (right) are the same as in (a-c). Colored dots: Benjamini-Hochberg FDR<5%; select genes labeled. e. Pearson correlation coefficient (red/blue colorbar) of pairwise gene expression across excitatory neurons (rows and columns), for genes that are positively (purple) or negatively (green) associated with c-Fos or p65, ordered by hierarchical clustering. Top bars: Effect size of each protein. Black boxes: co-expression modules. Red asterisk: DEGs associated with c-Fos*p65 in the interaction model (see Extended Data Fig. 8b). f. NMF programs of excitatory neurons. Right: UMAP embedding of the excitatory neuron subset (as in Fig. 2b), colored by the NMF program score. Left: Top 10 program genes (y axis) and their Pearson correlation with program scores (x axis). g. Pearson correlation coefficient (red/blue colorbar) of pairwise gene expression across EX neurons (rows and columns) using the top 10 genes of each program, ordered by hierarchical clustering. Top bars (purple/green): significant effect sizes of each protein from the linear model. h. Significance (−log10(P-value), y axis) and rank order (x axis) of TF motifs (dots) in enhancers of c-Fos DEGs in excitatory neurons. Black: significant motifs (P<10−3, hypergeometric test); Gray: not significant. i. Enriched TF motifs (columns; dot size, −log10(P-value)) and their corresponding RNA expression in EX neurons (dot color), identified in the enhancers of DEGs associated with each of the following (rows): c-Fos (additive model), p65 (additive model), or c-Fos*p65 (interaction model). j. Cell type-specific DEGs of c-Fos or p65 after KA treatment. Effect size (y axis) of c-Fos (top) or p65 (bottom), sorted by rank order (x axis), in select cell types (top). Color: significant genes (Benjamini-Hochberg FDR<5%).

References

    1. Habib N et al. Div-Seq: Single-nucleus RNA-Seq reveals dynamics of rare adult newborn neurons. Science 353, 925–928 (2016). - PMC - PubMed
    1. Habib N et al. Massively parallel single-nucleus RNA-seq with DroNc-seq. Nat. Methods 14, 955–958 (2017). - PMC - PubMed
    1. Slyper M et al. A single-cell and single-nucleus RNA-Seq toolbox for fresh and frozen human tumors. Nat. Med 26, 792–802 (2020). - PMC - PubMed
    1. Lacar B et al. Nuclear RNA-seq of single neurons reveals molecular signatures of activation. Nat. Commun 7, 11022 (2016). - PMC - PubMed
    1. van den Brink SC et al. Single-cell sequencing reveals dissociation-induced gene expression in tissue subpopulations. Nat. Methods 14, 935–936 (2017). - PubMed

Publication types