. 2021 Oct;18(10):1196-1203.
doi: 10.1038/s41592-021-01252-x. Epub 2021 Oct 4.

Effective gene expression prediction from sequence by integrating long-range interactions

Affiliations

Effective gene expression prediction from sequence by integrating long-range interactions

Žiga Avsec et al. Nat Methods. 2021 Oct.

Abstract

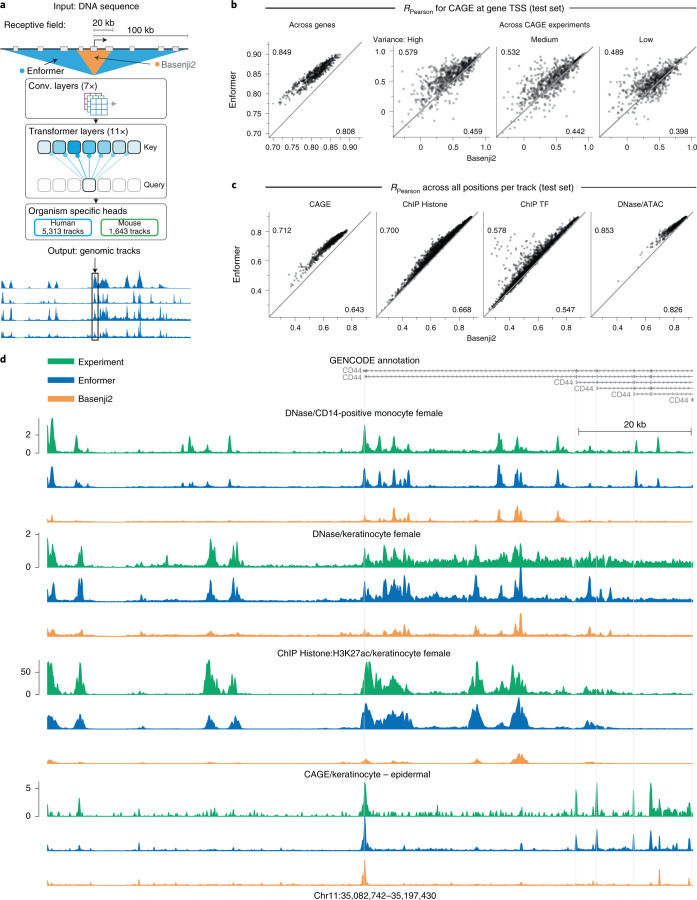
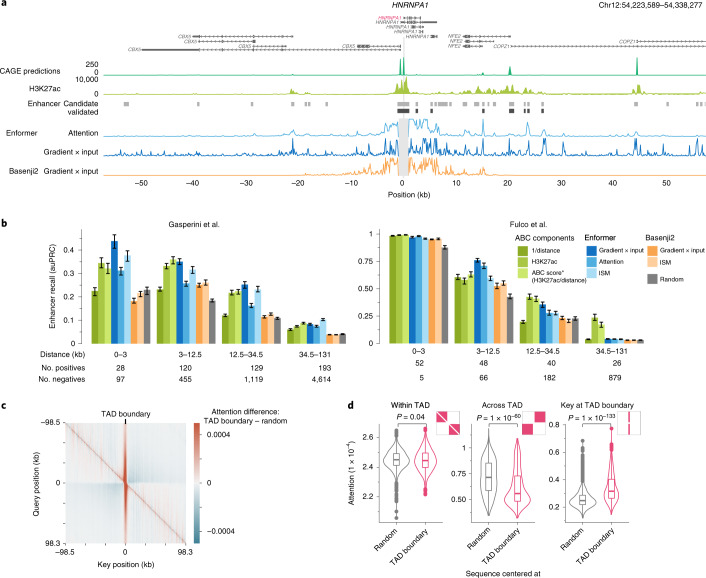
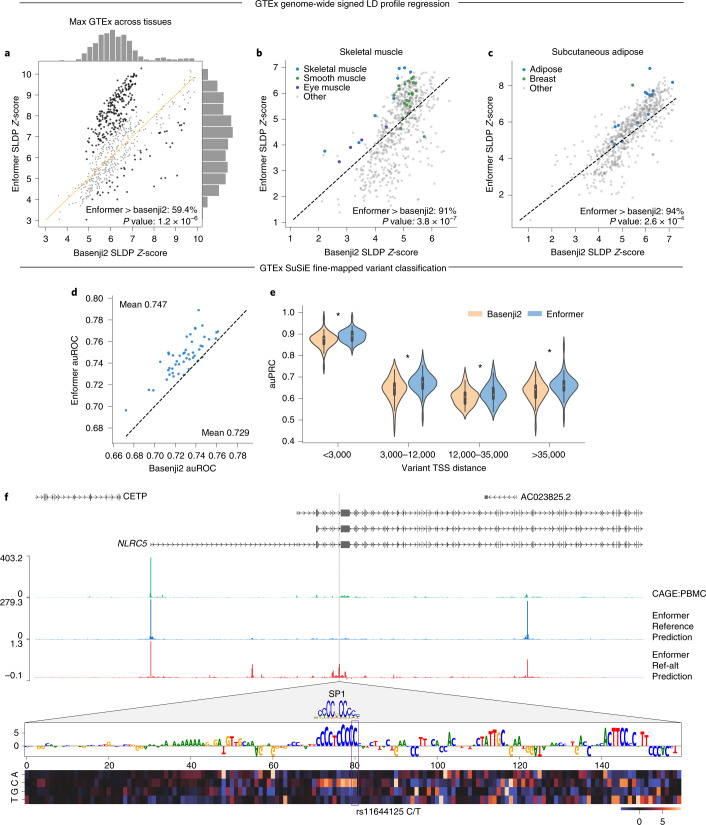
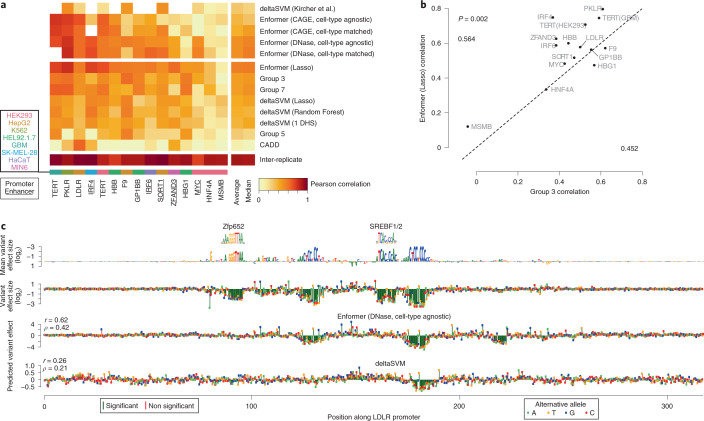
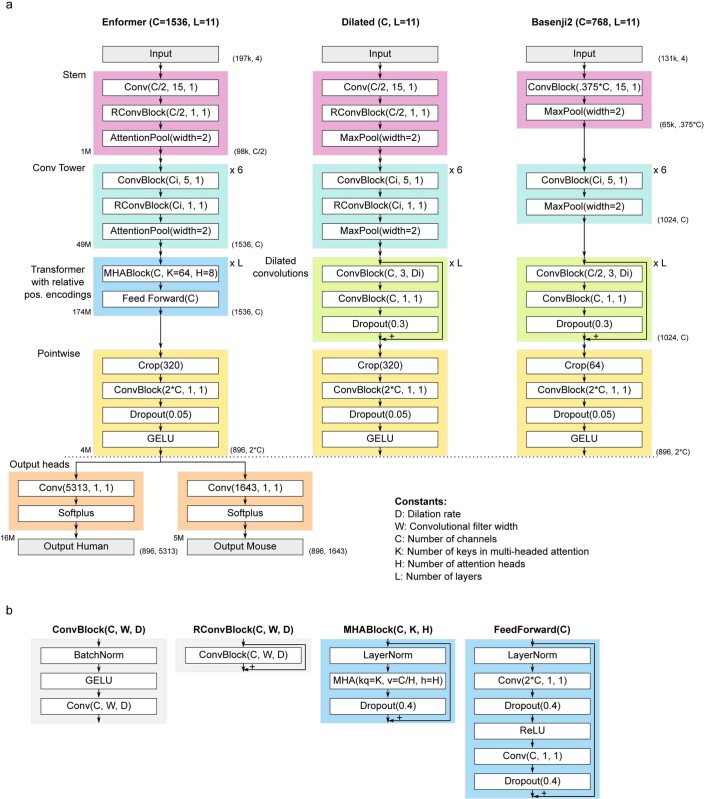
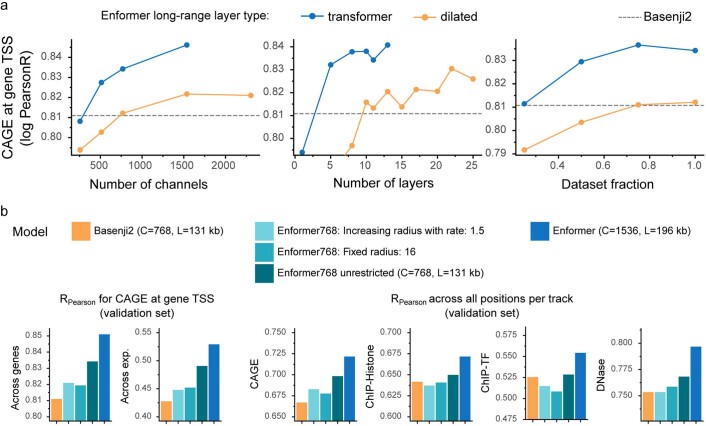
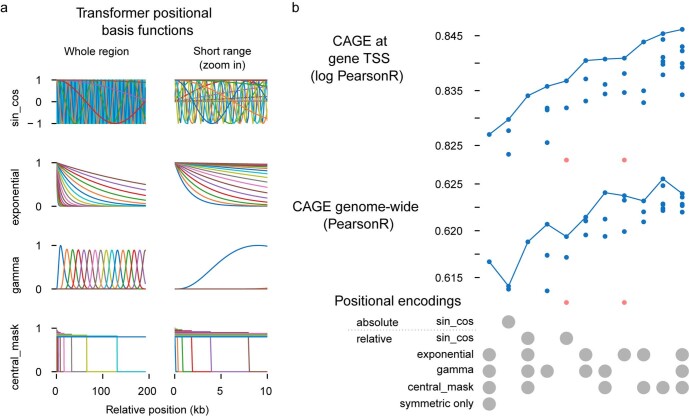
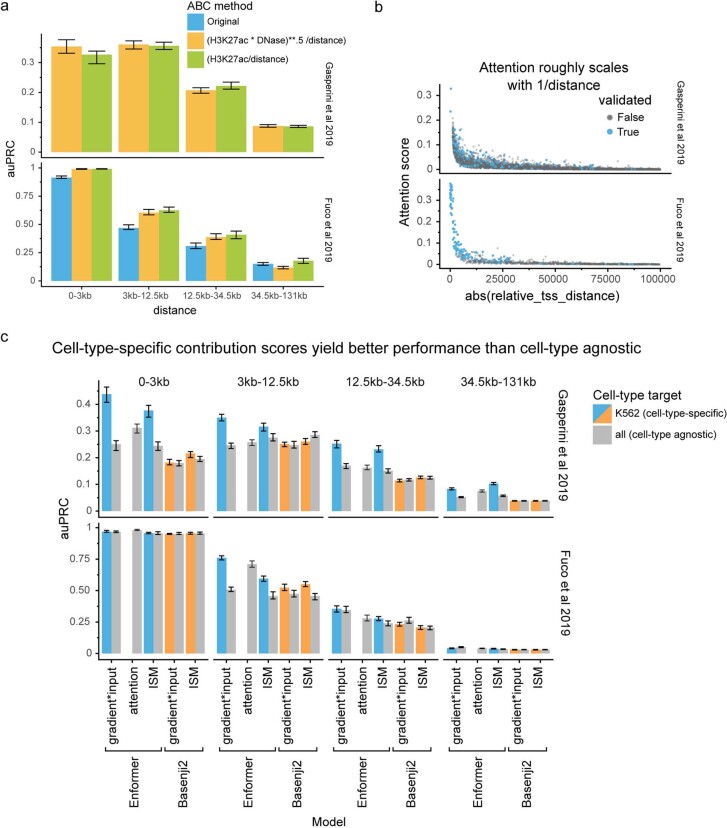
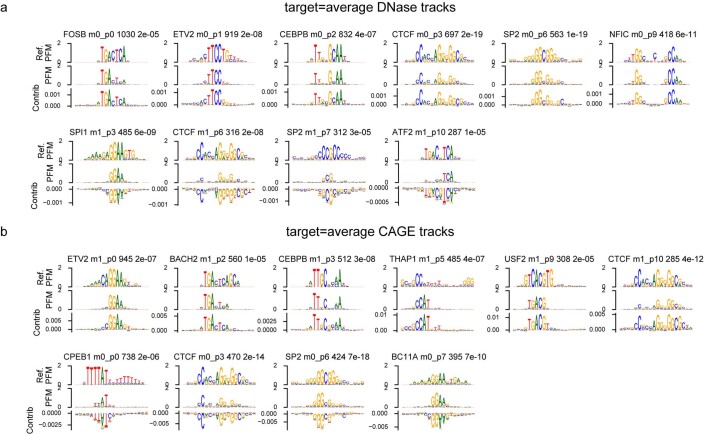
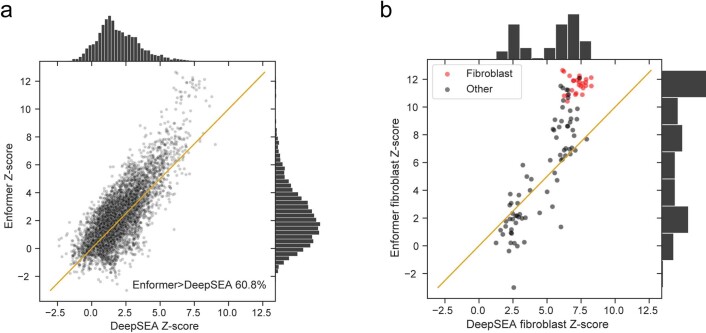
How noncoding DNA determines gene expression in different cell types is a major unsolved problem, and critical downstream applications in human genetics depend on improved solutions. Here, we report substantially improved gene expression prediction accuracy from DNA sequences through the use of a deep learning architecture, called Enformer, that is able to integrate information from long-range interactions (up to 100 kb away) in the genome. This improvement yielded more accurate variant effect predictions on gene expression for both natural genetic variants and saturation mutagenesis measured by massively parallel reporter assays. Furthermore, Enformer learned to predict enhancer-promoter interactions directly from the DNA sequence competitively with methods that take direct experimental data as input. We expect that these advances will enable more effective fine-mapping of human disease associations and provide a framework to interpret cis-regulatory evolution.


Conflict of interest statement

Ž.A., A.G-B., K.R.T., Y.A., J.J., and P.K. are employed by DeepMind. V.A., and D.R.K. are employed by Calico Life Sciences. J.R.L. is employed by Google. The remaining authors declare no competing interests.

Figures

Fig. 1
Fig. 1. Enformer improves gene expression prediction in held-out genes by using a larger receptive field.
a, Enformer is trained to predict human and mouse genomic tracks at 128-bp resolution from 200 kb of input DNA sequence. By using transformer modules instead of dilated convolutions, it achieves a five times larger receptive field able to detect sequence elements 100 kb away, compared with 20 kb for Basenji2 (ref. ) or ExPecto (Extended Data Fig. 1). b, Enformer outperforms Basenji2 in gene expression prediction from sequence both across genes and across CAGE experiments for protein-coding genes. Test set performance was measured by Pearson correlation of CAGE gene expression (log(1 + x) transformed) computed across genes for each CAGE experiment (left) or across CAGE experiments for each test gene stratified by the observed expression variance across experiments (right). Average performance for each model is shown in the corners. Bootstrapped s.d. of these estimates is 0.004 for ‘Across genes’. Gene expression values were obtained by summing up the observed or predicted CAGE read counts at all unique TSS locations of the gene. Values for each CAGE experiment were standardized to have zero mean and variance of 1 across genes. c, Enformer consistently outperforms Basenji2 across all 4 assay types (columns) as measured by Pearson correlation computed across all 128-bp binned genomic positions in the human test set for 5,313 predicted tracks (points). Both models were trained and evaluated on the same dataset. Enformer performance was significantly higher across all plots in b and c) (paired Wilcoxon P < 10−38). d, Representative example of observed and predicted genomic tracks (log10 scale) at CD44 gene locus located in the test-set region with high disagreement between Enformer and Basenji2 predictions (Methods). For each experiment, all three tracks share the same y axis.
Fig. 2
Fig. 2. Enformer attends to cell-type-specific enhancers, enabling enhancer prioritization.
a, HNRNPA1 locus showing: predicted CAGE expression in K562; measured H3K27ac highlighting active enhancers; candidate (light gray) and CRISPRi-validated enhancers (dark gray) exhibiting significant HNRNPA1 expression changes from Fulco et al.; enformer attention weight averaged across all layers and heads for a query placed at the main TSS of HNRNPA1 gene (position 0); and gradient × input contribution scores computed with regard to the K562 CAGE track at the main TSS position for Enformer and Basenji2. b, Enhancer–gene pair classification performance (CRISPRi-validated versus nonvalidated candidate enhancers), stratified by relative distance, as measured by auPRC on two CRISPRi datasets, for different methods, models, and contribution scores (Methods). ABC score* (H3K27ac/distance) denotes the approximate version of the ABC score lacking Hi-C data, which exhibits similar performance (Extended Data Fig. 7a). Colored bars depict the median auPRC, and error bars show the 25th and 75th percentiles obtained by sampling 80% of enhancer–gene pairs 100 times without replacement. The auPRC metric is sensitive to class imbalance, which differs between the two datasets (1:10 for Gasperini and 1:4 for Fulco). c, Average attention matrix difference of Enformer between 1,500 sequences centered at a topologically associating domain (TAD) boundary and 1,500 sequences from the validation set without any particular centering. Attention matrices were averaged across all layers, heads, and sequences. Red stripe in the center at key = 0 means that the model is attending more to the TAD boundary than by chance. Blue regions in off-diagonal quadrants mean that the model is attending less across the TAD boundary. d, Attention is significantly lower across TAD boundaries (center), significantly higher at TAD boundaries (right), and shows no significant difference within them (left), as compared with 1,500 random genomic sequences. Distributions show attention across all sequences in specific attention matrix parts shown in red. P values were computed with the two-sided Mann–Whitney U test. The box plots mark the median, upper and lower quartiles, and 1.5× interquartile range (whiskers); outliers are shown as points (n = 1,500 for each violin plot).
Fig. 3
Fig. 3. Enformer improves variant effect prediction on eQTL data as measured by SLDP regression and fine-mapped variant classification.
a, We computed genome-wide statistical concordance between variant effect predictions for individual CAGE datasets and GTEx eQTL summary statistics using SLDP across all variants in the 1000 Genomes dataset. Taking the GTEx tissue with max Z-score for each sample, Enformer predictions achieved greater Z-scores for 59.4% of samples, and 228 are greater by more than one s.d. (versus 46 for Basenji2). Each point represents one of the 638 CAGE samples. We used one-sided Binomial tests to compute the P values in the top row panels. b,c, Studying SLDP in skeletal muscle (b) and subcutaneous adipose (c) GTEx tissues indicated that biologically relevant CAGE datasets (shown in blue) improve between Basenji2 and Enformer. d, We trained random forest classifiers to discriminate between fine-mapped GTEx eQTLs and matched negative variants in each of 48 tissues (Methods). Features derived from Enformer enabled more accurate classifiers than Basenji2 features for 47 of 48 tissues. e, We computed auPRC for variants in four roughly equally sized TSS distance bins. Violin plots represent measures for the n = 48 tissues (white dots represent the median, thick bars the interquartile range, and thin bars the entire data range). Enformer improved accuracy at all distances (one-sided paired Wilcoxon P < 1 × 10⁻⁴). f, Enformer prediction for rs11644125 improved relative to Basenji2 (data not shown) by better capturing its influence on an NLRC5 TSS ~35 kb upstream. rs11644125 is associated with monocyte and lymphocyte counts in the UK BioBank and fine-mapped to >0.99 causal probability. In silico mutagenesis of the region surrounding rs11644125 revealed an affected SP1 transcription factor motif.
Fig. 4
Fig. 4. Enformer improves noncoding variant effect prediction as measured by saturation mutagenesis experiments.
a, Correlation of variant effect predictions with experimental values, as measured by saturation mutagenesis MPRAs, on test sets for 15 loci curated for the CAGI5 competition. Shown above the horizontal break is the performance of five methods that required no additional fine-tuning on each locus; shown below is that of eight methods that were additionally trained on the CAGI5 training sets. b, Pearson correlations of each locus for predictions derived from the Enformer versus the winning team of the CAGI5 competition. Average performance for each model is shown in the corners. Enformer shows a significant performance improvement (P = 0.002, paired, one-sided Mann–Whitney U test). c, Example saturation mutagenesis data from the LDLR promoter locus. Shown in the top row is the reference sequence scaled to the mean effect size among all alternative mutations, with measured effect sizes of individual variants in the second row. Two of the four significant elements match known motifs, and the two unknown motifs partially resemble the SP1 binding motif. Shown in the bottom two rows are the predictions on the full dataset using methods from a that required no additional fine-tuning.
Extended Data Fig. 1
Extended Data Fig. 1. Enformer model architecture and comparison to Basenji2.
a) From left to right: Enformer model architecture, ‘dilated’ architecture used in ablation studies obtained by replacing the transformer part of the model with dilated convolutions, and Basenji22. Output shapes (without batch dimensions) are shown as tuples on the right side of the blocks. The number of trainable parameters for different parts of Enformer are shown on the left side of the blocks. The two main hyperparameters of the model are the number of transformer/dilated layers, L, and the number of channels, C. All models have the same two output heads as shown on the Enformer at the bottom. The number of channels in the convolutional tower Ci was increased by a constant multiplication factor to reach C channels starting from C/2 (or 0.375*C for Basenji2) in 6 layers. For dilated layers, we increased the dilation rate Di by a factor of 1.5 at every layer (rounded to the nearest integer). b) Definition of different network blocks in terms of basic neural network layers. MHA denotes multi-headed attention using relative positional encodings with kq representing the number of key/query size, v representing the value size and h the number of heads. Number of relative positional basis functions is equal to value size v.
Extended Data Fig. 2
Extended Data Fig. 2. Replicate level accuracy.
a) Gene expression correlation (log(1+x) pearsonR) for each CAGE track across protein-coding genes comparing experimental-level accuracy computed in two ways (estimated and direct) to Enformer. For ‘Replicates direct’, CAGE replicate experiments were partitioned into two groups and compared against each other. For ‘Replicates estimated‘, a predictive model was used to impute CAGE values of a particular track from all other tracks.
Extended Data Fig. 3
Extended Data Fig. 3. Predictive performance for treated samples.
a) Groups of CAGE experiments where the biological samples were perturbed in different ways. b) Observed and predicted gene expression matrices (log(1+x) transformed) for CD14+ monocytes and genes in the held-out test set. The most prominent change in gene expression due to the lipopolysaccharide treatment was also captured by the Enformer model. Observed matrix was hierarchically clustered for both rows and columns. Enformer predicted heatmap follows the same row and column ordering as the observed matrix. c) Predictive performance in the test set for CAGE gene expression fold change for all within-group pairs from a (y-axis) compared to the observed gene expression correlation between two pairs (x-axis). Fold change of highly correlated CAGE samples is more difficult to predict. d) Enformer shows higher fold-change predictive performance compared to Basenji2.
Extended Data Fig. 4
Extended Data Fig. 4. Enformer predicts mRNA-seq more accurately than ExPecto.
a) Test set predictive performance comparison of a linear model trained on top of Enformer CAGE predictions from the major TSS (y-axis) and ExPecto (x-axis) computed either across genes (first column) or across tissues (second column). Gene expression matrix was normalized across genes to have zero mean and unit variance for each tissue. Enformer was re-trained only on the human genome using the same training chromosomes for this comparison (Methods). b) Same as a), but using Enformer predictions averaged across all TSS of the gene. c) Observed versus Enformer-predicted gene expression values for all 990 test genes in 6 RNA-seq samples.
Extended Data Fig. 5
Extended Data Fig. 5. Comparison to dilated convolutions.
a) Enformer with original transformer layers (Extended Data Fig. 1a left) performs better than Enformer with dilated convolutions (Extended Data Fig. 1a center) across different model sizes and training dataset subsets as measured CAGE gene expression correlation in the validation set (same metric as in Fig. 1b across genes). At 15 dilated layers, the model starts to reach outside of the input sequence range (receptive field of 224,263 bp). Note that all the evaluations here are limited by TPU memory preventing you from using more layers or channels. b) Performance comparison to Basenji2 (left) and Enformer (right) to Enformer with the same receptive field (44 kb) as Basenji2 by either allowing a fixed attention radius of 16 across all layers where query can attend to at most 16 positions away (Enformer 769: Fixed radius: 16) or by exponentially increasing the respective field in the same way as the dilation rate in Basenji2. Enformer768 was trained with the same number of 768 channels and 131 kb input sequences as Basenji2, whereas Enformer uses two times more channels and 1.5 times longer sequence. Same evaluation metrics are shown as in Fig. 1.
Extended Data Fig. 6
Extended Data Fig. 6. Custom relative positional encoding functions are required for good predictive performance.
a) Relative positional encoding basis function options for the transformer model. Sine/cosine basis functions are frequently used in the NLP literature for both absolute or relative positional encodings. Enformer uses a concatenation of exponential, gamma and central_mask relative positional encodings. For each basis function, a symmetric f(|x|) and asymmetric sign(x) * f(|x|) basis function will be used to introduce directionality and thereby inform the model of what is upstream or downstream of the TSS. Each basis function is visualized with a different color. b) Validation set performance as measured by CAGE gene expression correlation across protein coding genes (top; same metric as in Fig. 1b across genes) or across all positions (bottom; same metric as displayed in Fig. 1c CAGE) for models trained with different classes of positional encoding functions in the transformer. Custom relative positional encodings show better performance than using standard sin/cos basis functions or using absolute positional encodings, likely because they can better capture the decreasing importance of enhancers with increased distance. Also, symmetric only (f(|x|) version shows much lower performance than using both, symmetric and asymmetric versions. All models use the same 96 total number of basis functions. Each positional encoding configuration was trained with multiple different random seeds. Red points denote runs with lower performance than the y-axis limits.
Extended Data Fig. 7
Extended Data Fig. 7. Tissue-specific contribution scores are required for good enhancer-recall performance.
a) Enhancer–gene ranking performance comparison of different ABC score versions, including the original score which uses DNase, H3K27ac, and Hi-C data. H3K27ac / distance is a good if not even slightly better proxy for the ABC score. The alternative versions use a fixed and 2 kb wide aggregation window whereas the original uses a dynamic peak width depending on the DNase peak width. b) Attention-based contribution score as a function of distance at all enhancer–gene pairs in both studied datasets. c) Contribution scores that are cell-type-specific (shown in green, achieved by computing the contribution scores w.r.t. cell-type-specific target variables) outperform cell-type agnostic contribution scores (shown in orange). Colored bars in a and c depict the median auPRC with error bars at the 25th and 75th percentile obtained by sampling 80% of enhancer–gene pairs 100 times without replacement.
Extended Data Fig. 8
Extended Data Fig. 8. TF-MoDISco motifs at TAD boundaries.
a,b) Motifs obtained by TF-MoDISco from gradient × input DNase (a) or CAGE (b) contribution scores at 1,500 TAD boundaries. Motif title contains: TF name of the closest motif match from HOCOMOCO v11 database, metacluster and pattern id returned by TF-MoDISco, number of seqlets supporting the motifs, and Tomtom q-value for the closest motif match (lower means better match). For each motif, the information content of the position frequency matrix (PFM) is visualized for the database motif in the top row and for the actual TF-MoDISco motif in the second row. Third row for each motif shows the contribution weight matrix (CWM)15,47 which can be negative. Shown are the top 6 motifs for each contribution score sign with sufficiently close match to a known motif (q-value<1e-5) and support from at least 200 seqlets. Interestingly, the CTCF motif was discovered for both CAGE and DNase in both contribution score signs, suggesting that it can influence them in a positive or negative manner.
Extended Data Fig. 9
Extended Data Fig. 9. Enformer achieves greater and more specific SLDP concordance to GTEx than DeepSEA.
To compare Enformer and DeepSEA Beluga (convolutional neural network used in ExPecto) variant effect predictions, we manually matched DNase datasets that both models were trained on, finding 100 confident matches. We computed genome-wide statistical concordance between variant effect predictions for these DNase datasets and GTEx eQTL summary statistics using SLDP across all variants in the 1000 genomes dataset. a) We scatter plotted all DNase sample and GTEx tissue z-scores for the DeepSEA and Enformer predictions, observing that the Enformer scores are greater for 60.8%. Each point corresponds to (DNase sample, GTEx tissue) pair. Only some (DNase sample, GTEx tissue) pairs are biologically well-matched, while the majority are. b) Since many DNase samples profile fibroblasts we specifically plotted all DNase sample z-scores for the GTEx fibroblast summary statistics. We colored the DNase fibroblast samples in red, revealing that they are the highest scoring and most improved in the Enformer model relative to DeepSEA. This suggests that Enformer variant effect predictions are more tissue specific, since one would expect to obtain the highest Z-score for these matched samples shown in red.
Extended Data Fig. 10
Extended Data Fig. 10. Enformer outperforms Basenji2 on eQTL sign prediction.
For each of the GTEx tissues, we manually matched FANTOM5 CAGE sample descriptions to choose a single matched dataset (Methods). We then arranged a classification task to discriminate between fine-mapped causal eQTLs in which the minor allele increases gene expression versus eQTLs in which the minor allele decreases gene expression. We computed auROC statistics by ranking causal variants by their signed prediction for the corresponding sample. To consider the influence of variant distance to TSS, we compute auROC in four bins of roughly equal size. Across tissues and TSS distances, Enformer predictions usually achieve more accurate classification of eQTL sign than Basenji2 predictions. We display six example tissues with large numbers of fine-mapped eQTLs and with clear correspondence between CAGE and GTEx tissues. Violin plots show the auROC distribution of 100 bootstrap samples from the full set of variants. (The white dot represents the median, the thick gray bar in the center represents the 25%-75% percentile range and the thin line represents the entire data range.) Dashed lines represent the mean auROC over all distances. Both models struggle with variants beyond the promoter (TSS distance > 1,000), highlighting an important problem for future research.

Comment in

References

    1. Zhou J, et al. Deep learning sequence-based ab initio prediction of variant effects on expression and disease risk. Nat. Genet. 2018;50:1171–1179. doi: 10.1038/s41588-018-0160-6. - DOI - PMC - PubMed
    1. Kelley DR. Cross-species regulatory sequence activity prediction. PLoS Comput. Biol. 2020;16:e1008050. doi: 10.1371/journal.pcbi.1008050. - DOI - PMC - PubMed
    1. Kelley DR, et al. Sequential regulatory activity prediction across chromosomes with convolutional neural networks. Genome Res. 2018;28:739–750. doi: 10.1101/gr.227819.117. - DOI - PMC - PubMed
    1. Agarwal V, Shendure J. Predicting mRNA abundance directly from genomic sequence using deep convolutional neural networks. Cell Rep. 2020;31:107663. doi: 10.1016/j.celrep.2020.107663. - DOI - PubMed
    1. Gasperini M, Tome JM, Shendure J. Towards a comprehensive catalogue of validated and target-linked human enhancers. Nat. Rev. Genet. 2020;21:292–310. doi: 10.1038/s41576-019-0209-0. - DOI - PMC - PubMed