

Spatiotemporal patterns of the COVID-19 control measures impact on industrial production in Wuhan using time-series earth observation data
- PMID: 34608429
- PMCID: PMC8482229
- DOI: 10.1016/j.scs.2021.103388
Spatiotemporal patterns of the COVID-19 control measures impact on industrial production in Wuhan using time-series earth observation data
Abstract
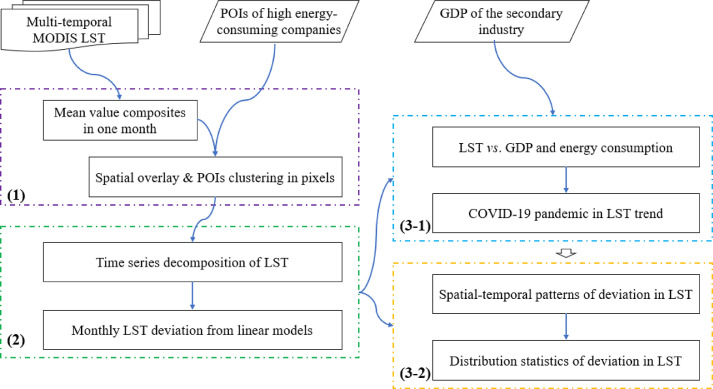
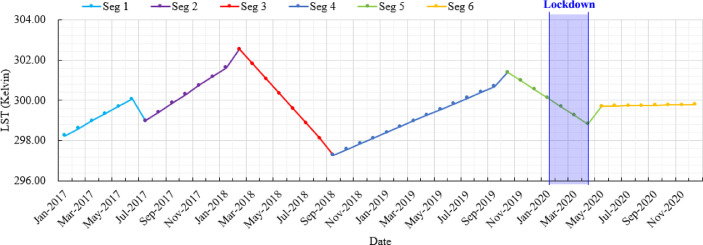
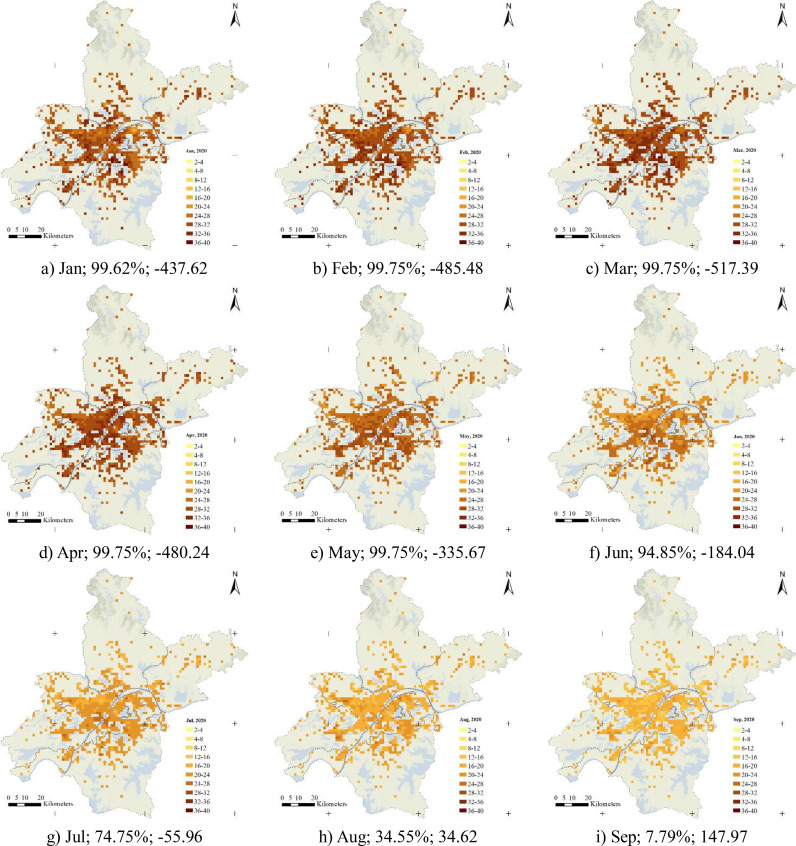
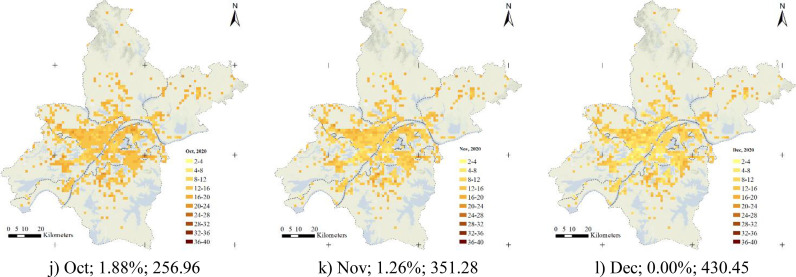
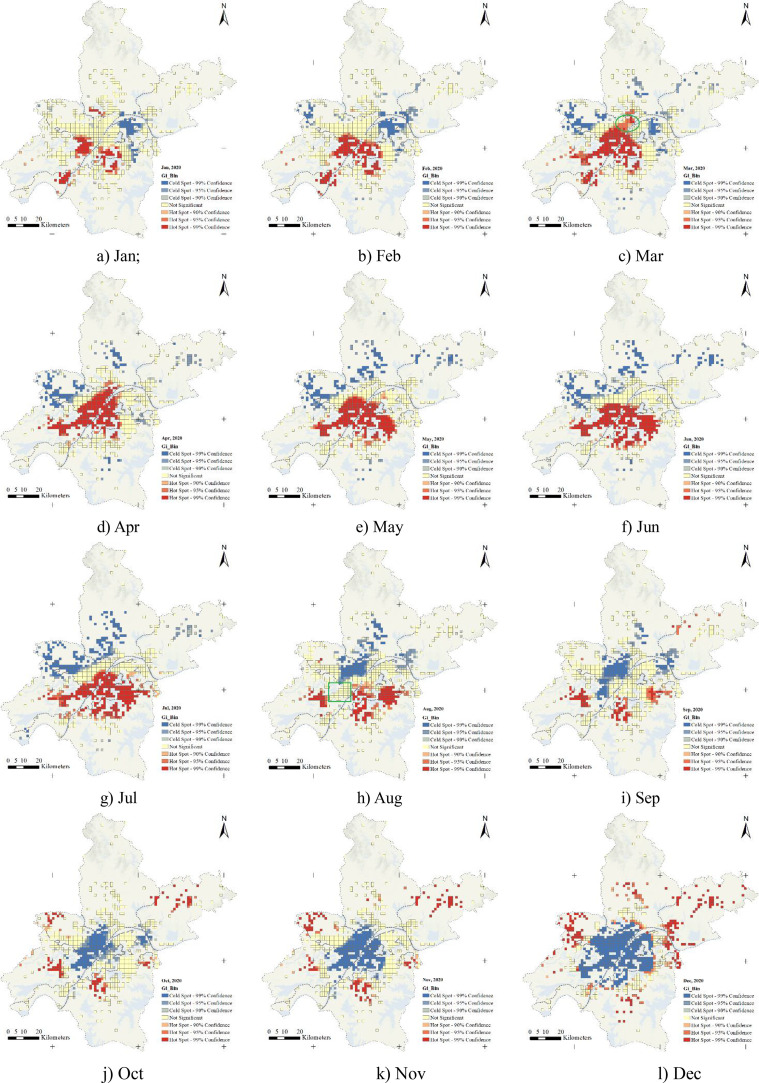
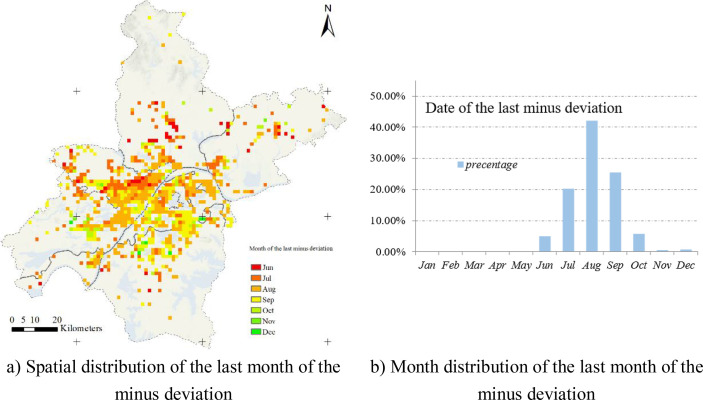
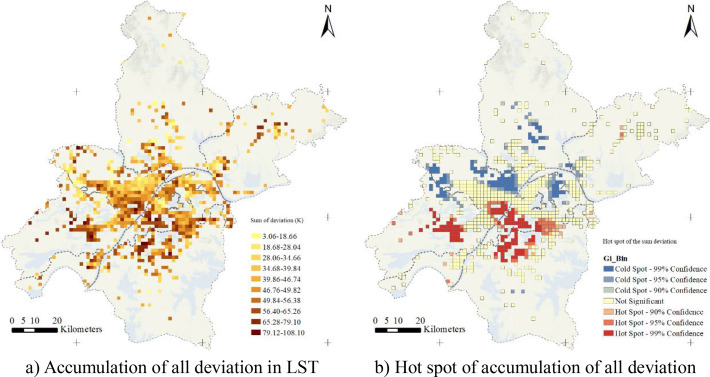
Understanding the spatiotemporal patterns of the COVID-19 impact on industrial production could improve the estimation of the economic loss and sustainable work resumption policies in cities. In this study, assuming and checking a correlation between the land surface temperature (LST) and industrial production, we applied the BFAST algorithm and linear regression models on multi-temporal MODIS data to derive monthly time-series deviation of LST with a spatial resolution of 1 × 1 km, to quantificationally explore the fine-scale spatiotemporal patterns of the COVID-19 control measures impact on industrial production, within Wuhan city. The results demonstrate that (1) the trend of time-series LST could partly reflect the impact of the COVID-19 pandemic on industrial production, and the year-around industrial production was less than expectations, with a fall of 14.30%; (2) the most serious COVID-19 impact on industrial production appeared in Mar. and Apr., then, after the lifting of lockdown, some regions (approximate 4.90%) firstly returned to expected levels in Jun, and almost all regions (98.49%) have completed the resumption of work and production before Nov.; (3) the southwest and south-central had more serious impact of the COVID-19 pandemic, approximate twice as much as that in the north and suburban, in Wuhan. The results and findings elaborated the spatiotemporal distribution and their changes during 2020 within Wuhan, which could provide a beneficial support for assessment of the COVID-19 pandemic and implementation of resumption plans for sustainable development.
Keywords: COVID-19; Industrial production; Land surface temperature; Spatiotemporal pattern; Time-series analysis.
© 2021 Elsevier Ltd. All rights reserved.
Conflict of interest statement
The authors declare that they have no known competing financial interests or personal relationships that could have appeared to influence the work reported in this paper.
Figures
Similar articles
-
Monitoring Spatiotemporal Distribution of the GDP of Major Cities in China during the COVID-19 Pandemic.Int J Environ Res Public Health. 2022 Jun 30;19(13):8048. doi: 10.3390/ijerph19138048. Int J Environ Res Public Health. 2022. PMID: 35805721 Free PMC article.
-
How Do the Multi-Temporal Centroid Trajectories of Urban Heat Island Correspond to Impervious Surface Changes: A Case Study in Wuhan, China.Int J Environ Res Public Health. 2019 Oct 12;16(20):3865. doi: 10.3390/ijerph16203865. Int J Environ Res Public Health. 2019. PMID: 31614779 Free PMC article.
-
Post COVID-19 pandemic recovery of intracity human mobility in Wuhan: Spatiotemporal characteristic and driving mechanism.Travel Behav Soc. 2023 Apr;31:37-48. doi: 10.1016/j.tbs.2022.11.003. Epub 2022 Nov 11. Travel Behav Soc. 2023. PMID: 36405767 Free PMC article.
-
Urban green space mediates spatiotemporal variation in land surface temperature: a case study of an urbanized city, Bangladesh.Environ Sci Pollut Res Int. 2022 May;29(24):36376-36391. doi: 10.1007/s11356-021-17480-9. Epub 2022 Jan 21. Environ Sci Pollut Res Int. 2022. PMID: 35060045
-
Impact of COVID lockdowns on spatio-temporal variability in land surface temperature and vegetation index.Environ Monit Assess. 2023 Mar 24;195(4):507. doi: 10.1007/s10661-023-11119-7. Environ Monit Assess. 2023. PMID: 36961576 Free PMC article.
Cited by
-
Analysis of the socioeconomic impact due to COVID-19 using a deep clustering approach.Appl Soft Comput. 2022 Nov;129:109606. doi: 10.1016/j.asoc.2022.109606. Epub 2022 Sep 5. Appl Soft Comput. 2022. PMID: 36092471 Free PMC article.
-
Impact of the COVID-19 pandemic on the energy performance of residential neighborhoods and their occupancy behavior.Sustain Cities Soc. 2022 Jul;82:103896. doi: 10.1016/j.scs.2022.103896. Epub 2022 Apr 12. Sustain Cities Soc. 2022. PMID: 35433236 Free PMC article.
-
Anthropogenic heat variation during the COVID-19 pandemic control measures in four Chinese megacities.Remote Sens Environ. 2023 Aug 1;293:113602. doi: 10.1016/j.rse.2023.113602. Epub 2023 Apr 26. Remote Sens Environ. 2023. PMID: 37159819 Free PMC article.
-
Data-driven multiscale modelling and analysis of COVID-19 spatiotemporal evolution using explainable AI.Sustain Cities Soc. 2022 May;80:103772. doi: 10.1016/j.scs.2022.103772. Epub 2022 Feb 11. Sustain Cities Soc. 2022. PMID: 35186668 Free PMC article.
-
A machine learning-driven spatio-temporal vulnerability appraisal based on socio-economic data for COVID-19 impact prevention in the U.S. counties.Sustain Cities Soc. 2022 Aug;83:103990. doi: 10.1016/j.scs.2022.103990. Epub 2022 Jun 5. Sustain Cities Soc. 2022. PMID: 35692599 Free PMC article.
References
-
- Basu B., Murphy E., Molter A., et al. Investigating changes in noise pollution due to the COVID-19 lockdown: The case of Dublin, Ireland. Sustainable Cities and Society. 2021;65
LinkOut - more resources
Full Text Sources
Miscellaneous