. 2021 Oct 5:10:e67397.
doi: 10.7554/eLife.67397.

HIV status alters disease severity and immune cell responses in Beta variant SARS-CoV-2 infection wave

Collaborators, Affiliations

HIV status alters disease severity and immune cell responses in Beta variant SARS-CoV-2 infection wave

Farina Karim et al. Elife. .

Abstract

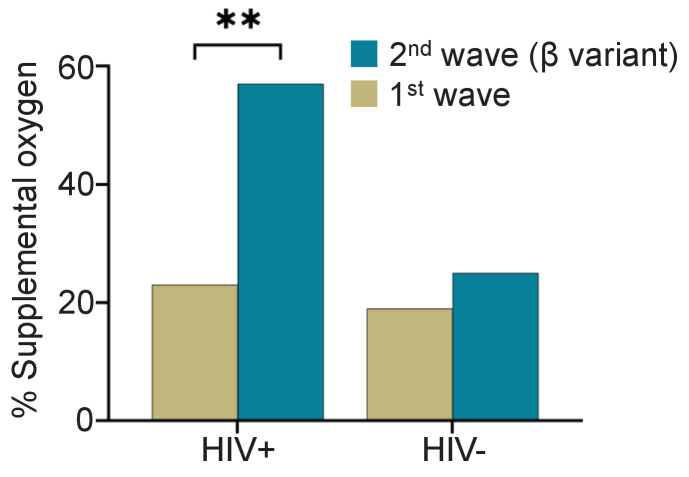
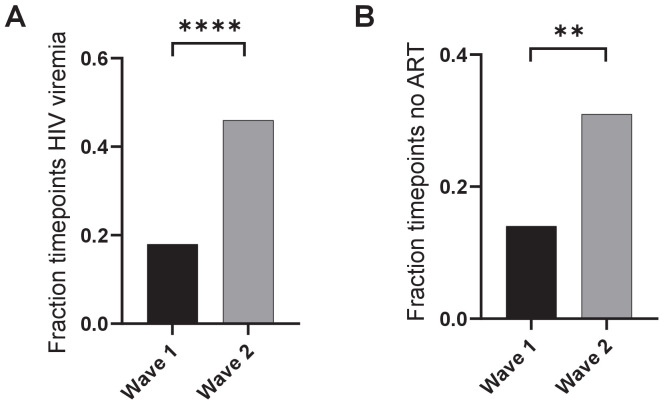
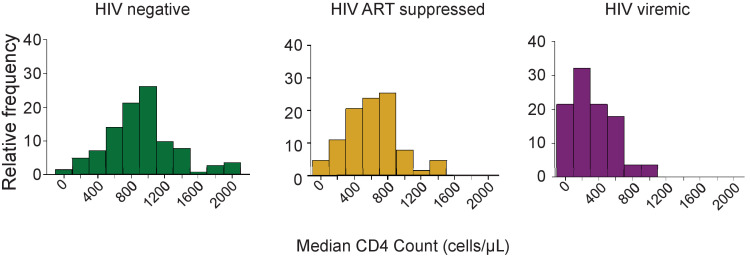
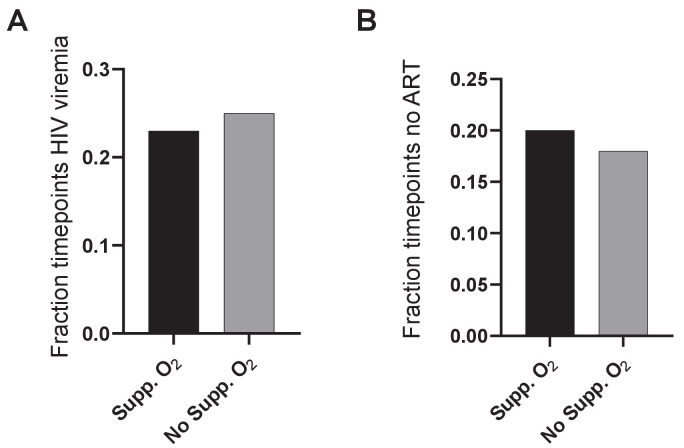
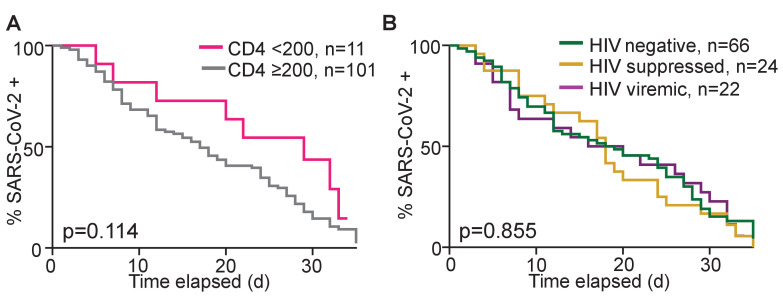
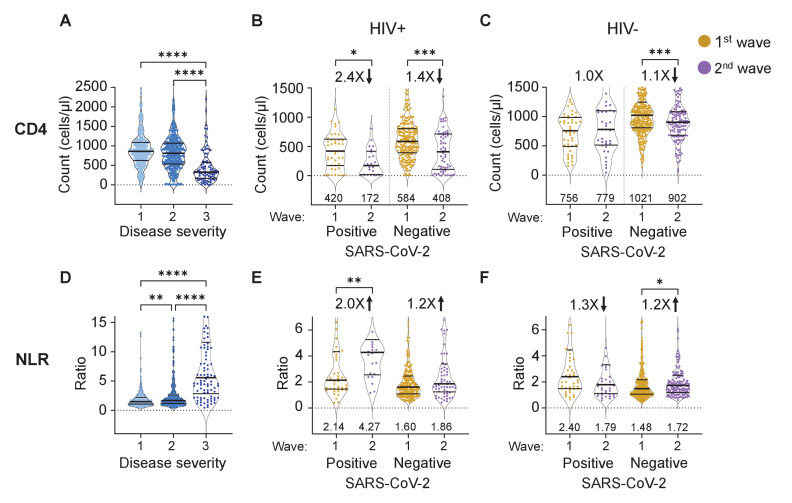
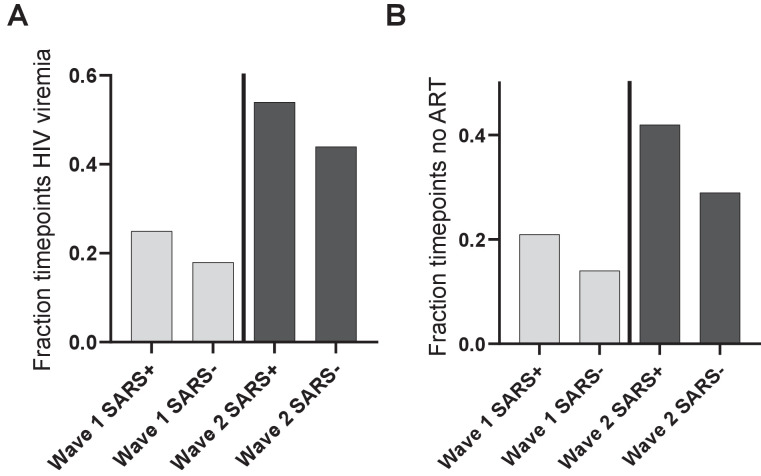
There are conflicting reports on the effects of HIV on COVID-19. Here, we analyzed disease severity and immune cell changes during and after SARS-CoV-2 infection in 236 participants from South Africa, of which 39% were people living with HIV (PLWH), during the first and second (Beta dominated) infection waves. The second wave had more PLWH requiring supplemental oxygen relative to HIV-negative participants. Higher disease severity was associated with low CD4 T cell counts and higher neutrophil to lymphocyte ratios (NLR). Yet, CD4 counts recovered and NLR stabilized after SARS-CoV-2 clearance in wave 2 infected PLWH, arguing for an interaction between SARS-CoV-2 and HIV infection leading to low CD4 and high NLR. The first infection wave, where severity in HIV negative and PLWH was similar, still showed some HIV modulation of SARS-CoV-2 immune responses. Therefore, HIV infection can synergize with the SARS-CoV-2 variant to change COVID-19 outcomes.

Keywords: COVID-19; HIV; SARS-CoV-2; antiretroviral therapy; beta variant; infectious disease; microbiology; virus.


Conflict of interest statement

FK, IG, SC, YZ, RK, MB, KK, YG, HR, NM, MM, DM, DR, TN, WH, BG, RL, EW, Td, MM, GL, AL, HK, AS No competing interests declared

Figures

Figure 1.
Figure 1.. Fraction of PLWH and HIV-negative participants requiring supplemental oxygen during the first and the Beta variant dominated second infection waves.
p=0.0025 by Fisher’s Exact test.
Figure 1—figure supplement 1.
Figure 1—figure supplement 1.. Viremia and ART in PLWH in wave 1 versus wave 2.
(A) HIV viremia was calculated as the number of study timepoints in wave 1 or wave 2 with HIV RNA > 200 copies/ml divided by all measured timepoints for PLWH. (B) The fraction of timepoints with no detectable ART was calculated as the number of study timepoints in wave 1 or wave 2 where the concentration of none of the ART components was above level of quantification divided by the number of timepoints where ART was measured. p-values are * <0.05; ** <0.01; *** < 0.001, **** < 0.0001 as determined by Fisher’s Exact test.
Figure 1—figure supplement 2.
Figure 1—figure supplement 2.. Effect of ART regimen on disease severity.
Disease severity was scored on a 3 point scale, where 1: asymptomatic, 2: mild, and 3: supplemental oxygen or death. EFV: efavirenz-based regimen. LPV: Lopinavir based regimen.
Figure 1—figure supplement 3.
Figure 1—figure supplement 3.. Distribution of CD4 counts by HIV status.
Plotted are the CD4 T cell count distributions for HIV negative, HIV ART suppressed, and HIV viremic participants. X-axis is the median CD4 count over all study visits, and y-axis is relative frequency of participants as percentage.
Figure 1—figure supplement 4.
Figure 1—figure supplement 4.. Viremia and ART in PLWH requiring versus not requiring supplemental oxygen.
(A) HIV viremia was calculated as the number of study timepoints with HIV RNA > 200 copies/ml divided by all measured timepoints for PLWH. (B) The fraction of timepoints with no detectable ART was calculated as the number of study timepoints where the concentration of none of the ART components was above level of quantification divided by all measured PLWH timepoints. No significance for comparison in (A) or (B) as determined by Fisher’s Exact test.
Figure 1—figure supplement 5.
Figure 1—figure supplement 5.. Dependence of time to SARS-CoV-2 clearance on CD4 count and HIV status.
(A) Number of participants remaining SARS-CoV-2 positive by qPCR with time as a function of CD4 count. (B) Number of participants remaining SARS-CoV-2 positive by qPCR with time as a function of HIV status. Time is days post-diagnostic swab. Only participants who were tested with two conclusive tests result (either SARS-CoV-2 positive or negative) during the time-period were included.
Figure 2.
Figure 2.. The differential effect of HIV on the CD4 count and neutrophil to lymphocyte ratio between waves.
(A) The concentration of CD4 T cells in the blood in all participants in all infection waves and at all timepoints as a function of disease severity. Disease severity was scored as 1: asymptomatic, 2: mild, and 3: on supplemental oxygen or death. CD4 counts in PLWH (B) and HIV negative (C) participants in wave 1 versus wave 2 during active SARS-CoV-2 infection and after SARS-CoV-2 clearance. (D) Neutrophil to lymphocyte ratio (NLR) in the blood in all participants in all infection waves and at all timepoints as a function of disease severity. NLR in PLWH (E) and HIV negative (F) participants in wave 1 versus wave 2 during active SARS-CoV-2 infection and after SARS-CoV-2 clearance. SARS-CoV-2 positive indicates a timepoint where SARS-CoV-2 RNA was detected. Data shown as violin plots with median and IQR, with the median denoted below each plot. Fold-change in the second wave versus first wave is indicated, with arrow denoting direction of change. p-values are * <0.05; ** <0.01; *** < 0.001, **** < 0.0001 as determined by Kruskal-Wallis test with Dunn's multiple comparison correction or by Mann-Whitney U test. Plots scales were restricted to highlight changes close to the median.
Figure 2—figure supplement 1.
Figure 2—figure supplement 1.. The differential effect of HIV on the CD4 count and neutrophil to lymphocyte ratio between waves - full dataset and number of data points per plot.
(A) The concentration of CD4 T cells in the blood in all participants in all infection waves and at all time-points as a function of disease severity. Disease severity was scored as 1: asymptomatic, 2: mild, and 3: requiring supplemental oxygen and/or death. CD4 counts in PLWH (B) and HIV negative (C) participants in wave 1 versus wave 2 during active SARS-CoV-2 in during active SARS-CoV-2 infection and after SARS-CoV-2 clearance. (D) Neutrophil to lymphocyte ratio (NLR) in the blood in all participants in all infection waves and at all time-points as a function of disease severity. NLR in PLWH (E) and HIV-negative (F) participants in wave 1 versus wave 2 during active SARS-CoV-2 in during active SARS-CoV-2 infection and after SARS-CoV-2 clearance. SARS-CoV-2 positive indicates a timepoint where SARS-CoV-2 RNA was detected in the upper respiratory tract. Data shown as violin plots with median and IQR, with the median also denoted below each plot. Fold-change in the second wave versus first wave is indicated by the number above the second wave data, with arrow denoting direction of change. p-values are * <0.05; ** <0.01; *** < 0.001, **** < 0.0001 as determined by Kruskal-Wallis test with Dunn's multiple comparison correction for the left plots or by Mann-Whitney U test for the other data.
Figure 2—figure supplement 2.
Figure 2—figure supplement 2.. No significant increase in control of HIV infection at convalescence relative to active SARS-CoV-2 infection.
(A) The fraction of measured timepoints at which HIV viremia was detected in infection wave 1 (left bars) or infection wave 2 (right bars) during active SARS-CoV-2 infection (SARS+) or convalescence (SARS-). HIV viremia was calculated as the number of study timepoints in wave 1 or wave 2 with HIV RNA > 200 copies/ml divided by all measured timepoints for PLWH. (B) The fraction of measured timepoints at which no ART was detected in infection wave 1 (left bars) or infection wave 2 (right bars) during active SARS-CoV-2 infection (SARS+) or convalescence (SARS-). The fraction of timepoints with no detectable ART was calculated as the number of study timepoints in wave 1 or wave 2 where the concentration of none of the ART components was above level of quantification divided by all measured PLWH timepoints.
Figure 3.
Figure 3.. Immune cell and clinical correlates in HIV negative and PLWH groups.
Spearman rank correlation values (ρ) are shown from red (1.0) to blue (−1.0). p-values per correlation are *< 0.5; **< 0.01; ***< 0.001. The number of matched pairs for HIV negative participants ranged from 77 to 229 and for PLWH from 48 to 164. Rectangles represent regions where a set of correlations is present in one group and absent in the other. Black dashed lines represent the divide between clinical and cellular parameters.
Figure 3—figure supplement 1.
Figure 3—figure supplement 1.. Gating strategy.
(A) Gating of T cell subsets. Live CD3+ cells were gated into CD4+ and CD8+ subsets, which were further divided based on CXCR3, HLA-DR, and PD-1 for CD8 T cells and CXCR3, CCR7, HLA-DR, and PD-1 for CD4 T cells. (B) Gating of B cell subsets. Live CD19+ cells were subdivided into memory, naive, and antibody secreting cells (ASC) based on CD27 and CD38. ASC were further subdivided into plasma cells and plasmablasts based on CD138. (C) Gating of NK cell subsets. Live CD19- CD3- cells were subdivided into CD56+ NK cells, which were further gated into CD56hiCD16- regulatory and CD56+CD16+ cytotoxic NK cell subsets.
Figure 4.
Figure 4.. Differences between PLWH and HIV-negative participants in immune cell markers.
Percent of CD8 T cells positive for CXCR3 (A) or double positive for HLA-DR and PD-1 (B). Percent of CD4 T cells positive for CXCR3 (C) or double positive for HLA-DR and PD-1 (D). Data is composed of 15 participant timepoints which were SARS-CoV-2+HIV-, 14 SARS-CoV-2+HIV+, 40 SARS-CoV-2-HIV+, and 74 SARS-CoV-2-HIV-, where SARS-CoV-2+ indicates SARS-CoV-2 RNA was detected in the upper respiratory tract. p-values for differences between PLWH and HIV-negative participants are * <0.05; ** <0.01; *** < 0.001, **** < 0.0001 as determined by the Mann-Whitney U test.

References

    1. Ambrosioni J, Blanco JL, Reyes-Urueña JM, Davies MA, Sued O, Marcos MA, Martínez E, Bertagnolio S, Alcamí J, Miro JM, Investigators C-i, COVID-19 in HIV Investigators Overview of SARS-CoV-2 infection in adults living with HIV. The Lancet HIV. 2021;8:e294–e305. doi: 10.1016/S2352-3018(21)00070-9. - DOI - PMC - PubMed
    1. Avelino-Silva VI, Miyaji KT, Mathias A, Costa DA, de Carvalho Dias JZ, Lima SB, Simoes M, Freire MS, Caiaffa-Filho HH, Hong MA, Lopes MH, Sartori AM, Kallas EG. CD4/CD8 ratio predicts yellow fever Vaccine-Induced antibody titers in Virologically suppressed HIV-Infected patients. JAIDS Journal of Acquired Immune Deficiency Syndromes. 2016;71:189–195. doi: 10.1097/QAI.0000000000000845. - DOI - PubMed
    1. Bhaskaran K, Rentsch CT, MacKenna B, Schultze A, Mehrkar A, Bates CJ, Eggo RM, Morton CE, Bacon SCJ, Inglesby P, Douglas IJ, Walker AJ, McDonald HI, Cockburn J, Williamson EJ, Evans D, Forbes HJ, Curtis HJ, Hulme WJ, Parry J, Hester F, Harper S, Evans SJW, Smeeth L, Goldacre B. HIV infection and COVID-19 death: a population-based cohort analysis of UK primary care data and linked national death registrations within the OpenSAFELY platform. The Lancet HIV. 2021;8:e24–e32. doi: 10.1016/S2352-3018(20)30305-2. - DOI - PMC - PubMed
    1. Braunstein SL, Lazar R, Wahnich A, Daskalakis DC, Blackstock OJ. Coronavirus Disease 2019 (COVID-19) Infection Among People With Human Immunodeficiency Virus in New York City: A Population-Level Analysis of Linked Surveillance Data. Clinical Infectious Diseases. 2021;72:e1021–e1029. doi: 10.1093/cid/ciaa1793. - DOI - PMC - PubMed
    1. Carson PJ, Schut RL, Simpson ML, O'Brien J, Janoff EN. Antibody class and subclass responses to pneumococcal polysaccharides following immunization of human immunodeficiency virus-infected patients. Journal of Infectious Diseases. 1995;172:340–345. doi: 10.1093/infdis/172.2.340. - DOI - PubMed

Publication types

Supplementary concepts

LinkOut - more resources