. 2021 Oct 5:10:e69207.
doi: 10.7554/eLife.69207.

Protective mitochondrial fission induced by stress-responsive protein GJA1-20k

Affiliations

Protective mitochondrial fission induced by stress-responsive protein GJA1-20k

Daisuke Shimura et al. Elife. .

Abstract

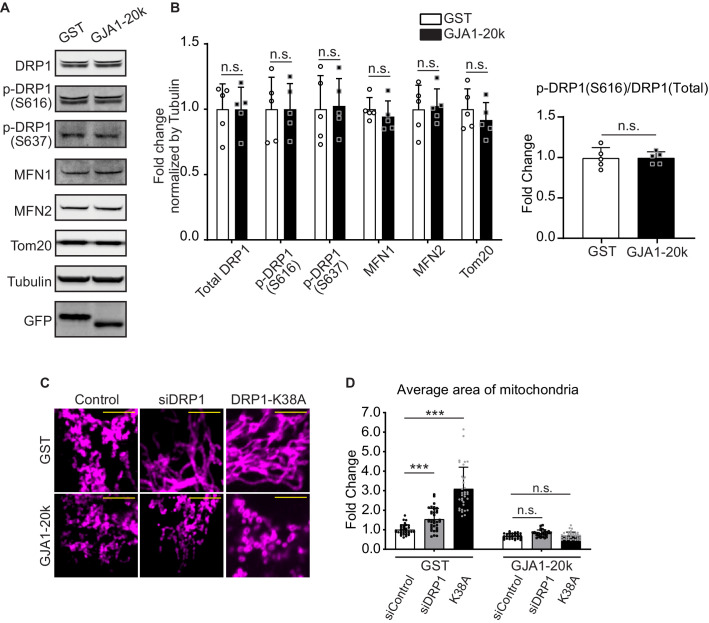
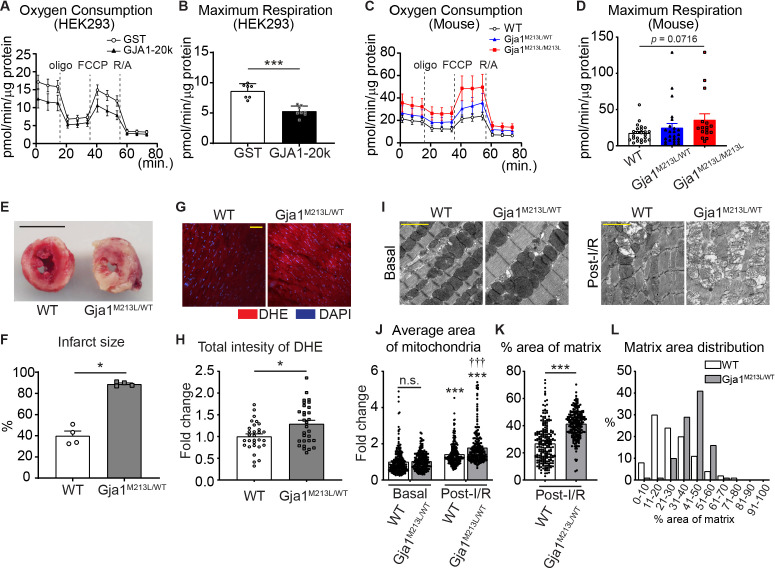
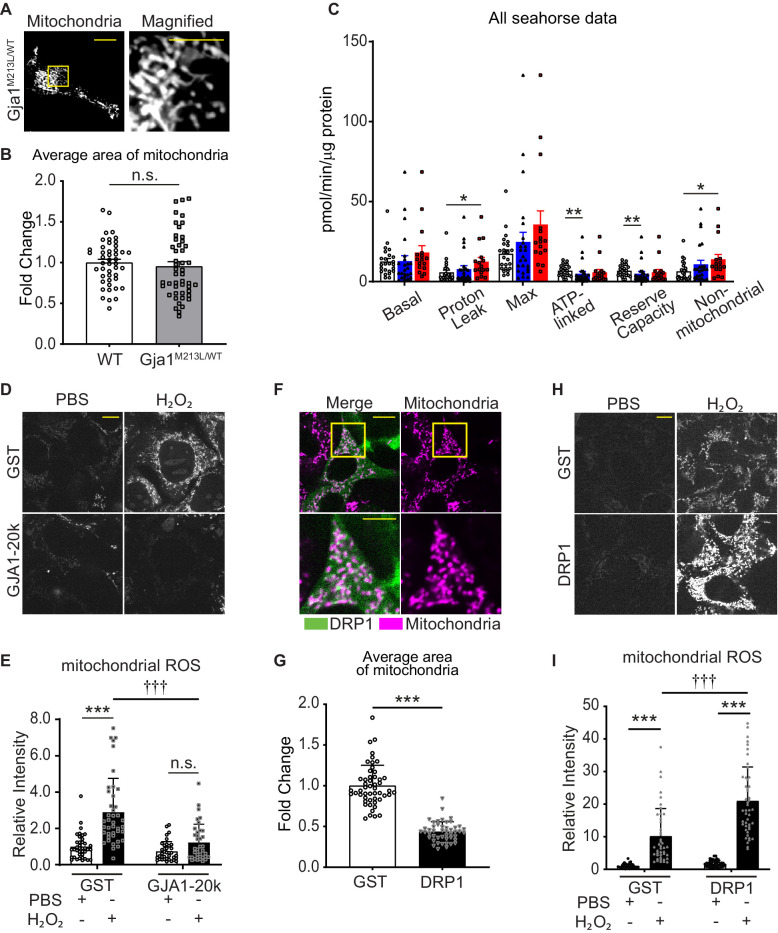
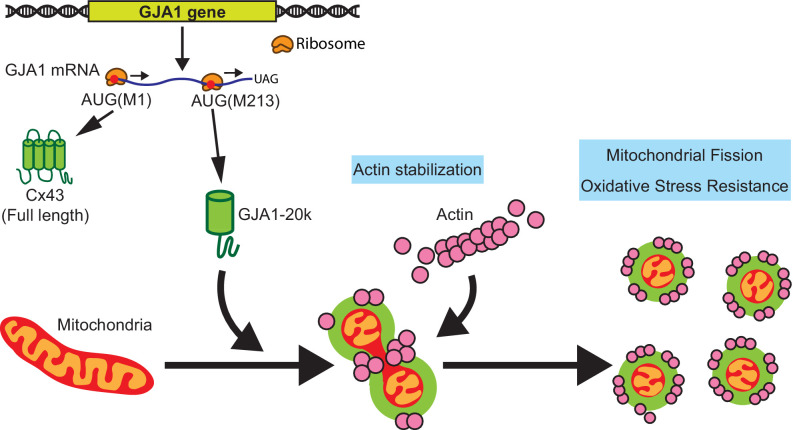
The Connexin43 gap junction gene GJA1 has one coding exon, but its mRNA undergoes internal translation to generate N-terminal truncated isoforms of Connexin43 with the predominant isoform being only 20 kDa in size (GJA1-20k). Endogenous GJA1-20k protein is not membrane bound and has been found to increase in response to ischemic stress, localize to mitochondria, and mimic ischemic preconditioning protection in the heart. However, it is not known how GJA1-20k benefits mitochondria to provide this protection. Here, using human cells and mice, we identify that GJA1-20k polymerizes actin around mitochondria which induces focal constriction sites. Mitochondrial fission events occur within about 45 s of GJA1-20k recruitment of actin. Interestingly, GJA1-20k mediated fission is independent of canonical Dynamin-Related Protein 1 (DRP1). We find that GJA1-20k-induced smaller mitochondria have decreased reactive oxygen species (ROS) generation and, in hearts, provide potent protection against ischemia-reperfusion injury. The results indicate that stress responsive internally translated GJA1-20k stabilizes polymerized actin filaments to stimulate non-canonical mitochondrial fission which limits ischemic-reperfusion induced myocardial infarction.

Keywords: GJA1-20k; actin dynamics; cell biology; human; ischemia/reperfusion; mitochondria; mitochondria dynamics; mouse; organ protection.


Conflict of interest statement

DS, EN, RB, SV, SX, JW, JP, TH, JR, RS No competing interests declared

Figures

Figure 1.
Figure 1.. GJA1-20k decreases in mitochondrial size.
(AC) Representative live cell images of mitochondria in HEK293 (A, GST- or GJA1-20k-transfected; B, Control and siGja1) and mouse neonatal cardiomyocytes (C, WT, GJA1-20k-transducted, and Gja1M213L/M213L). The right-most panels are magnified images. (D) and (E) Representative EM images from young mouse hearts (D, WT or Gja1M213L/M213L) and adult mouse hearts (E, GST- or GJA1-20k-injected). (F) Summary of the fold change in the average area of mitochondria. (n = 51 (GST), 67 (GJA1-20k), 52 (Control), or 57 (siGja1) HEK293) cells from five independent experiments; n = 46 (WT), 47 (GJA1-20k), or 48 (Gja1M213L/M213L) cells from four hearts; n = 84 (WT) or 91 (Gja1M213L/M213L) images from six hearts; n = 25 (GST), or 28 (GJA1-20k) images from three hearts. Graphs were expressed as mean ± SD (HEK293) or± SEM (mouse). p values were determined by two-tailed Mann-Whitney U-test or Kruskal-Wallis test with Dunn’s post-hoc test. **p < 0.01, ***p < 0.001. Scale bars, 10 μm and 5 μm in magnified (A–C); 2 μm (D and E). Exact p values and statistical data are provided in the source data.
Figure 1—figure supplement 1.
Figure 1—figure supplement 1.. The confirmation of Gja1 knock-down and the mitochondrial morphology rescued by GJA1-20k.
(A) Western blot analysis for Gja1 knock-down by siRNA. Tubulin was used as internal loading control. n = 3 independent experimental repeats. (B) The representative confocal live cell imaging of Gja1 knocked-down HEK293 cells with Cx43-M6L or GJA1-20k transfection. (C) The fold change in the average area of individual mitochondria. n = 52 (Control), 57 (siGja1), 60 (siGja1+ M6 L), or 64 (siGja1+ GJA1-20 k) cells from five independent experiments. The images and the values of Control and siGja1 are also shown in Figure 1. (D) The representative live cell imaging of mitochondria in WT mouse neonatal CMs with adenovirus-mediated GFP induction. The right panel indicates magnified image surrounded by square. (E) The fold change in the average area of individual mitochondria between WT (no virus introduction, the image and the value shown in Figure 1) and GFP-V5 introduction. n = 46 (WT) or 35 (GFP) cells from four hearts. Graphs were expressed as mean ± SD (C) or SEM (E). p values were determined by two-tailed Mann-Whitney U-test or Kruskal-Wallis test with Dunn’s post-hoc test. *p < 0.05, **p < 0.01, ***p < 0.001; n.s., not significant. Scale bars, 10 μm or 5 μm in magnified image. Exact p values and statistical data are provided in the source data.
Figure 1—figure supplement 2.
Figure 1—figure supplement 2.. The effects of GJA1-20k on membrane potential, ATP production, mitochondrial biogenesis, and mitophagy.
(A) TMRE intensity (mitochondrial membrane potential) in HEK293 cells with GST or GJA1-20k transfection. n = 39 (GST) or 41 (GJA1-20k) cells from three independent experiments. (B) ATP production from HEK293 cells with GST or GJA1-20k transfection. n = 10 replicates. (C) The fold change in mitochondrial DNA copy number in HEK293 or mouse heart with or without the modification of GJA1-20k expression. n = 5 independent experimental repeats (HEK293); n = 5 (WT), or 6 (Gja1M213L/M213L) hearts; or 10 (AAV9-induced-GST or GJA1-20k) hearts. (D) and (F) Western blot analysis for mitochondrial biogenesis and mitophagy marker proteins in HEK293 cells (D) or mouse hearts (F). Tubulin was used as internal loading control. (E) and (G) The fold change of the level of the proteins and ratio of LC3-ii/-i in HEK293 cells (E) or mouse hearts (G). n = 5 independent experimental repeats (HEK293 cells); 4 (LC3) or five hearts from WT or Gja1M213L/M213L mouse. Graphs were expressed as mean ± SD (HEK293) or SEM (mouse). p values were determined by two-tailed Mann-Whitney U-test. *p < 0.05, **p < 0.01; n.s., not significant. Exact p values and statistical data are provided in the source data.
Figure 2.
Figure 2.. DRP1 is not involved in GJA1-20k-mediated mitochondrial fission.
(A) and (B) Western blot analysis for mitochondrial dynamics related proteins. Transfection was confirmed by GFP bands and the band size difference in GFP is due to the difference in molecular weight between GST and GJA1-20k (A). Tubulin was used as internal loading control. n = 5 independent experimental repeats. (C) Representative fixed cell images of mitochondria (visualized by Tom20) with DRP1 siRNA, K38A treatment, or Control. (D) The fold change in the average area of mitochondria in each treatment. n = 34 (GST, control siRNA), 32 (GJA1-20k, control siRNA), 36 (GST, DRP1 siRNA), 31 (GJA1-20k, DRP1 siRNA), 34 (GST, K38A), or 36 (GJa1-20k, K38A) cells from three independent experiments. Graphs were expressed as mean ± SD. p values were determined by two-tailed Mann-Whitney U-test or two-way ANOVA with Bonferroni’s post-hoc test. ***p < 0.001; n.s., not significant. Scale bars, 5 μm (C). Exact p values and statistical data are provided in the source data.
Figure 2—figure supplement 1.
Figure 2—figure supplement 1.. Detailed analysis of DRP1 and DNM2 inhibition and GJA1-20k induced mitochondrial fission.
(A) and (G) Western blot analysis for DRP1 (A) or DNM2 (G) knock-down by siRNA. n = 3 independent experimental repeats. (B), (F), and (H) The representative fixed cell images of mitochondria (and DRP1 in B) with or without siDRP1 (B), DRP1-K38A (F), or siDNM2 (H) treatment. The magnified mitochondria images surrounded by the square in (B) and (F) are used in Figure 2. (C) % area of mitochondria associated with DRP1 with or without siDRP1 treatment. n = 34 (GST, siControl), 32 (GJA1-20k, siControl), 36 (GST, siDRP1), or 31 (GJA1-20k, siDRP1) cells from three independent experiments. (D) The representative fixed cell images of mitochondria with or without Mdivi-1 treatment. The right-most panels are magnified images surrounded by the square. (E) and (I) The fold change in the average area of mitochondria with or without Mdivi-1 (E) or siDNM2 (I) treatment. n = 32 (GST, DMSO), 33 (GJA1-20k, DMSO), or 29 (GST or GJA1-20k, Mdivi-1) cells; 40 (GST, siDNM2) or 33 (GJA1-20k, siDNM2) cells from three independent experiments. The graph of siControl and siDRP1 are used in Figure 2. Mitochondria were visualized by Tom20. Scale bars, 10 μm (B, D, and F) or 5 μm (B and D in magnified image, and H). Graphs were expressed as mean ± SD. p values were determined by two-way ANOVA with Bonferroni’s post-hoc test. ***p < 0.001; n.s., not significant. Exact p values and statistical data are provided in the source data.
Figure 3.
Figure 3.. GJA1-20k stabilizes and recruits actin around mitochondria for fission.
(A) Representative live cell images of mitochondria with or without GJA1-20k. Actin was labeled by co-transfection with lifeAct-mCherry. The right-most panels indicate magnified images surrounded by square. (B) and (C) Western blot analysis in cytosol or mitochondrial fraction. MEK1/2 was used as cytosol marker and Tom20 and COX IV as mitochondrial markers (B). Quantification of actin in mitochondrial fraction normalized by Tom20 expression (C). n = 4 independent experimental repeats. (D) and (E) Cell-free actin polymerization (D) and depolymerization (E) assay. (F) Representative fixed cell images of mitochondria (visualized by Tom20) with or without LatA. (G) The fold change in the average area of mitochondria with or without LatA treatment. n = 32 (GST, DMSO), 33 (GST, LatA), 28 (GJA1-20k, DMSO), or 32 (GJA1-20k, LatA) cells from three independent experiments. Graphs were expressed as mean ± SD. p values were determined by two-tailed Mann-Whitney U-test or two-way ANOVA with Bonferroni’s post-hoc test. *p < 0.05, ***p < 0.001; n.s., not significant. Scale bars, 10 μm (F), 5 μm (A and magnified in F) and 2 μm (magnified in A). Exact p values and statistical data are provided in the source data.
Figure 4.
Figure 4.. Time course of mitochondria dynamics and actin accumulation at the mitochondrial fission site under siDRP1.
(A) Representative live cell images of mitochondria with GJA1-20k under siDRP1. (B) Representative mitochondrial dynamics in GJA1-20k-transfected cells by time-lapse live cell imaging under siDRP1 treatment. The bottom images (with fire look-up table) indicate the product of GJA1-20k and actin signals. The white lines indicate mitochondrial outlines. Scale bars, 5 μm (A) and 2 μm (B). (C) The intensity of mitochondria and the product of GJA1-20k and actin from (B). The colored areas indicate fission sites along the lines shown in each respective insert. (DF) The time course of the product of GJA1-20k and actin intensity (D), mitochondrial intensity (E), or combined relative intensity (F) at the fission site from the mitochondrion shown in (B). Curves are four parameters logistic (4PL) fits to the data. Time 0 corresponds to the peak product of actin and GJA1-20k intensity. The arrows indicate the time point at which fission is complete. (G) Measured time from peak product of actin and GJA1-20k intensity to fission in seconds (bars indicate median and 95 % confidence interval). n = 30 events. All data points are provided in the source data.
Figure 4—figure supplement 1.
Figure 4—figure supplement 1.. Time course of mitochondria dynamics and actin acumulation at the mitochondrial fission site under Mdivi-1 treatment.
(A) and (C) Representative mitochondrial dynamics in GJA1-20k-transfected cells by time-lapse live cell imaging under Mdivi-1 treatment. The bottom images (with fire look-up table) indicate the product of GJA1-20k and actin signals. The white lines indicate mitochondrial outlines. Scale bars, 2 μm. (B) and (D) The intensity of mitochondria and the product of GJA1-20k and actin from (A) and (C), respectively. The colored areas indicate fission sites along the lines shown in each respective insert. (EG) The time course of the product of GJA1-20k and actin intensity (E), mitochondrial intensity (F), or combined relative intensity (G) at the fission site from the mitochondrion shown in (A). Curves are four parameters logistic (4PL) fits to the data. Time 0 corresponds to the peak product of actin and GJA1-20k intensity. The arrows indicate the time point at which fission is complete. (H) Measured time from peak product of actin and GJA1-20k intensity to fission in seconds (bars indicate median and 95% confidence interval). n = 29 events. All data points are provided in the source data.
Figure 5.
Figure 5.. Mitochondrial metabolic function is preserved by GJA1-20k.
(AD) Real-time change in OCR by Seahorse assay and the maximum respiration in HEK293 cells (A and B) and mouse neonatal CM (C and D). 7 (GST) or 8 (GJA1-20k) replicates from HEK293 cells; n = 24 (WT and Gja1M213L/WT from four hearts) or 16 (Gja1M213L/M213L from three hearts) replicates. (E) Representative images of TTC stained hearts from WT and Gja1M213L/WT mice post-I/R. (F) Quantification of infarct size after I/R. n = 4. (G) Representative images of DHE staining post-I/R from WT or Gja1M213L/WT heart. (H) Relative intensity of DHE. n = 30 images from three hearts in each genotypes. (I) The representative electron microscope images from adult mouse hearts under basal or post-I/R (WT or Gja1M213L/WT). (J) The fold change in the average area of individual mitochondria. n = 240 (WT, Basal), 225 (Gja1M213L/WT, Basal), 229 (WT, post-I/R), or 224 (Gja1M213L/WT, post-I/R) mitochondria from three hearts. (K) % area of mitochondria matrix post-I/R. n = 229 (WT, post-I/R), or 224 (Gja1M213L/WT, post-I/R) mitochondria from three hearts. (L) The distribution of the data set in (K). Graphs were expressed as mean ± SD (HEK293) or SEM (mouse). p values were determined by two-tailed Mann-Whitney U-test, Kruskal-Wallis test with Dunn’s post-hoc test, or two-way ANOVA with Bonferroni’s post-hoc test. *p < 0.05, ***p < 0.001; †††p < 0.001 compared to WT post-I/R; n.s., not significant. Scale bars, 5 mm (E); 50 μm (G); 2 μm (I). Exact p values and statistical data are provided in the source data.
Figure 5—figure supplement 1.
Figure 5—figure supplement 1.. The details of difference between WT and heterozygous Gja1M213L/WT and ROS generation induced by H2O2 stimulation.
(A) Representative live cell images of mitochondria in mouse neonatal CMs from heterozygous Gja1M213L/WT mice. (B) The fold change in the average area of individual mitochondria. n = 46 (WT) or 48 (Gja1M213L/WT) images from four hearts. WT data is used in Figure 1. (C) Quantification of respiration, Proton-leak, Maximum respiration, ATP-production, Reserve capacity, and Non-mitochondrial respiration among genotypes (WT, white; Gja1M213L/WT, blue; Gja1M213L/M231L, red). (D) and (H) Representative live cell images of ROS generation in HEK293 cells with GST or GJA1-20k (D); or GST or DRP1 (H). (E) and (I) Relative intensity of mitoSOX (E) or cellROX (I). n = 39 (GST, PBS), 41 (GST, H2O2), or 37 (GJA1-20k, PBS or H2O2) cells; or 40 (GST, PBS), 43 (GST, H2O2), 48 (DRP1, PBS), or 47 (DRP1, H2O2) cells from three independent experiments. (F) Representative live cell images of mitochondria in HEK293 cells with DRP1 transfection. The bottom panels are magnified images surrounded by square. (G) T the fold change in the average area of mitochondria. n = 47 cells from three independent experiments. GST data is used in Figure 1. Graphs were expressed as mean ± SD (HEK293) or± SEM (mouse). p values were determined by two-tailed Mann-Whitney U-test or Kruskal-Wallis test with Dunn’s post-hoc test, or two-way ANOVA with Bonferroni’s post-hoc test. *p < 0.05, **p < 0.01, ***p < 0.001; †††p < 0.001 compared to GST H2O2. Scale bars, 10 μm and 5 μm in magnified images. Exact p values and statistical data are provided in the source data.
Figure 6.
Figure 6.. Schematic summary.
GJA1-20k, internally translated from Gja1 mRNA, localizes mitochondria membrane, stabilizes actin cytoskeleton, and recruits actin around mitochondria to both induce mitochondrial fission and achieve oxidative stress resistance.
Author response image 1.
Author response image 1.. The quantification of exogenous GJA1-20k expression in HEK293 cells.
(A) Representative Western blot membrane image from GFP-tagged GJA1-20k transfected cells. (B and C) The quantification of band intensity between endogenous and exogenous GJA1-20k. The graphs were expressed as mean ± SD.

Similar articles

Cited by

References

    1. Andersen KR, Leksa NC, Schwartz TU. Optimized E. coli expression strain LOBSTR eliminates common contaminants from His-tag purification. Proteins. 2013;81:1857–1861. doi: 10.1002/prot.24364. - DOI - PMC - PubMed
    1. Atar D, Arheden H, Berdeaux A, Bonnet JL, Carlsson M, Clemmensen P, Cuvier V, Danchin N, Dubois-Rande JL, Engblom H, Erlinge D, Firat H, Halvorsen S, Hansen HS, Hauke W, Heiberg E, Koul S, Larsen AI, Le Corvoisier P, Nordrehaug JE, Paganelli F, Pruss RM, Rousseau H, Schaller S, Sonou G, Tuseth V, Veys J, Vicaut E, Jensen SE. Effect of intravenous TRO40303 as an adjunct to primary percutaneous coronary intervention for acute ST-elevation myocardial infarction: MITOCARE study results. European Heart Journal. 2015;36:112–119. doi: 10.1093/eurheartj/ehu331. - DOI - PubMed
    1. Basheer WA, Xiao S, Epifantseva I, Fu Y, Kleber AG, Hong T, Shaw RM. GJA1-20k Arranges Actin to Guide Cx43 Delivery to Cardiac Intercalated Discs. Circulation Research. 2017;121:1069–1080. doi: 10.1161/CIRCRESAHA.117.311955. - DOI - PMC - PubMed
    1. Basheer WA, Fu Y, Shimura D, Xiao S, Agvanian S, Hernandez DM, Hitzeman TC, Hong T, Shaw RM. Stress response protein GJA1-20k promotes mitochondrial biogenesis, metabolic quiescence, and cardioprotection against ischemia/reperfusion injury. JCI Insight. 2018;3:20. doi: 10.1172/jci.insight.121900. - DOI - PMC - PubMed
    1. Blanchoin L, Boujemaa-Paterski R, Sykes C, Plastino J. Actin dynamics, architecture, and mechanics in cell motility. Physiological Reviews. 2014;94:235–263. doi: 10.1152/physrev.00018.2013. - DOI - PubMed

Publication types