. 2021 Oct 5;187(2):769-786.
doi: 10.1093/plphys/kiab296.

FTSH4 and OMA1 mitochondrial proteases reduce moderate heat stress-induced protein aggregation

Affiliations

FTSH4 and OMA1 mitochondrial proteases reduce moderate heat stress-induced protein aggregation

Agata Maziak et al. Plant Physiol. .

Abstract

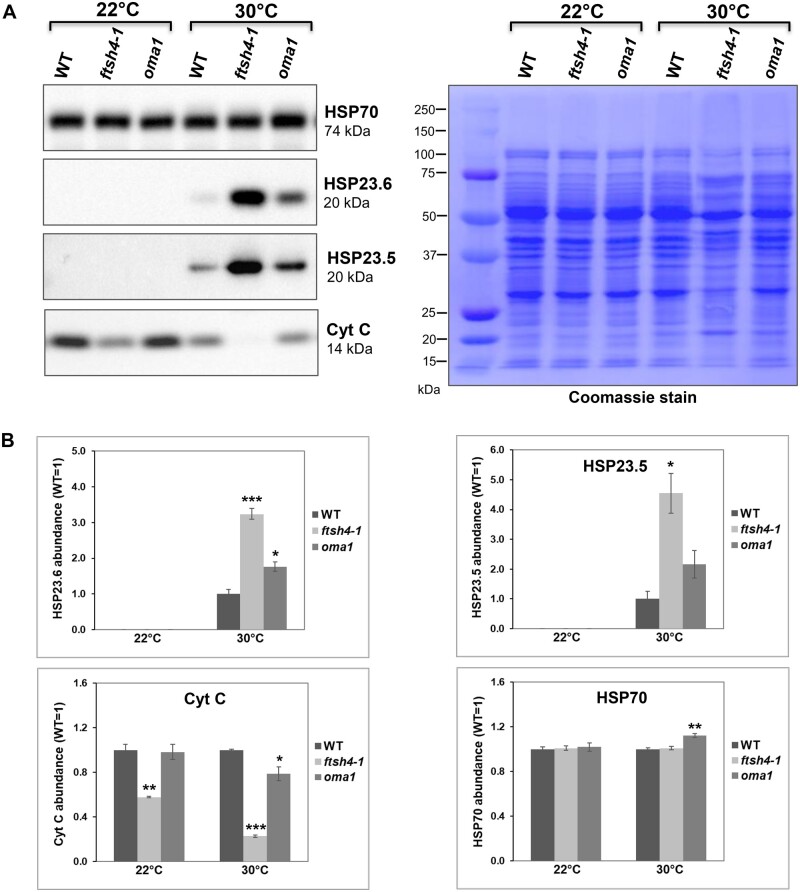
The threat of global warming makes uncovering mechanisms of plant tolerance to long-term moderate heat stress particularly important. We previously reported that Arabidopsis (Arabidopsis thaliana) plants lacking mitochondrial proteases FTSH4 or OMA1 suffer phenotypic changes under long-term stress of 30°C, while their growth at 22°C is not affected. Here we found that these morphological and developmental changes are associated with increased accumulation of insoluble mitochondrial protein aggregates that consist mainly of small heat-shock proteins (sHSPs). Greater accumulation of sHSPs in ftsh4 than oma1 corresponds with more severe phenotypic abnormalities. We showed that the proteolytic activity of FTSH4, and to a lesser extent of OMA1, as well as the chaperone function of FTSH4, is crucial for protecting mitochondrial proteins against aggregation. We demonstrated that HSP23.6 and NADH dehydrogenase subunit 9 present in aggregates are proteolytic substrates of FTSH4, and this form of HSP23.6 is also a substrate of OMA1 protease. In addition, we found that the activity of FTSH4 plays an important role during recovery from elevated to optimal temperatures. Isobaric tags for relative and absolute quantification (iTRAQ)-based proteomic analyses, along with identification of aggregation-prone proteins, implicated mitochondrial pathways affected by protein aggregation (e.g. assembly of complex I) and revealed that the mitochondrial proteomes of ftsh4 and oma1 plants are similarly adapted to long-term moderate heat stress. Overall, our data indicate that both FTSH4 and OMA1 increase the tolerance of plants to long-term moderate heat stress by reducing detergent-tolerant mitochondrial protein aggregation.


Figures

Figure 1
Figure 1
Accumulation of the Triton X-100-insoluble proteins in the ftsh4-1 and oma1 mitochondria under moderate heat stress (30°C). A, A schematic workflow for the studies of heat-prone protein aggregates. More details of the experiment are given in “Materials and methods”. B and C, Coomassie-stained 12% SDS–PAGE gels with Triton X-100-treated lysates of isolated mitochondria from 2-week-old WT, ftsh4-1, and oma1 plants grown either at optimal conditions (22°C) (B) or moderate heat stress (30°C) (C). D and E, show quantification of the abundance of proteins in the pellet versus total protein fraction using ImageJ (Fiji) and Coomassie-stained gels. The abundance values are given as relative to the value obtained for WT (set as 1). Mean (n = 3) ± sem. *P ≤ 0.05; **P ≤ 0.03, ***P ≤ 0.01. Statistical significance was assessed using two-tailed Student’s t test. sem, standard error of the mean.
Figure 2
Figure 2
Accumulation of the mitochondrial sHSP, NAD9, and RPS10 aggregates in the ftsh4-1 and oma1 plants grown under moderate heat stress (30°C). A, Relative abundance of the HSP23.5, HSP23.6, and HSP26.5 transcripts in plants grown under 30°C in comparison to the control plants (22°C) expressed as the Log2 ratio. The dashed lines indicate cutoff values ±1 (log2) of the ratio corresponding to the threshold levels for significant up- and downregulation of the transcripts. Data are the mean of minimum three independent biological replicates  ± sem. ***P ≤ 0.01. Statistical significance was assessed using two-tailed Student’s t test. B, Immunodetection of HSP23.6, HSP23.5, HSP26.5, NAD9, and RPS10 in the Triton X-100 insoluble (aggregated) protein fractions at 30°C. C, Immunodetection of HSP26.5, NAD9, and RPS10 in the soluble fraction of mitochondrial proteins at 22°C. The HSP23.6 and HSP23.5 proteins were undetectable under these conditions. Representative immunoblots of detected proteins are shown. Coomassie-stained membranes show equal protein loading. sem, standard error of the mean.
Figure 3
Figure 3
Steady-state levels of the HSP23.6, HSP23.5, CytC, and HSP70 proteins in mitochondria isolated from 2-week-old WT, ftsh4-1, and oma1 plants grown under optimal conditions (22°C) and moderate heat stress (30°C). A, Mitochondrial proteins were separated on SDS–PAGE gel and the abundance of HSP23.6, HSP23.5, CytC, and HSP70 proteins was assessed by immunoblotting. B, The abundance of the analyzed proteins was quantified densitometrically in ImageJ (Fiji) based on immunodetection of selected proteins and Coomassie-stained membrane as a loading control. The abundance values are given as relative to the value obtained for WT set as 1. Mean (n = 3) ± sem. *P ≤ 0.05; **P ≤ 0.03, ***P ≤ 0.01. Statistical significance was assessed using two-tailed Student’s t test.
Figure 4
Figure 4
In vitro degradation of HSP23.6, NAD9, TIM17-2, and HSP70 in the ftsh4-1 mitochondria in the absence or presence of in vitro-expressed FTSH4 or OMA1 proteases. Mitochondria were incubated in the digitonin-containing buffer with the addition of equal amount (4 µL) of insect-cell lysate containing FTSH4 or OMA1 or control lysate for the indicated time points. Representative immunoblots and Coomassie-stained membrane are presented. (Right) shows quantification of the abundance of the analyzed proteins. Protein amount was quantified densitometrically in ImageJ (Fiji) based on immunodetection with antibodies and Coomassie-stained membrane as a loading control. The abundance values are given as relative to the value obtained for time 0 h (set as 1). Mean (n = 5)  ± sem. *P < 0.05; **P  < 0.03; ***P  < 0.01. Statistical significance was assessed using two-tailed Student’s t test. The arrowhead indicates specific signal of NAD9.
Figure 5
Figure 5
The importance of a chaperone-like activity of FTSH4 under moderate heat stress (30°C). A, Immunodetection of selected proteins in the Triton X-100-treated mitochondria of WT, ftsh4-1, and FTSH4H486Y plants grown at 30°C. Representative immunoblots of detected proteins are shown. Coomassie-stained membrane shows equal protein loading. B, Morphology of 10-d-old seedlings of WT, ftsh4-1, and FTSH4H486Y grown on 0.5× MS at 30°C. Medium was supplemented with 1.5% sucrose. Scale bars indicate 1 cm.
Figure 6
Figure 6
In vivo degradation of HSP23.6 in the WT, ftsh4-1, and oma1 mitochondria. Plants were grown for 13 d under moderate heat stress (30°C) and then were transferred to optimal conditions (22°C) for the next 4 d. Mitochondria isolated from the 13-d-old plants from 30°C (13 d, 30°C, red font) and after 1, 3, and 4 d of a recovery period (+1 d, +3 d, and +4 d, 22°C, respectively) were treated with Triton X-100 to separate protein aggregates from soluble fractions. A, Total fraction of treated mitochondria; (B) Protein aggregates in the pellet fraction; (C) Soluble proteins in the supernatant fraction. The abundance of HSP23.6 and FTSH4 in the detergent insoluble and soluble fractions was determined by immunoblotting. Representative immunoblots and Coomassie-stained membranes are presented.
Figure 7
Figure 7
Involvement of FTSH4 and OMA1 in thermotolerance to a moderately high temperature. A, Phenotypes of WT, ftsh4-1, oma1, and mge2-1 seedlings after 8 d of recovery from the TMHT assay. The mge2-1 mutant was used as a positive control for the TMHT. The TMHT assay is schematically shown on the right. B, Phenotypes of WT, ftsh4-1, oma1, mge2-1, ftsh11, and hot1 seedlings after 10 d of recovery from the BT assay or after 14 d of recovery from the SAT or LAT assays. The schematic heat stress regimes of BT, SAT, and LAT assays are presented below the photographs. The hot1 mutant was used as a positive control for the BT, SAT, and LAT assays, while ftsh11 was a positive control for the SAT and LAT assay. Scale bars indicate 1 cm.
Figure 8
Figure 8
Visualization of the changes in the protein abundance of the complex I subunits in the ftsh4-1 and oma1 mitochondria based on the iTRAQ analysis. A, Protein changes in the ftsh4-1 mutant grown under 22°C and 30°C. B, Protein changes in the oma1 mutant grown under 22°C and 30°C. The Q module subunits are shown in the box of each panel. Blue color indicates a lowered abundance, yellow = an increased abundance, and gray = no difference in the abundance of the identified protein. The dashed line indicates the protein (GLDH) that is involved in the complex I assembly but is not a permanent component of it. More details are shown in Supplemental Table S2. Complex I architecture is based on Ivanova et al. (2019).

Similar articles

Cited by

References

    1. Adam Z, Aviv-Sharon E, Keren-Paz A, Naveh L, Rozenberg M, Savidor A, Chen J (2019) The chloroplast envelope protease FTSH11 - interaction with CPN60 and identification of potential substrates. Front Plant Sci 10: 428. - PMC - PubMed
    1. Balchin D, Hayer-Hartl M, Hartl FU (2016) In vivo aspects of protein folding and quality control. Science 353: aac4354. - PubMed
    1. Bender T, Lewrenz I, Franken S, Baitzel C, Voos W (2011) Mitochondrial enzymes are protected from stress-induced aggregation by mitochondrial chaperones and the Pim/LON protease. Mol Biol Cell 22: 541–554 - PMC - PubMed
    1. Borner GHH, Sherrier DJ, Weimar T, Michaelson LV, Hawkins ND, MacAskill A, Napier JA, Beale MH, Lilley KS, Dupree P (2005) Analysis of detergent-resistant membranes in Arabidopsis. Evidence for plasma membrane lipid rafts. Plant Physiol 137: 104–116 - PMC - PubMed
    1. Broquet AH, Thomas G, Masliah J, Trugnan G, Bachelet M (2003) Expression of the molecular chaperone Hsp70 in detergent-resistant microdomains correlates with its membrane delivery and release. J Biol Chem 278: 21601–21606 - PubMed

Publication types

MeSH terms