

Gut microbiota and short-chain fatty acid alterations in cachectic cancer patients
- PMID: 34609073
- PMCID: PMC8718054
- DOI: 10.1002/jcsm.12804
Gut microbiota and short-chain fatty acid alterations in cachectic cancer patients
Abstract
Background: Cancer cachexia is characterized by a negative energy balance, muscle and adipose tissue wasting, insulin resistance, and systemic inflammation. Because of its strong negative impact on prognosis and its multifactorial nature that is still not fully understood, cachexia remains an important challenge in the field of cancer treatment. Recent animal studies indicate that the gut microbiota is involved in the pathogenesis and manifestation of cancer cachexia, but human data are lacking. The present study investigates gut microbiota composition, short-chain fatty acids (SCFA), and inflammatory parameters in human cancer cachexia.
Methods: Faecal samples were prospectively collected in patients (N = 107) with pancreatic cancer, lung cancer, breast cancer, or ovarian cancer. Household partners (N = 76) of the patients were included as healthy controls with similar diet and environmental conditions. Patients were classified as cachectic if they lost >5% body weight in the last 6 months. Gut microbiota composition was analysed by sequencing of the 16S rRNA V4 gene region. Faecal SCFA levels were quantified by gas chromatography. Faecal calprotectin was assessed with enzyme-linked immunosorbent assay. Serum C-reactive protein and leucocyte counts were retrieved from medical records.
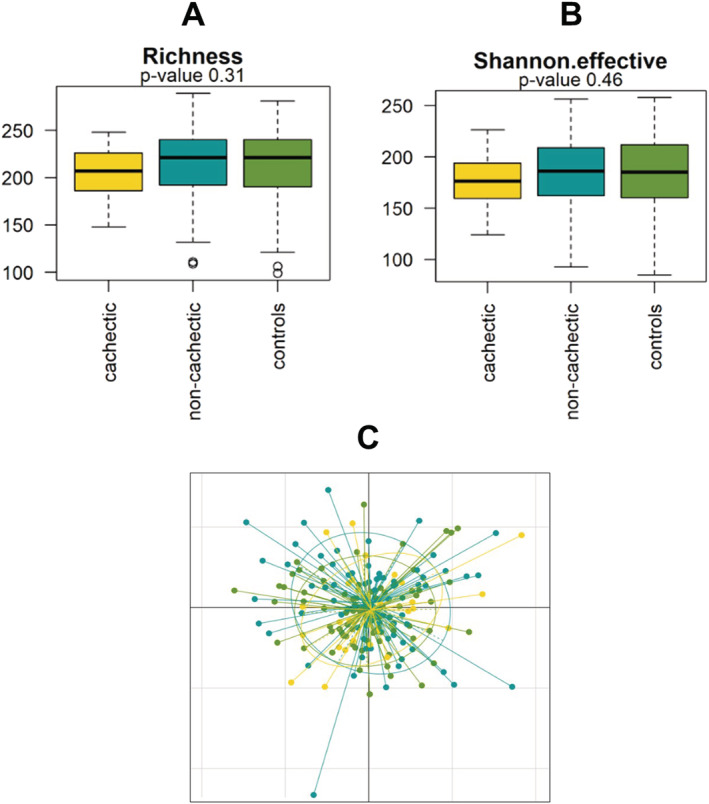
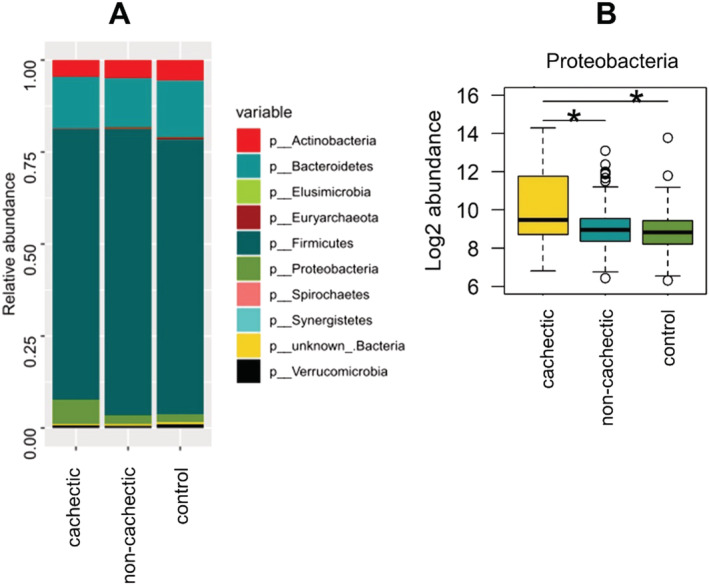
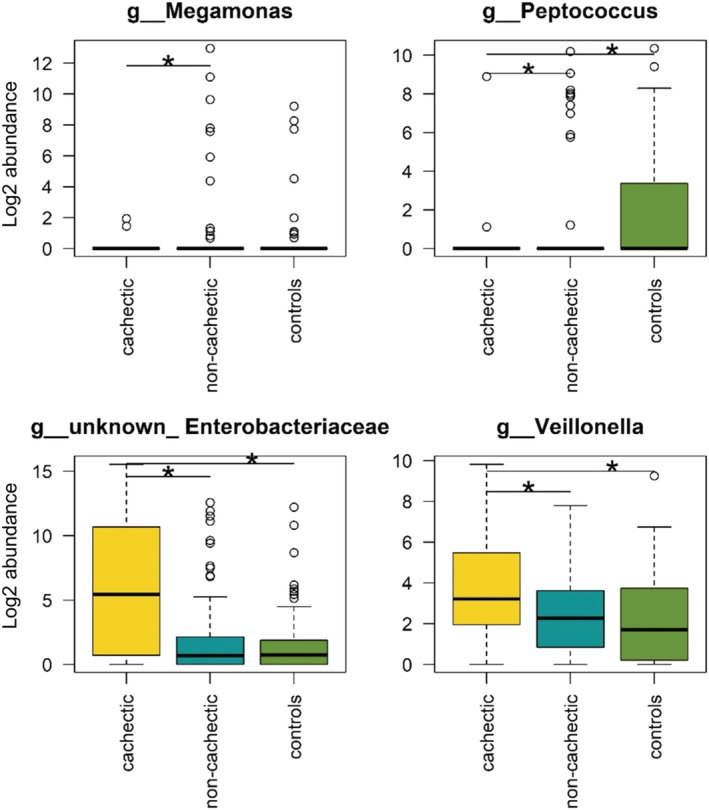
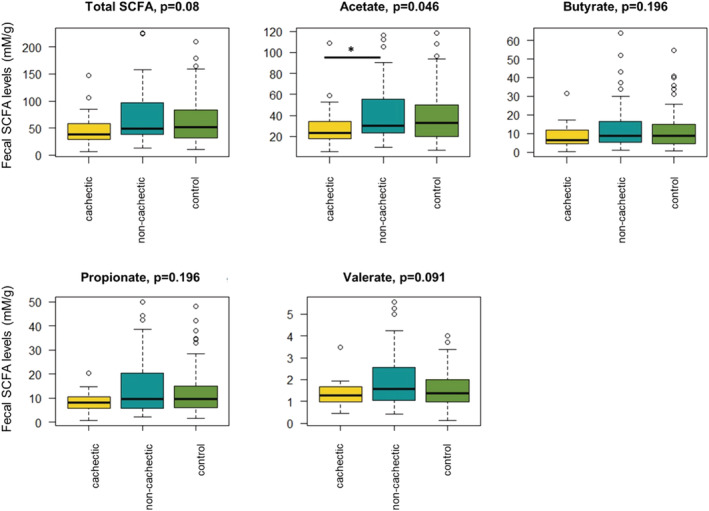
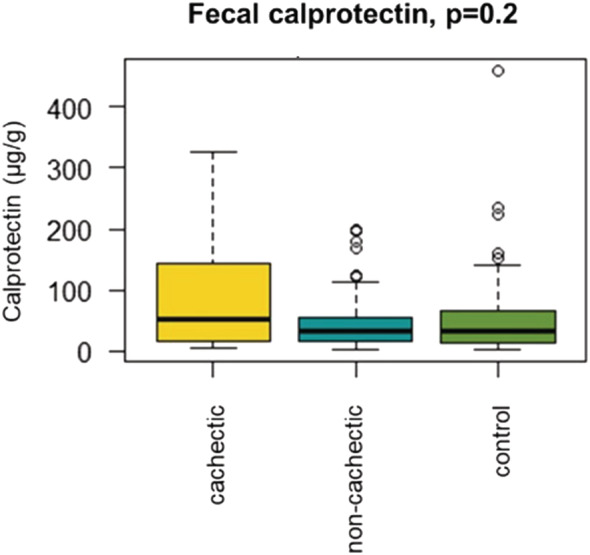
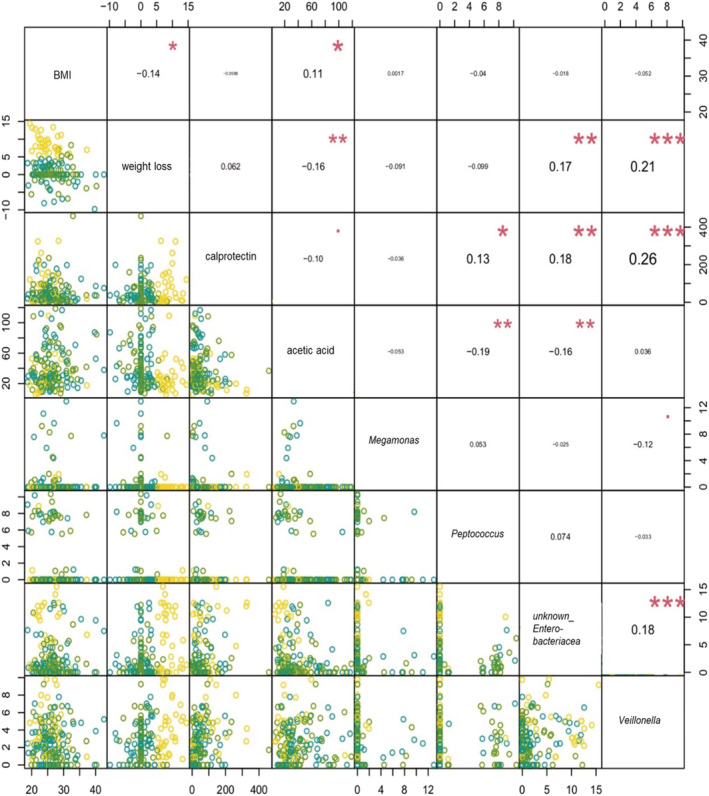
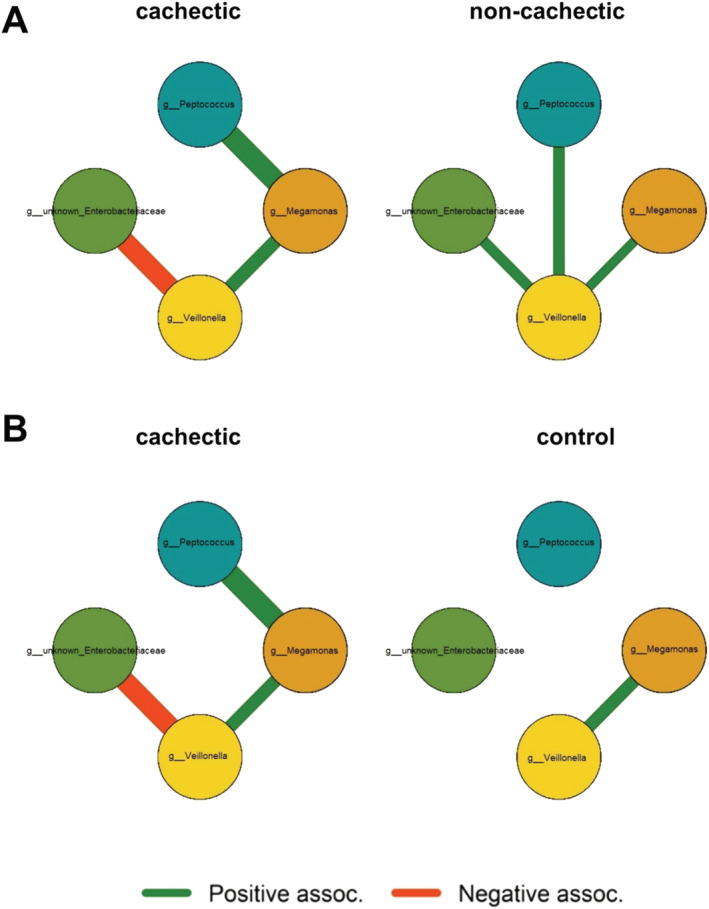
Results: Cachexia prevalence was highest in pancreatic cancer (66.7%), followed by ovarian cancer (25%), lung cancer (20.8%), and breast cancer (17.3%). Microbial α-diversity was not significantly different between cachectic cancer patients (N = 33), non-cachectic cancer patients (N = 74), or healthy controls (N = 76) (species richness P = 0.31; Shannon effective index P = 0.46). Community structure (β-diversity) tended to differ between these groups (P = 0.053), although overall differences were subtle and no clear clustering of samples was observed. Proteobacteria (P < 0.001), an unknown genus from the Enterobacteriaceae family (P < 0.01), and Veillonella (P < 0.001) were more abundant among cachectic cancer patients. Megamonas (P < 0.05) and Peptococcus (P < 0.001) also showed differential abundance. Faecal levels of all SCFA tended to be lower in cachectic cancer patients, but only acetate concentrations were significantly reduced (P < 0.05). Faecal calprotectin levels were positively correlated with the abundance of Peptococcus, unknown Enterobacteriaceae, and Veillonella. We also identified several correlations and interactions between clinical and microbial parameters.
Conclusions: This clinical study provided the first insights into the alterations of gut microbiota composition and SCFA levels that occur in cachectic cancer patients and how they are related to inflammatory parameters. These results pave the way for further research examining the role of the gut microbiota in cancer cachexia and its potential use as therapeutic target.
Keywords: Breast cancer; Cachexia; Inflammation; Lung cancer; Pancreatic cancer; Weight loss.
© 2021 The Authors. Journal of Cachexia, Sarcopenia and Muscle published by John Wiley & Sons Ltd on behalf of Society on Sarcopenia, Cachexia and Wasting Disorders.
Conflict of interest statement
R.A. and M.L.S. have received institutional research funding from Servier, all outside the submitted work. D.P.J.v.D. was supported by the Netherlands Organization for Scientific Research (NWO Grant 022.003.011). A.v.H. is employed by Danone Nutricia Research. All other authors have no conflicts of interest.
Figures
References
-
- Argiles JM, Busquets S, Stemmler B, López‐Soriano FJ. Cancer cachexia: understanding the molecular basis. Nat Rev Cancer 2014;14:754–762. - PubMed
-
- Fearon K, Arends J, Baracos V. Understanding the mechanisms and treatment options in cancer cachexia. Nat Rev Clin Oncol 2013;10:90–99. - PubMed
-
- Tremaroli V, Backhed F. Functional interactions between the gut microbiota and host metabolism. Nature 2012;489:242–249. - PubMed
Publication types
MeSH terms
Substances
LinkOut - more resources
Full Text Sources
Medical
Research Materials
