Observational Study
. 2022 May;303(2):444-454.
doi: 10.1148/radiol.2021211746. Epub 2021 Oct 5.

CT Lung Abnormalities after COVID-19 at 3 Months and 1 Year after Hospital Discharge

Affiliations
Observational Study

CT Lung Abnormalities after COVID-19 at 3 Months and 1 Year after Hospital Discharge

Bavithra Vijayakumar et al. Radiology. 2022 May.

Abstract

Background Data on the long-term pulmonary sequelae in COVID-19 are lacking. Purpose To assess symptoms, functional impairment, and residual pulmonary abnormalities on serial chest CT scans in COVID-19 survivors discharged from hospital at up to 1-year follow-up. Materials and Methods Adult patients with COVID-19 discharged between March 2020 and June 2020 were prospectively evaluated at 3 months and 1 year through systematic assessment of symptoms, functional impairment, and thoracic CT scans as part of the PHENOTYPE study, an observational cohort study in COVID-19 survivors. Lung function testing was limited to participants with CT abnormalities and/or persistent breathlessness. Bonferroni correction was used. Results Eighty participants (mean age, 59 years ± 13 [SD]; 53 men) were assessed. At outpatient review, persistent breathlessness was reported in 37 of the 80 participants (46%) and cough was reported in 17 (21%). CT scans in 73 participants after discharge (median, 105 days; IQR, 95-141 days) revealed persistent abnormalities in 41 participants (56%), with ground-glass opacification (35 of 73 participants [48%]) and bands (27 of 73 participants [37%]) predominating. Unequivocal signs indicative of established fibrosis (ie, volume loss and/or traction bronchiectasis) were present in nine of 73 participants (12%). Higher admission serum C-reactive protein (in milligrams per liter), fibrinogen (in grams per deciliter), urea (millimoles per liter), and creatinine (micromoles per liter) levels; longer hospital stay (in days); older age (in years); and requirement for invasive ventilation were associated with CT abnormalities at 3-month follow-up. Thirty-two of 41 participants (78%) with abnormal findings at 3-month follow-up CT underwent repeat imaging at a median of 364 days (range, 360-366 days), with 26 (81%) showing further radiologic improvement (median, 18%; IQR, 10%-40%). Conclusion CT abnormalities were common at 3 months after COVID-19 but with signs of fibrosis in a minority. More severe acute disease was linked with CT abnormalities at 3 months. However, radiologic improvement was seen in the majority at 1-year follow-up. ClinicalTrials.gov identifier: NCT04459351. © RSNA, 2022 Online supplemental material is available for this article.


Conflict of interest statement

Disclosures of Conflicts of Interest: B.V. Grant to institution from Joint Research Committee. J.T. No relevant relationships. A.D. Consulting fees from Boehringer Ingelheim and Vicore. K.E.J.P. No relevant relationships. C.M.O. No relevant relationships. S.R.D. Fees for course tutor (Boehringer-Ingelheim Interstitial Lung Disease courses); fees for Oversight Ctte Group membership—GlaxoSmithKline (GSK3196165 contRAst Phase III trial); consultancy fees from Sensyne Health Group. P.L.S. No relevant relationships.

Figures

None
Graphical abstract
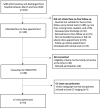
Study flowchart shows enrollment and recruitment.
Figure 1:
Study flowchart shows enrollment and recruitment.
Axial unenhanced CT scan in a 48-year-old man 3 months after hospital
discharge for COVID-19. Image shows predominant ground-glass opacities and a
few delicate band opacities, principally in the lower lobes. There was no
traction bronchiectasis or reticulation on any image section. (Note that the
short segment of airway captured in longitudinal section in the right lower
lobe was nondilated on sequential volumetric images sections.)
Figure 2:
Axial unenhanced CT scan in a 48-year-old man 3 months after hospital discharge for COVID-19. Image shows predominant ground-glass opacities and a few delicate band opacities, principally in the lower lobes. There was no traction bronchiectasis or reticulation on any image section. (Note that the short segment of airway captured in longitudinal section in the right lower lobe was nondilated on sequential volumetric images sections.)
Axial unenhanced CT scan at the level of the carina in a 56-year-old
man 3 months after discharge for COVID-19. Image shows multiple linear and
curvilinear bands (yellow arrows) and more limited, subtle ground-glass
opacification. There was no evidence of traction bronchiectasis. Note the
normally tapering airway (white arrows) in the anterior segment of the left
upper lobe.
Figure 3:
Axial unenhanced CT scan at the level of the carina in a 56-year-old man 3 months after discharge for COVID-19. Image shows multiple linear and curvilinear bands (yellow arrows) and more limited, subtle ground-glass opacification. There was no evidence of traction bronchiectasis. Note the normally tapering airway (white arrows) in the anterior segment of the left upper lobe.
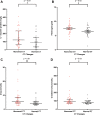
Scatterplots show relationship between admission blood parameters (A)
C-reactive protein level, (B) fibrinogen level, (C) urea level, and (D)
creatinine level in participants with and without CT changes at 3-month
follow-up. Comparisons were made using the two-sample Student t test and
Mann-Whitney U test. Medians and IQRs are shown. * = P ≤ .05,
** = P ≤ .01.
Figure 4:
Scatterplots show relationship between admission blood parameters (A) C-reactive protein level, (B) fibrinogen level, (C) urea level, and (D) creatinine level in participants with and without CT changes at 3-month follow-up. Comparisons were made using the two-sample Student t test and Mann-Whitney U test. Medians and IQRs are shown. * = P ≤ .05, ** = P ≤ .01.
Paired axial unenhanced CT scans in an 83-year-old woman at (A) 3
months and (B) 1 year after hospital discharge for COVID-19. Images show
significant (albeit incomplete) and progressive resolution of ground-glass
opacification and band opacities in the lower lobes at 1-year
follow-up.
Figure 5:
Paired axial unenhanced CT scans in an 83-year-old woman at (A) 3 months and (B) 1 year after hospital discharge for COVID-19. Images show significant (albeit incomplete) and progressive resolution of ground-glass opacification and band opacities in the lower lobes at 1-year follow-up.
Paired axial unenhanced CT scans in a 59-year-old man at (A) 3 months
and (B) 1 year after hospital discharge for COVID-19. Images show widespread
residual bilateral ground-glass opacification, a few band opacities, and,
importantly, evidence of traction bronchiectasis in the middle and left
lower lobes (arrow in A) at 3 months. There is a reduction in the extent of
ground-glass opacification and bands but with persistent traction
brochiectasis (arrows in B) at 1-year follow-up.
Figure 6:
Paired axial unenhanced CT scans in a 59-year-old man at (A) 3 months and (B) 1 year after hospital discharge for COVID-19. Images show widespread residual bilateral ground-glass opacification, a few band opacities, and, importantly, evidence of traction bronchiectasis in the middle and left lower lobes (arrow in A) at 3 months. There is a reduction in the extent of ground-glass opacification and bands but with persistent traction brochiectasis (arrows in B) at 1-year follow-up.
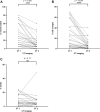
Graphs compare changes in CT scores at 3 months (CT 1) and 1 year (CT
2) with specific changes in (A) overall CT abnormality, (B) ground-glass
(GG) opacification, and (C) bands. Comparison was performed with the paired
Wilcoxon signed-rank test. ns = not significant.
**** = P ≤ .0001.
Figure 7:
Graphs compare changes in CT scores at 3 months (CT 1) and 1 year (CT 2) with specific changes in (A) overall CT abnormality, (B) ground-glass (GG) opacification, and (C) bands. Comparison was performed with the paired Wilcoxon signed-rank test. ns = not significant. **** = P ≤ .0001.

References

    1. WHO announces COVID-19 outbreak a pandemic . https://www.euro.who.int/en/health-topics/health-emergencies/coronavirus.... Published December 3, 2020. Accessed May 22, 2021 .
    1. WHO Coronavirus Disease (COVID-19) Dashboard . https://covid19.who.int/. Accessed January 9, 2021 .
    1. Mandal S , Barnett J , Brill SE , et al. . ‘Long-COVID’: a cross-sectional study of persisting symptoms, biomarker and imaging abnormalities following hospitalisation for COVID-19 . Thorax 2021. ; 76 ( 4 ): 396 – 398 . - PMC - PubMed
    1. Carfì A , Bernabei R , Landi F; . Gemelli Against COVID-19 Post-Acute Care Study Group. Persistent Symptoms in Patients After Acute COVID-19 . JAMA 2020. ; 324 ( 6 ): 603 – 605 . - PMC - PubMed
    1. Stavem K , Ghanima W , Olsen MK , Gilboe HM , Einvik G . Persistent symptoms 1.5-6 months after COVID-19 in non-hospitalised subjects: a population-based cohort study . Thorax 2021. ; 76 ( 4 ): 405 – 407 . - PMC - PubMed

Publication types

Associated data