Assessment of the aortic wall histological changes with ageing
- PMID: 34609411
- PMCID: PMC8597368
- DOI: 10.47162/RJME.62.1.08
Assessment of the aortic wall histological changes with ageing
Abstract
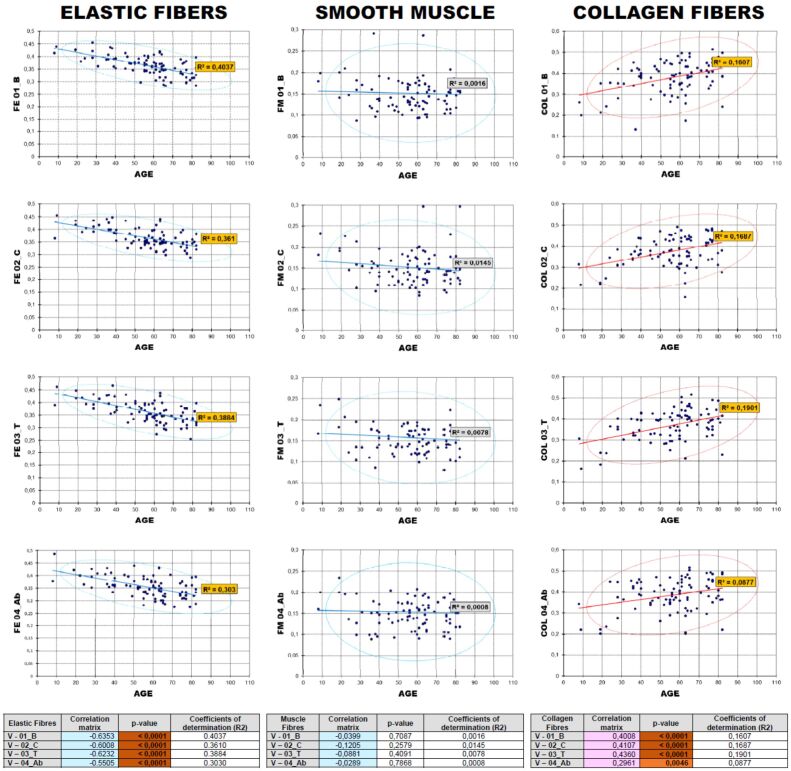
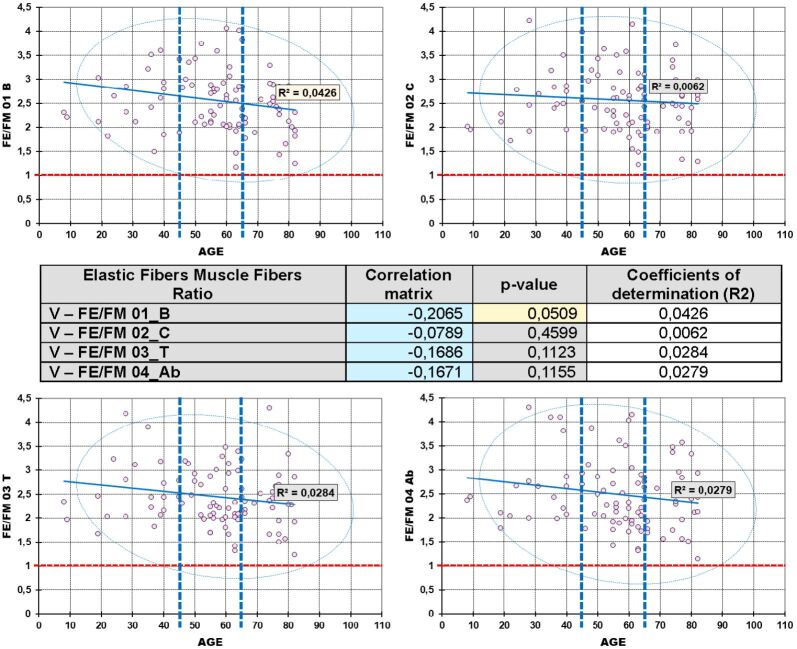
Aim: The authors aimed to quantitatively assess the variation with age of three of the main components of the aortic wall, namely elastic fibers (FE) and collagen fibers [FC(COL)], and smooth muscle cells (SMCs).
Materials and methods: Four aortic cross sections (base, cross, thoracic, abdominal) were collected during autopsy from 90 cases of all ages, processed using the classical histopathological (HP) technique (formalin fixation and paraffin embedding) and stained with Orcein and Goldner's trichrome. The obtained histological slides were transformed into virtual slides. Quantitative measurements of the three components were made on identical regions of interest (ROIs) selected from two-paired slides stained with the above-mentioned techniques using custom-made software, developed in MATLAB (MathWorks, USA).
Results and discussions: FE revealed an obvious decreasing general trend with age, present at all four levels of investigation. Smooth muscle fibers (FM) density showed almost no variation with age regardless of the level at which the measurement was made. FC(COL) density had an obvious increasing trend with age, expressed in all four aortic regions FE densities and FM densities were higher in men than in women, while FC(COL) densities were higher in women than in men in three of the aortic regions excepting, in all cases, the cross region.
Conclusions: There were differences between men and women concerning the composition of aortic wall cellular and extracellular compartments. FE and FC(COL) dominated the age-related remodeling process of the aortic wall. The process evolved in the same way in all regions of the aorta. Studies need to be continued to define more clearly this complex process of vascular wall remodeling with aging.
Conflict of interest statement
The authors declare that they have no conflict of interests.
Figures


Similar articles
-
Assessment of the aortic tunica media histological changes in relation with the cause of death.Rom J Morphol Embryol. 2023 Jul-Sep;64(3):399-410. doi: 10.47162/RJME.64.3.11. Rom J Morphol Embryol. 2023. PMID: 37867357 Free PMC article.
-
Remodeling of the aortic wall layers with ageing.Rom J Morphol Embryol. 2022 Jan-Mar;63(1):71-82. doi: 10.47162/RJME.63.1.07. Rom J Morphol Embryol. 2022. PMID: 36074670 Free PMC article.
-
Anatomical remodeling of the aortic wall in relation with the cause of death.Rom J Morphol Embryol. 2021 Jan-Mar;62(1):19-40. doi: 10.47162/RJME.62.1.03. Rom J Morphol Embryol. 2021. PMID: 34609406 Free PMC article.
-
Elastic fibers and biomechanics of the aorta: Insights from mouse studies.Matrix Biol. 2020 Jan;85-86:160-172. doi: 10.1016/j.matbio.2019.03.001. Epub 2019 Mar 15. Matrix Biol. 2020. PMID: 30880160 Free PMC article. Review.
-
Viscoelasticity of the vessel wall: the role of collagen and elastic fibers.Crit Rev Biomed Eng. 2001;29(3):279-301. doi: 10.1615/critrevbiomedeng.v29.i3.10. Crit Rev Biomed Eng. 2001. PMID: 11730097 Review.
Cited by
-
Aging related decreases in NM myosin expression and contractility in a resistance vessel.Front Physiol. 2024 May 14;15:1411420. doi: 10.3389/fphys.2024.1411420. eCollection 2024. Front Physiol. 2024. PMID: 38808359 Free PMC article.
-
Ascending Aorta Diameter Changes after Aortic Valve Replacement in Elderly Patients with Aortic Valve Stenosis.Cardiol Res Pract. 2022 Sep 10;2022:5509364. doi: 10.1155/2022/5509364. eCollection 2022. Cardiol Res Pract. 2022. PMID: 36124293 Free PMC article.
-
Assessment of the aortic tunica media histological changes in relation with the cause of death.Rom J Morphol Embryol. 2023 Jul-Sep;64(3):399-410. doi: 10.47162/RJME.64.3.11. Rom J Morphol Embryol. 2023. PMID: 37867357 Free PMC article.
-
Remodeling of the aortic wall layers with ageing.Rom J Morphol Embryol. 2022 Jan-Mar;63(1):71-82. doi: 10.47162/RJME.63.1.07. Rom J Morphol Embryol. 2022. PMID: 36074670 Free PMC article.
References
-
- Fortier A, Gullapalli V, Mirshams RA. Review of biomechanical studies of arteries and their effect on stent performance. IJC Heart Vessels. 2014;4:12–18.
-
- Laurent S, Boutouyrie P, Lacolley P. Structural and genetic bases of arterial stiffness. Hypertension. 2005;45(6):1050–1055. - PubMed
-
- Gallagher PJ, van der Wal AC. In: Histology for pathologists. 5. Mills SE, editor. Philadelphia PA USA: Wolters Kluwer Health/Lippincott Williams & Wilkins (LWW); 2019. Blood vessels; pp. 190–215.
-
- Kentish JC. In: Gray’s Anatomy the anatomical basis of clinical practice. 40. Stranding S, editor. Philadelphia PA USA: Elsevier-Churchill Livingstone; 2008. Smooth muscle and the cardiovascular and lymphatic systems; pp. 127–144.
MeSH terms
Substances
LinkOut - more resources
Full Text Sources
Medical
Research Materials
Miscellaneous