. 2021 Oct 5;326(13):1286-1298.
doi: 10.1001/jama.2021.15187.

Trends in Cardiovascular Risk Factors in US Adults by Race and Ethnicity and Socioeconomic Status, 1999-2018

Affiliations

Trends in Cardiovascular Risk Factors in US Adults by Race and Ethnicity and Socioeconomic Status, 1999-2018

Jiang He et al. JAMA. .

Abstract

Importance: After decades of decline, the US cardiovascular disease mortality rate flattened after 2010, and racial and ethnic differences in cardiovascular disease mortality persisted.

Objective: To examine 20-year trends in cardiovascular risk factors in the US population by race and ethnicity and by socioeconomic status.

Design, setting, and participants: A total of 50 571 participants aged 20 years or older from the 1999-2018 National Health and Nutrition Examination Surveys, a series of cross-sectional surveys in nationally representative samples of the US population, were included.

Exposures: Calendar year, race and ethnicity, education, and family income.

Main outcomes and measures: Age- and sex-adjusted means or proportions of cardiovascular risk factors and estimated 10-year risk of atherosclerotic cardiovascular disease were calculated for each of 10 two-year cycles.

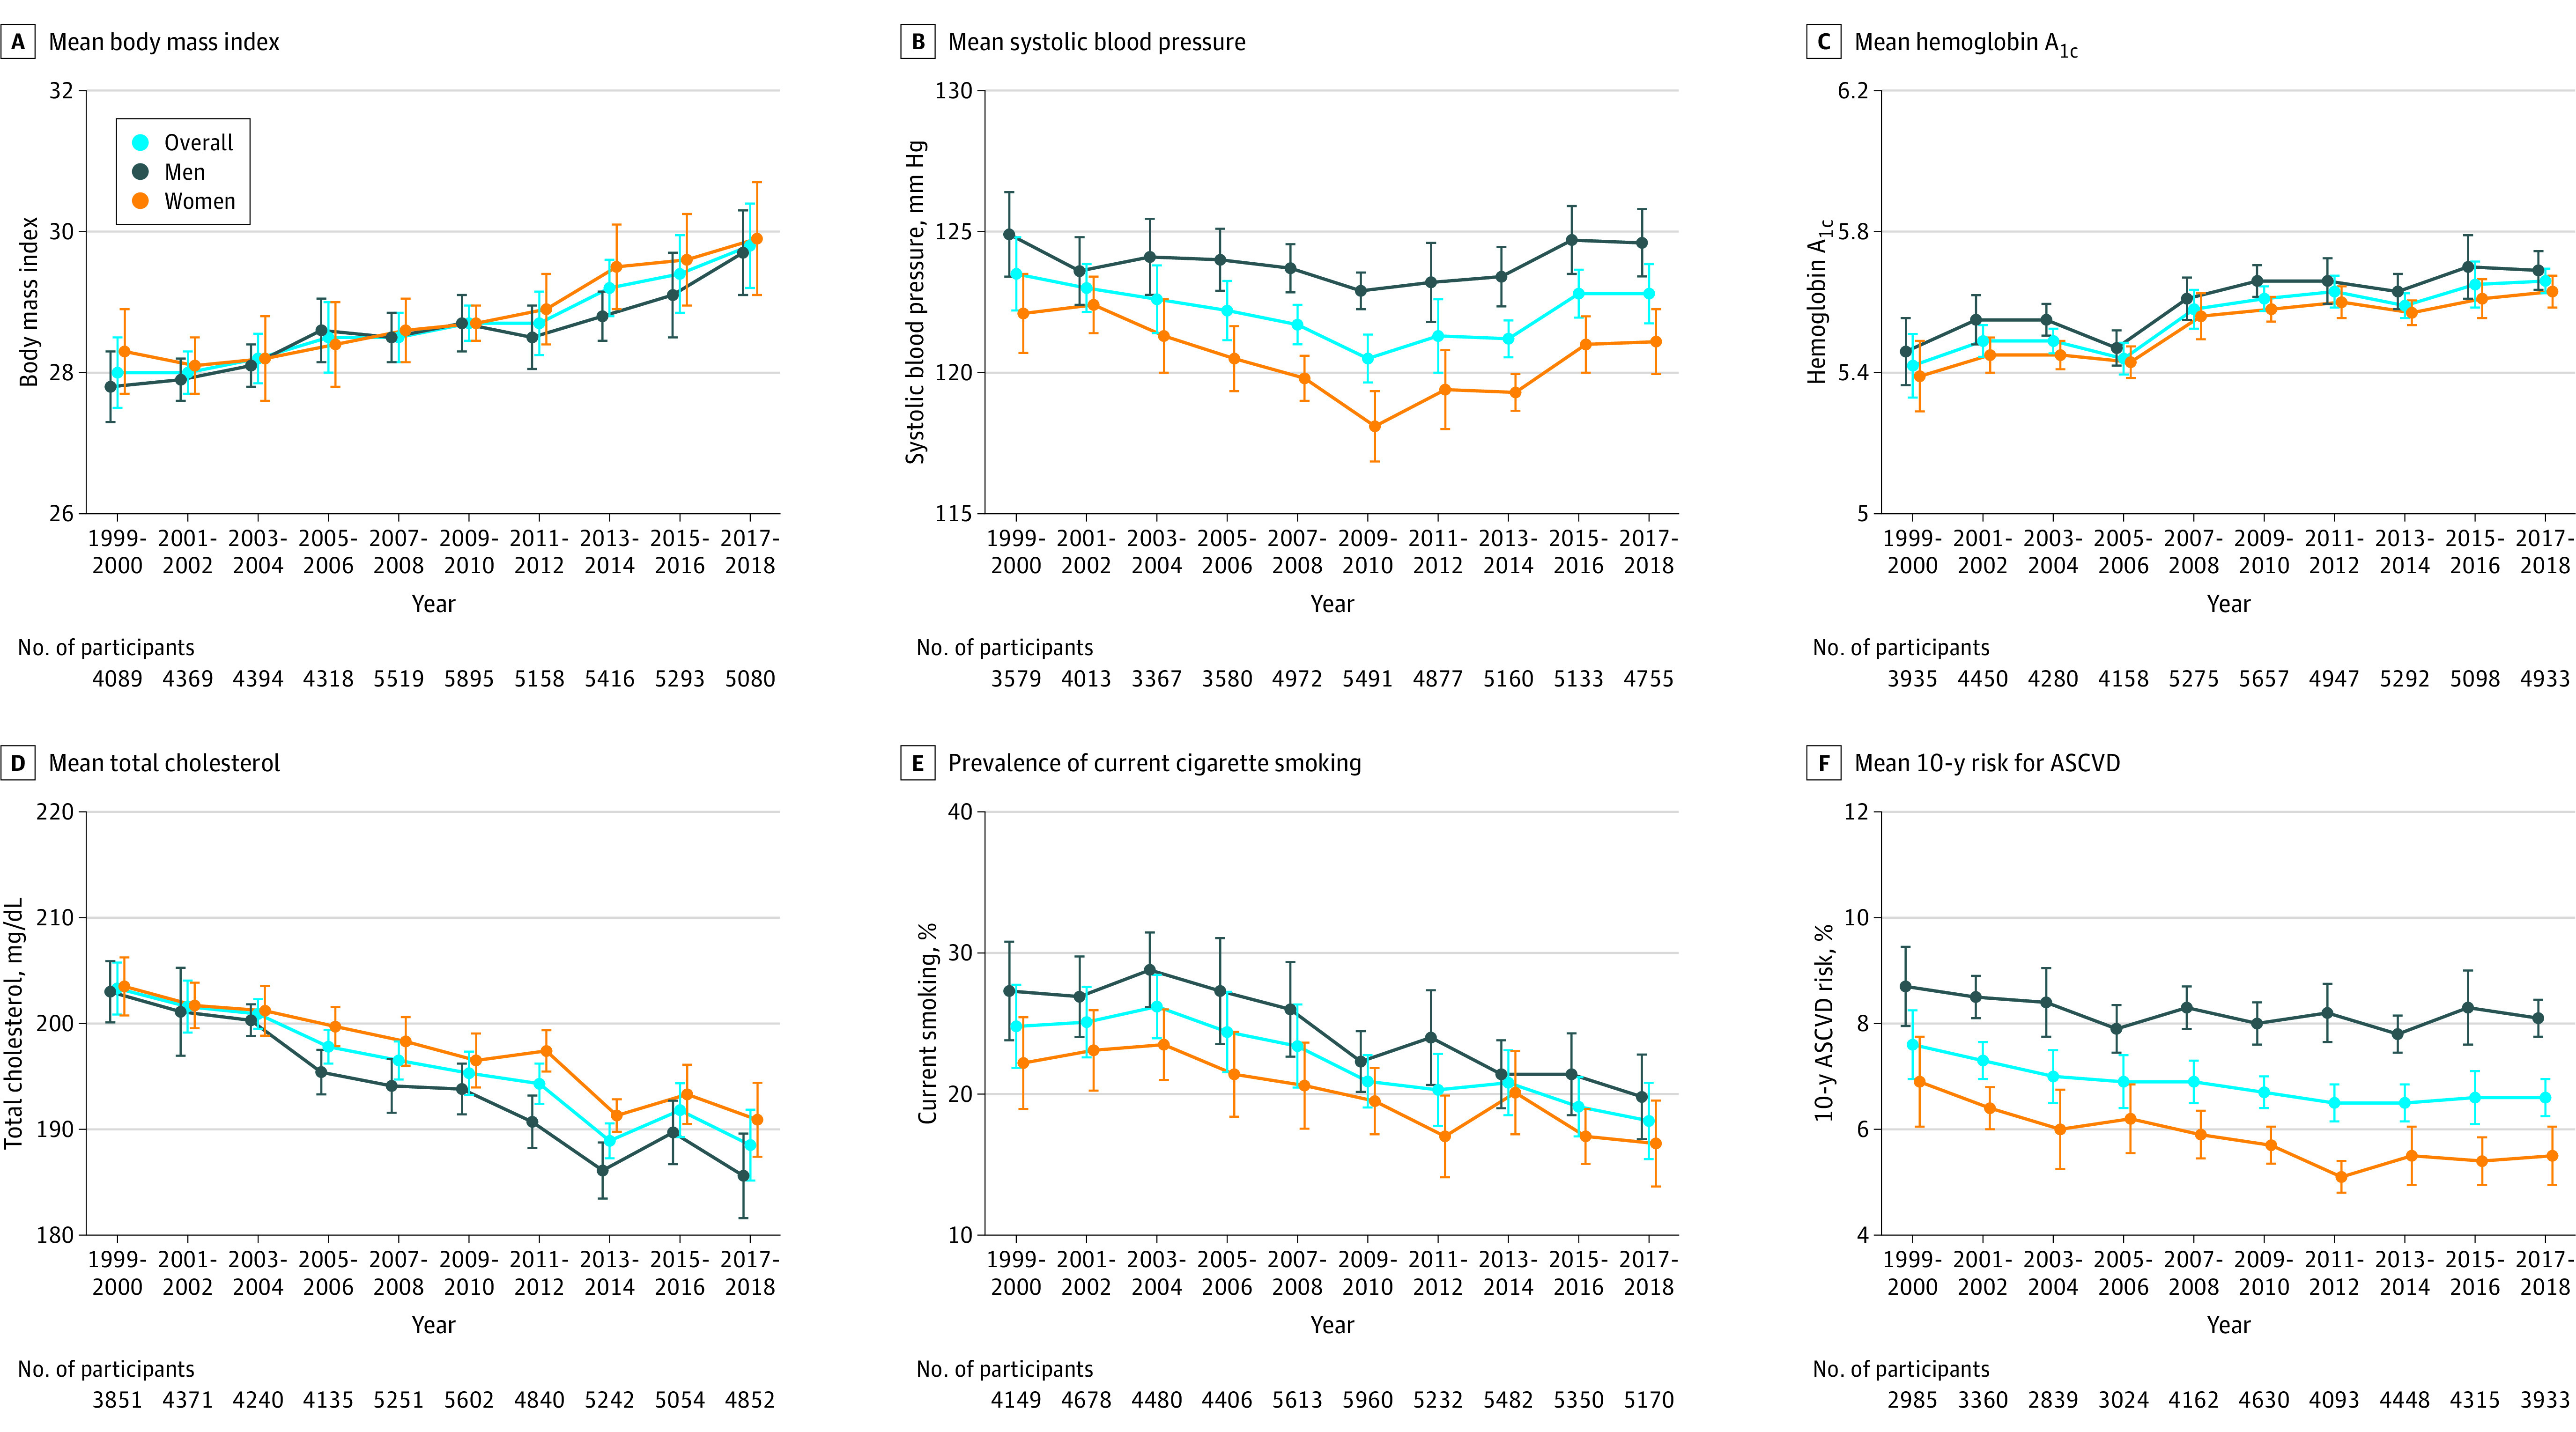
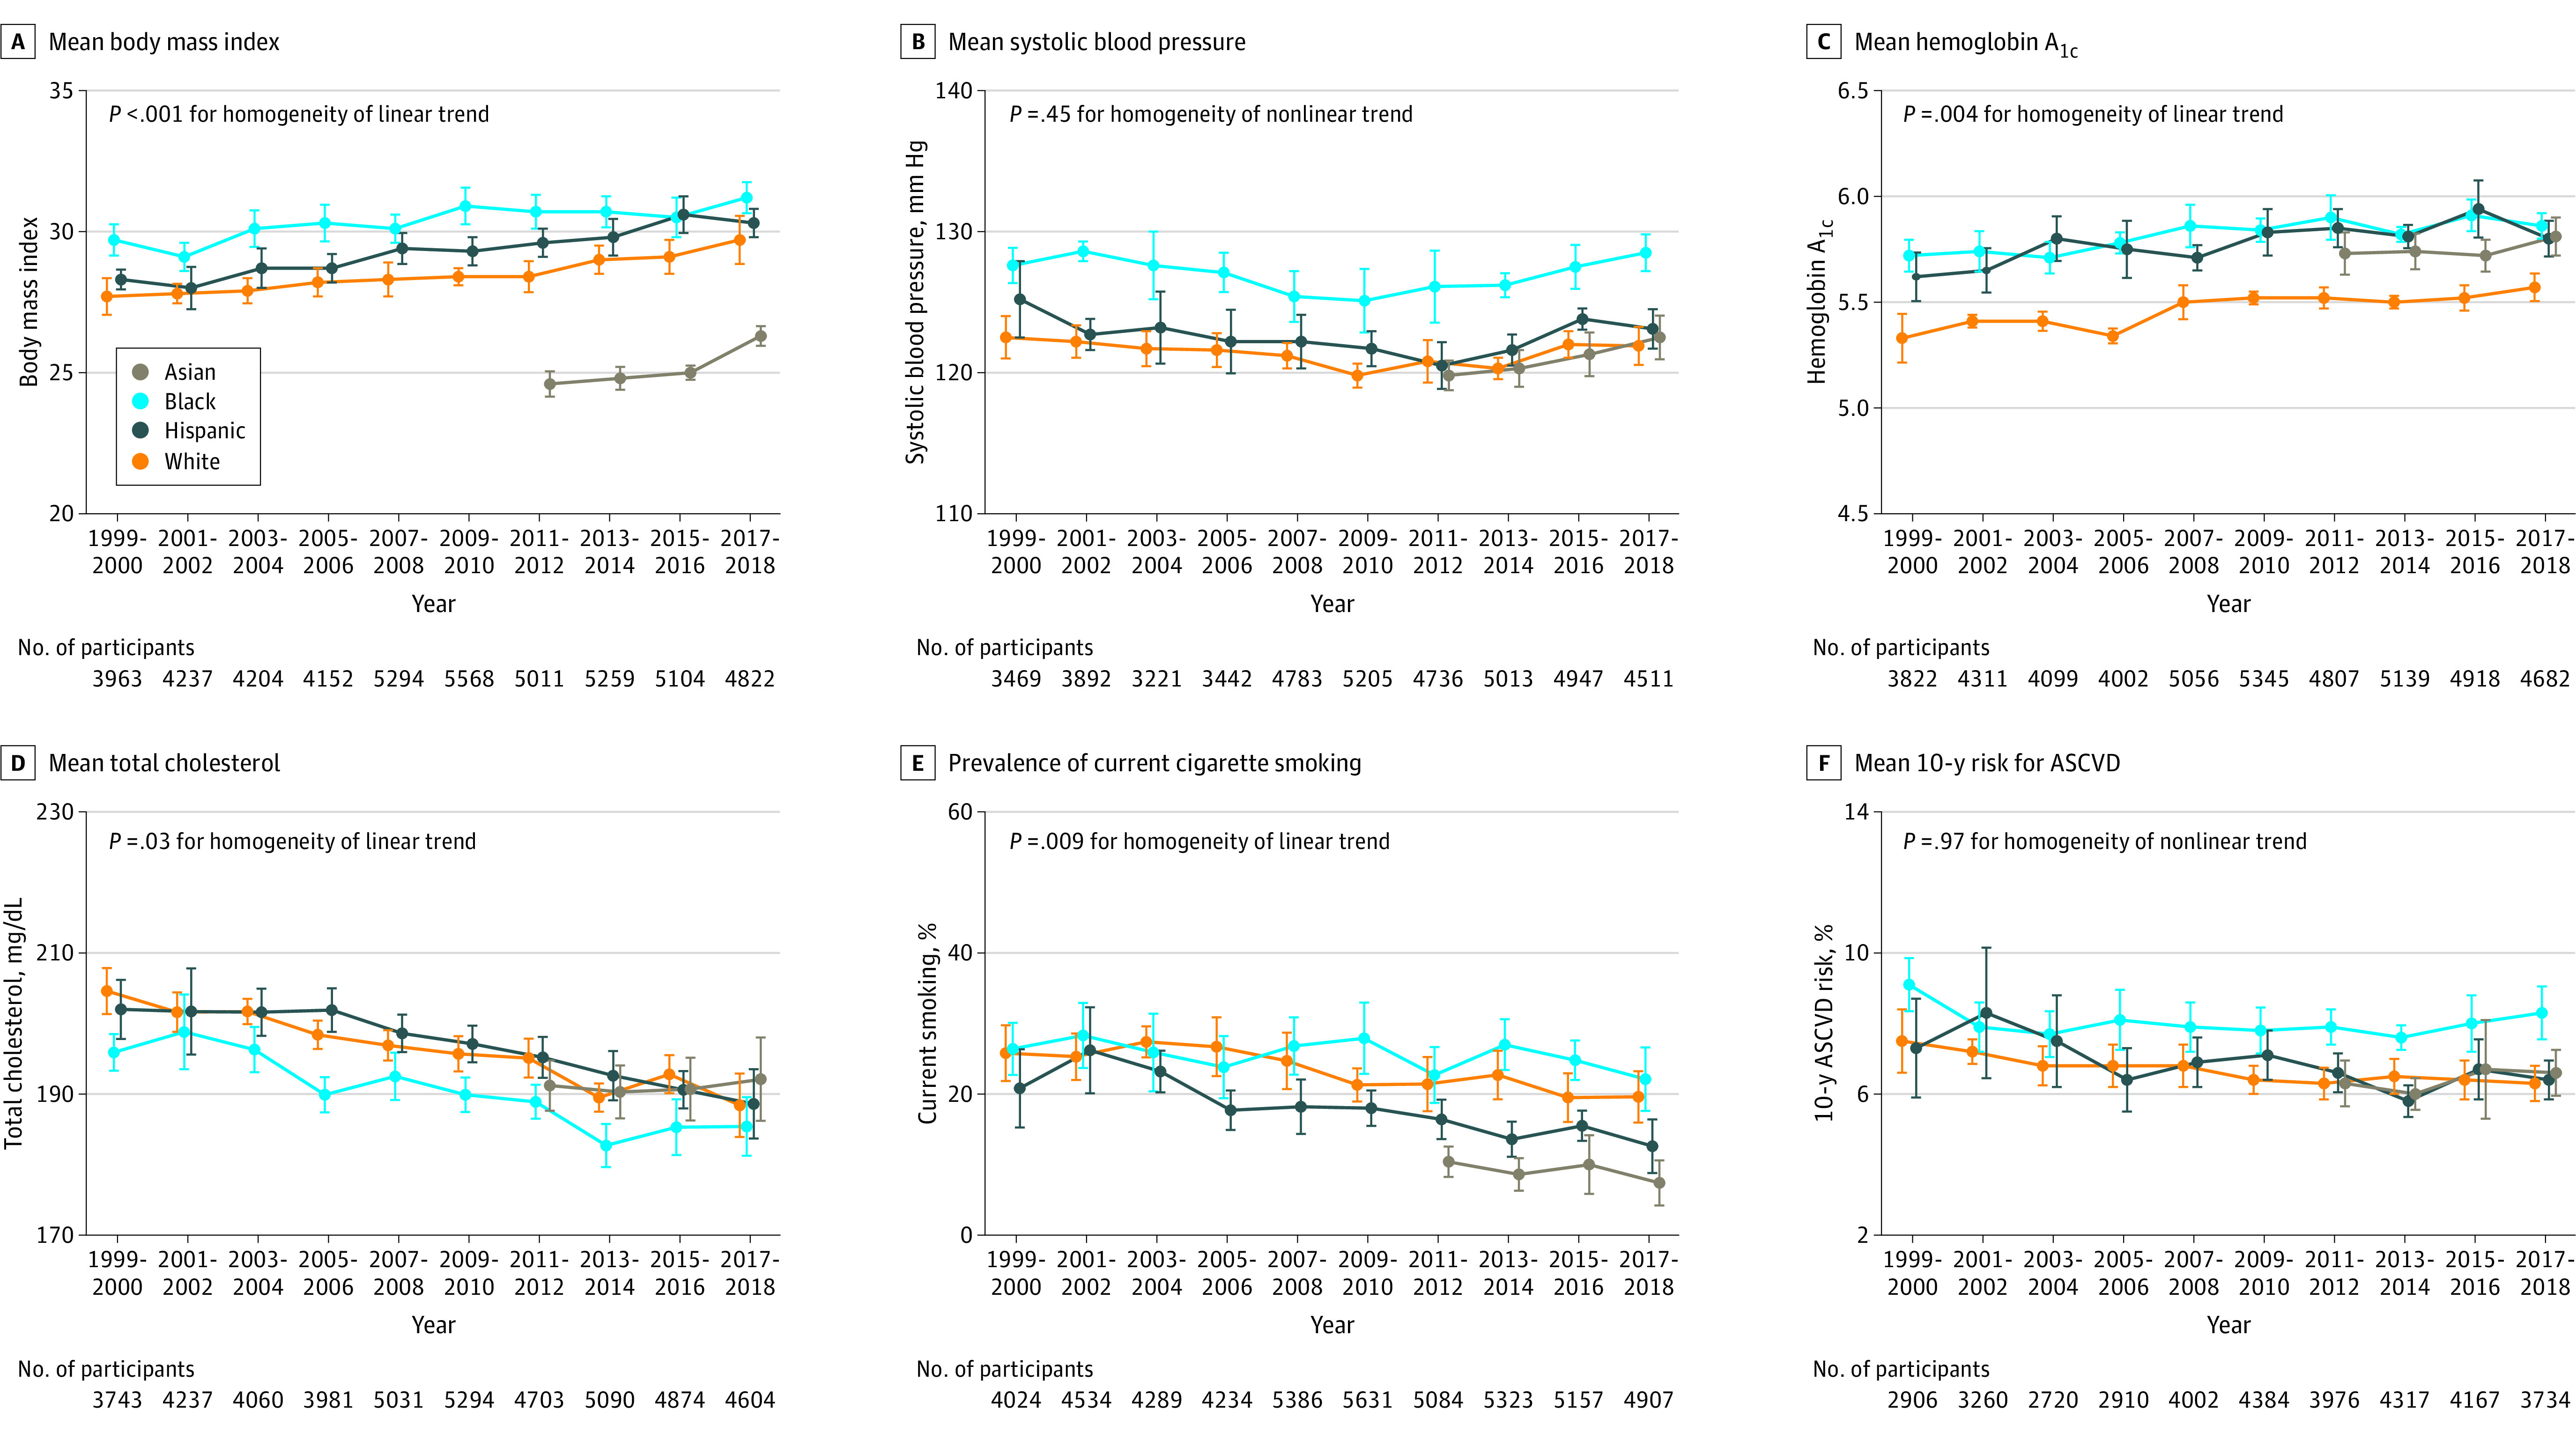
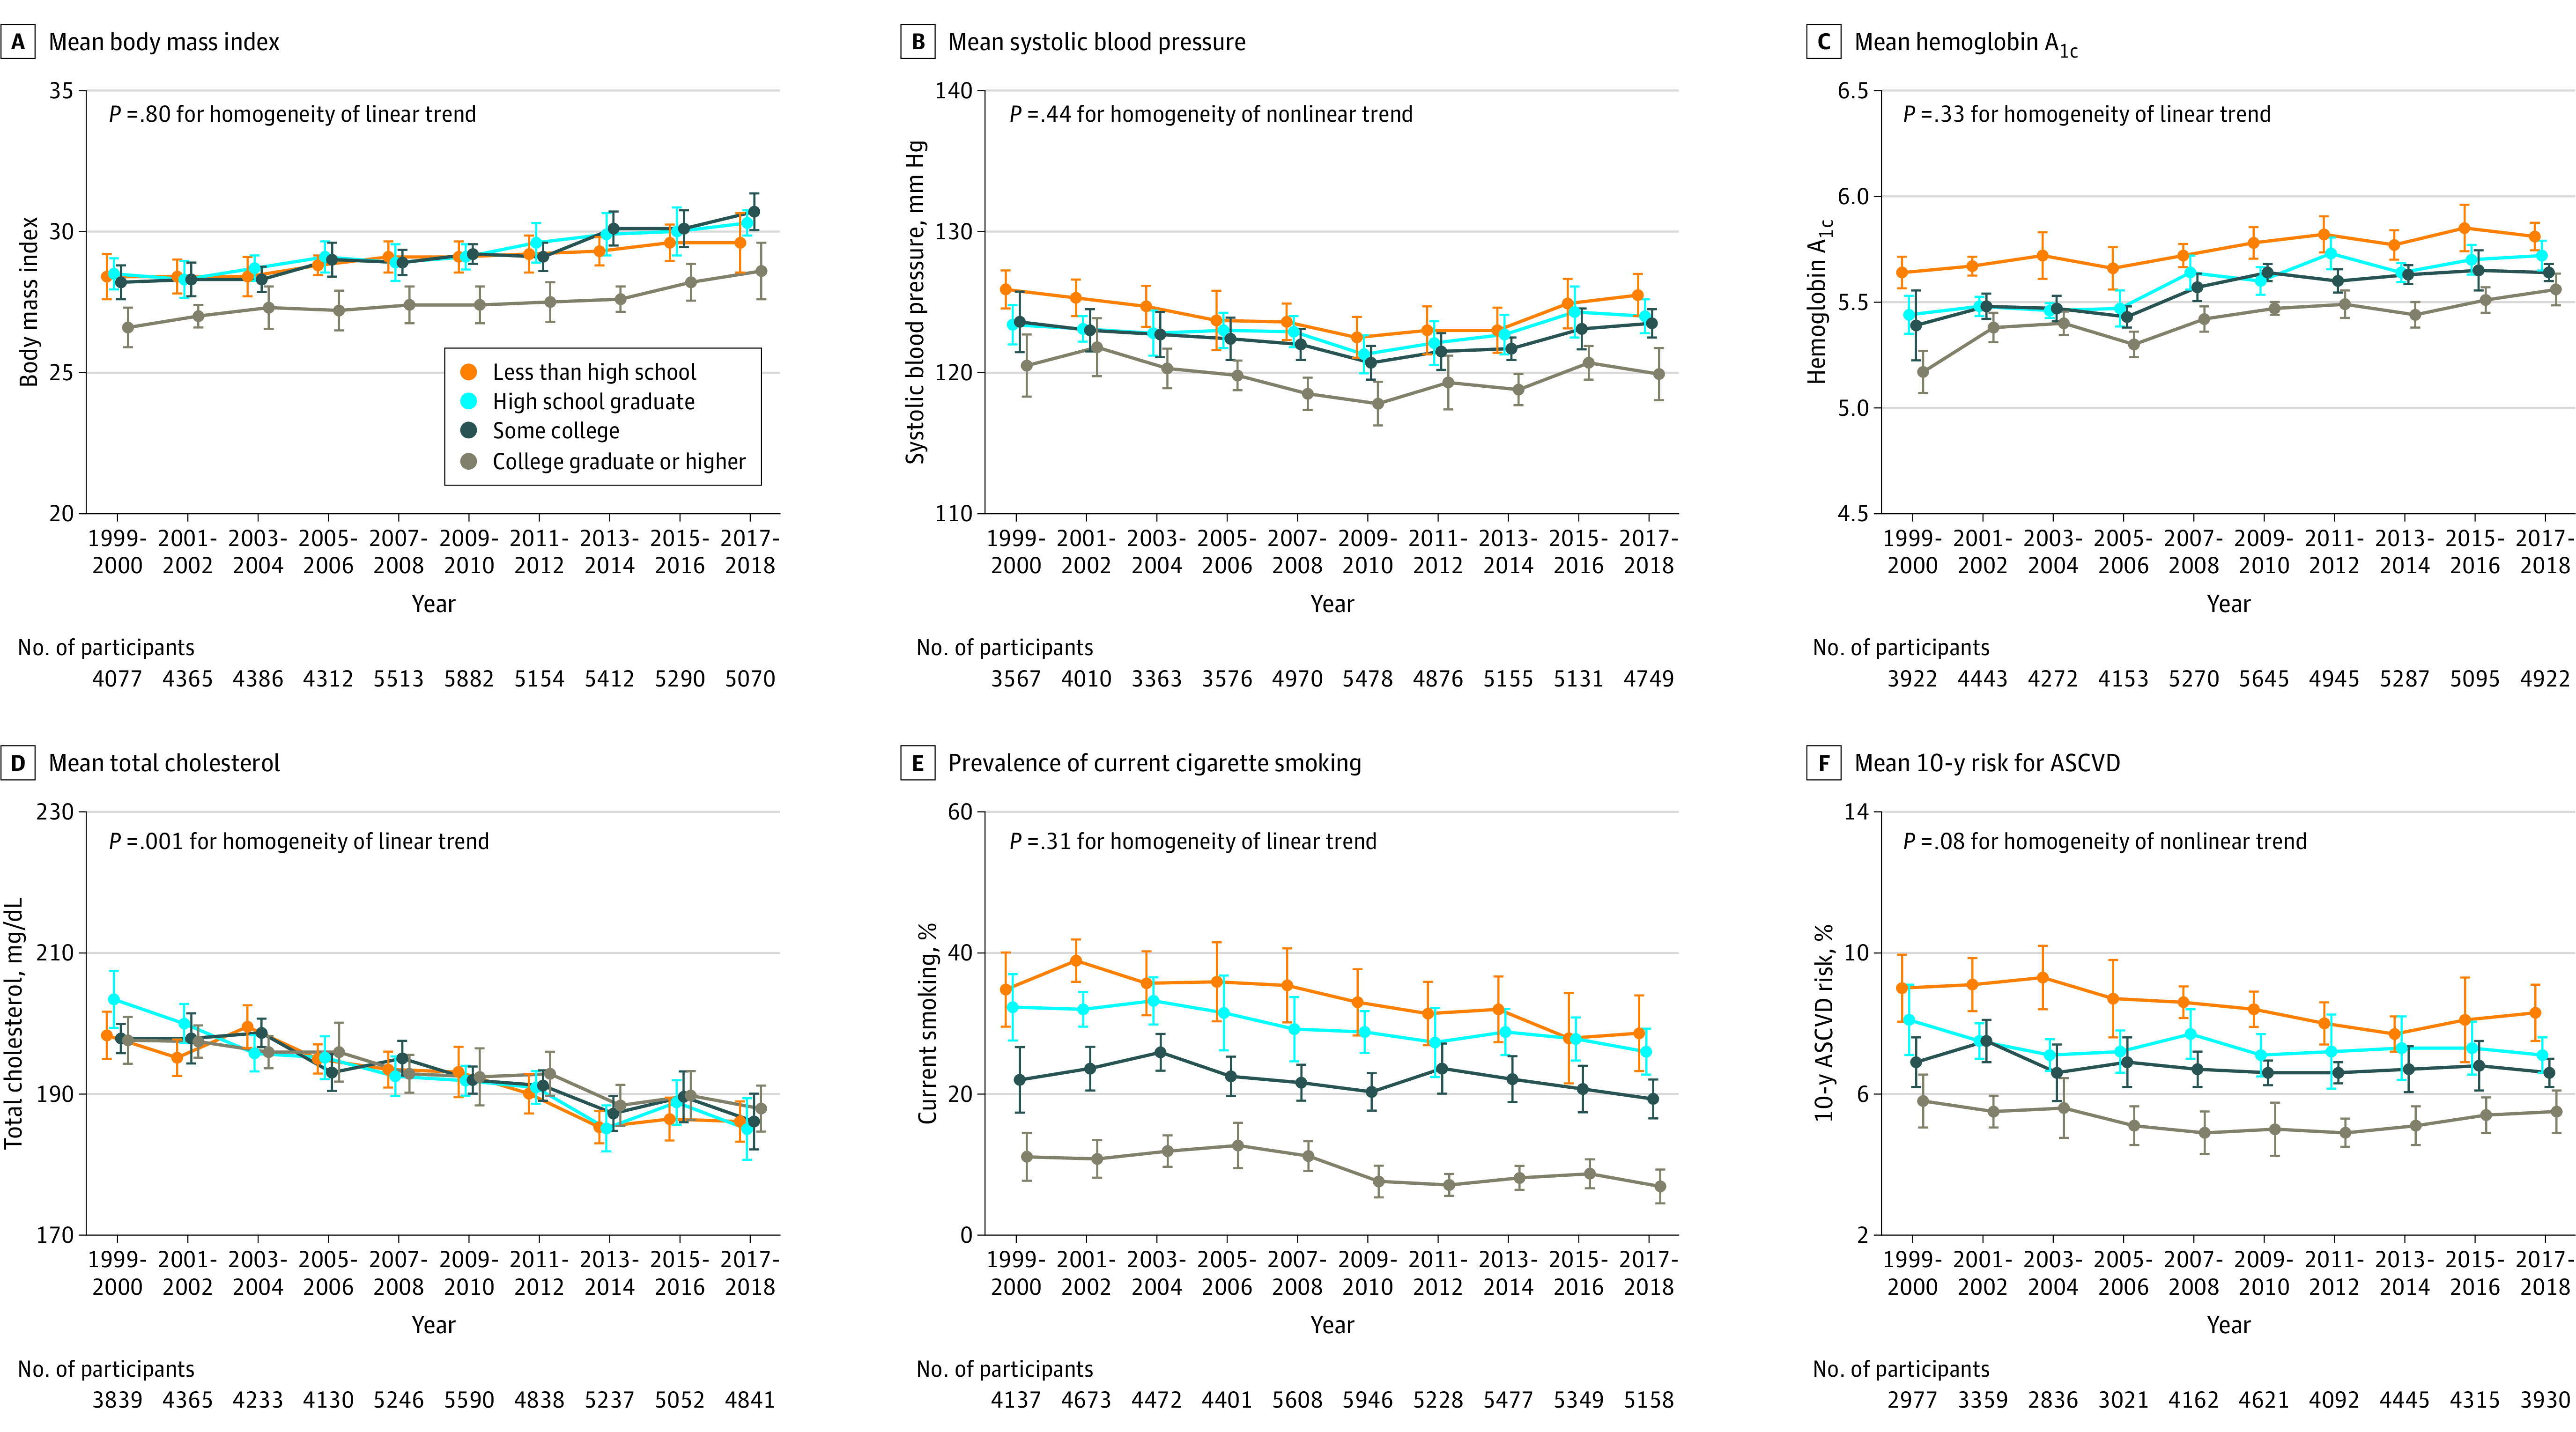
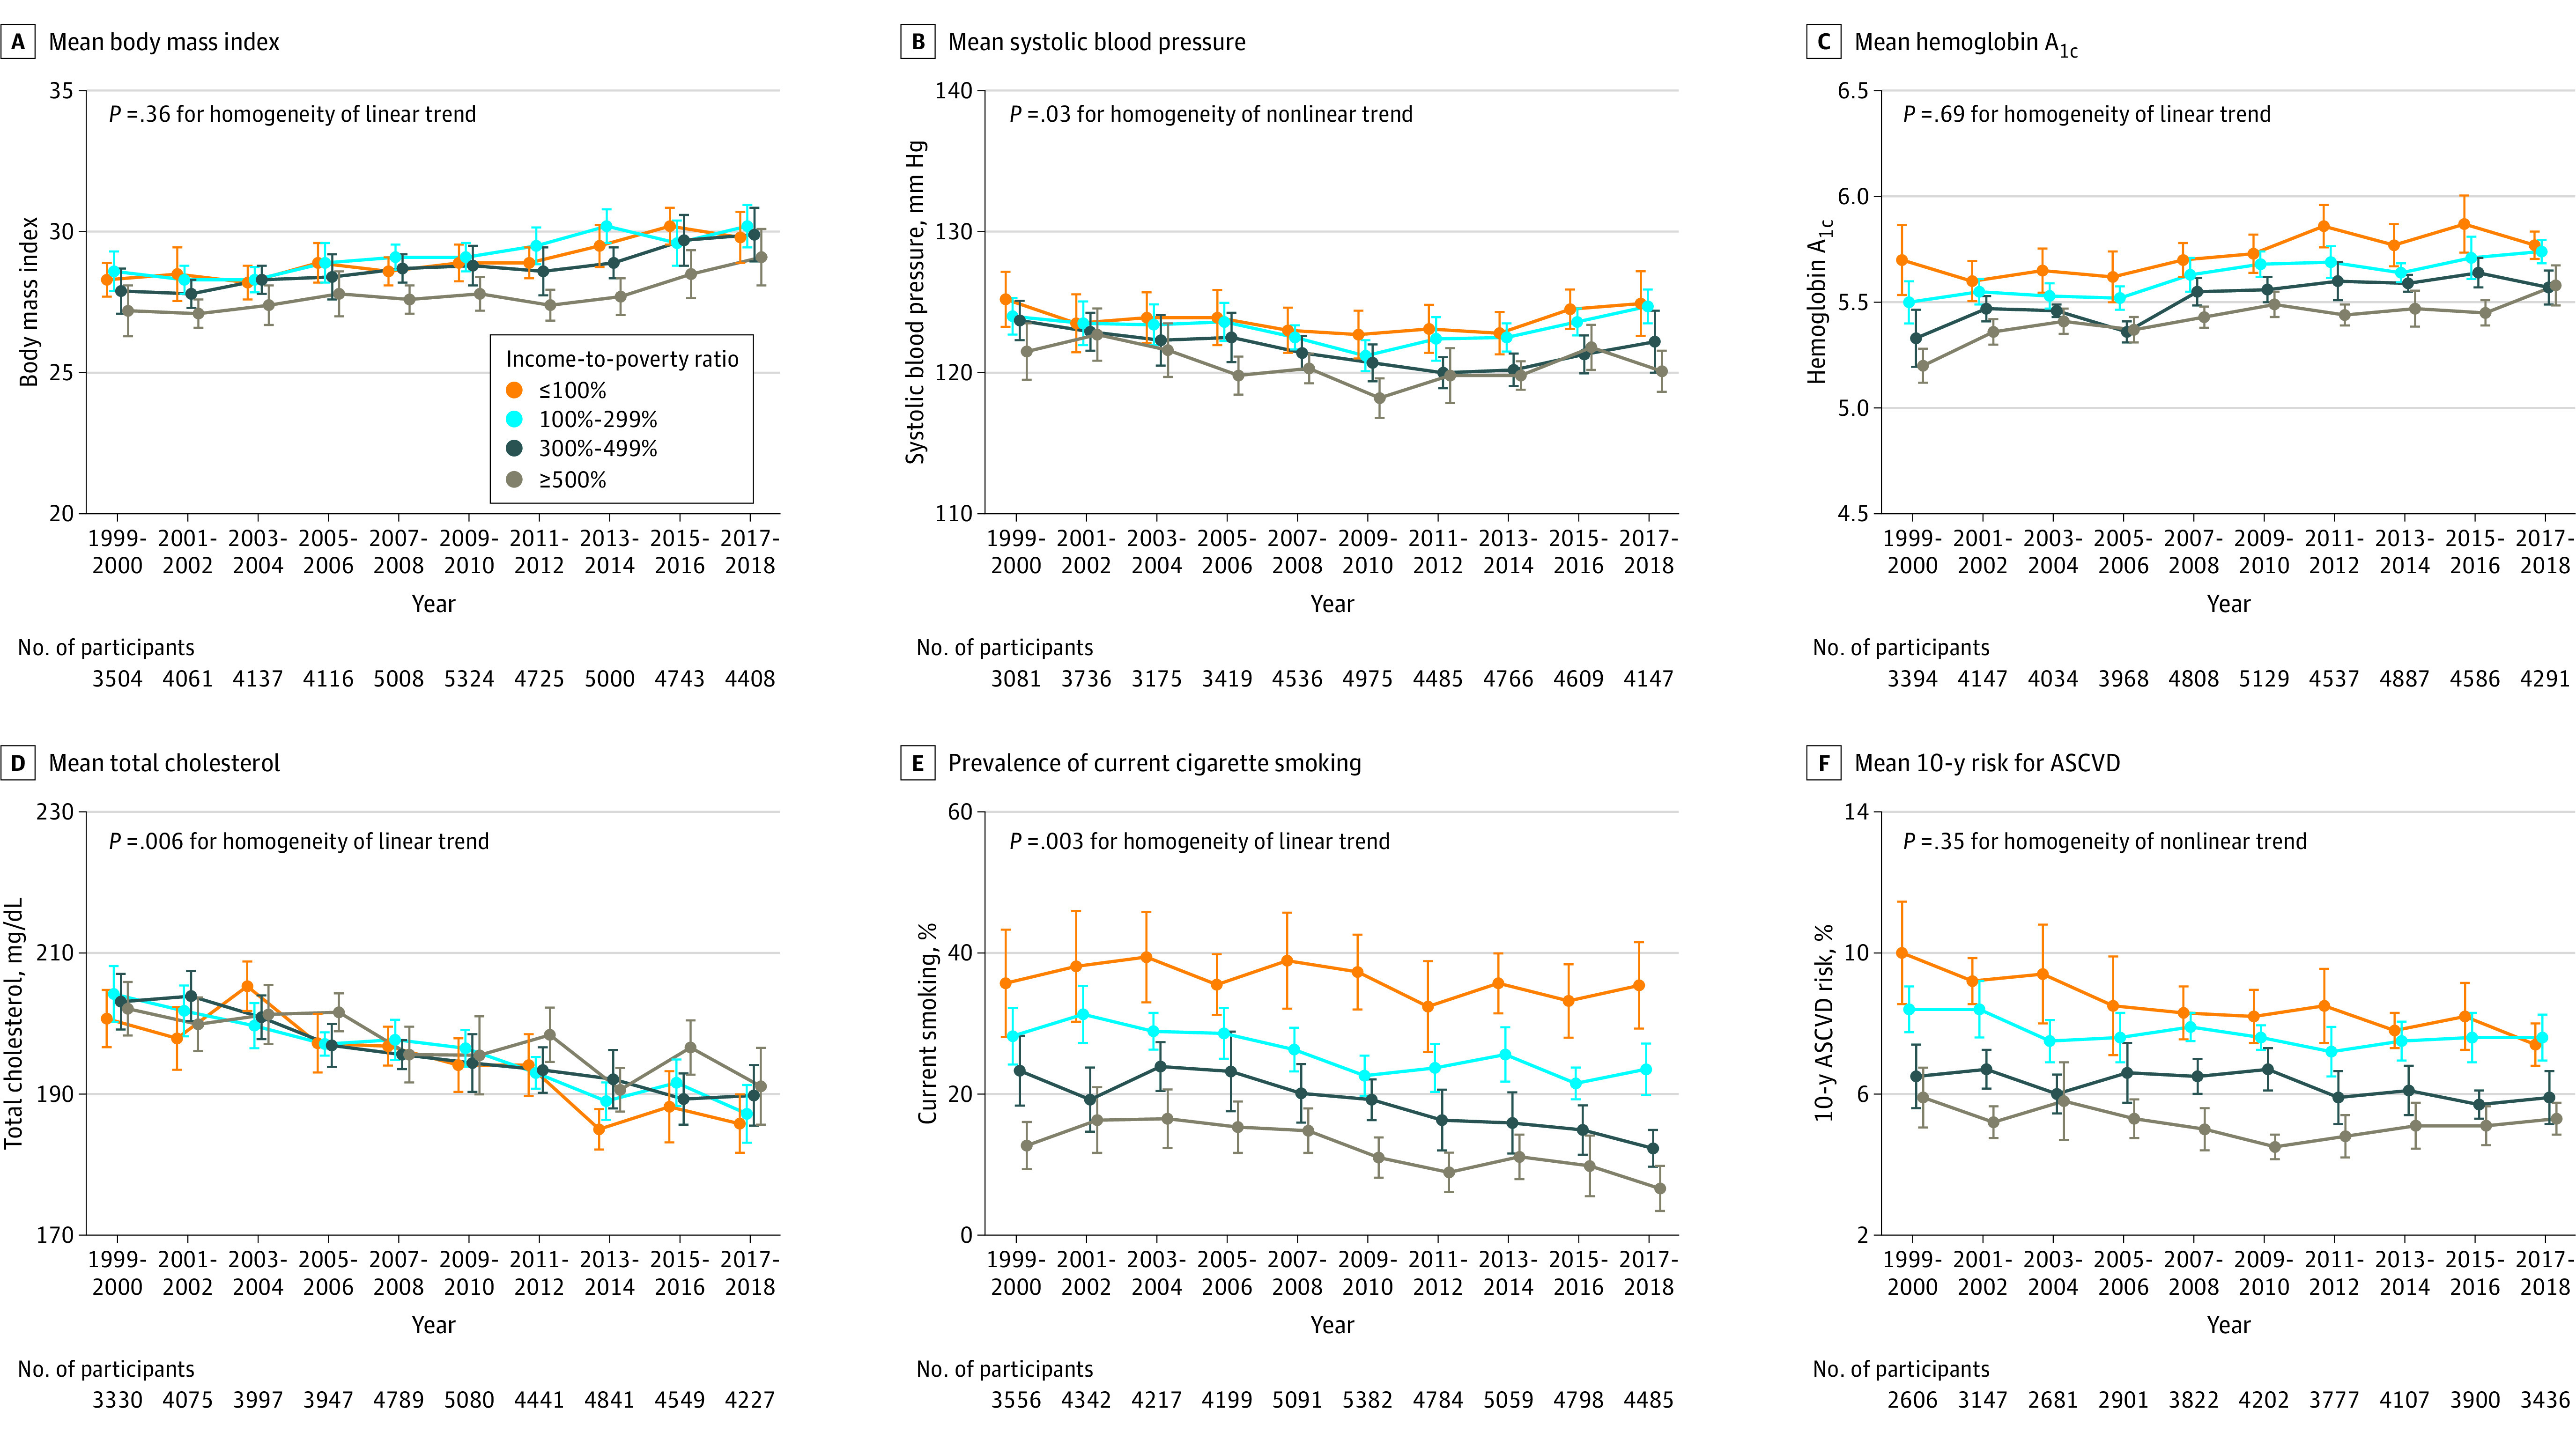
Results: The mean age of participants ranged from 49.0 to 51.8 years and the proportion of women from 48.2% to 51.3% in the surveys. From 1999-2000 to 2017-2018, age- and sex-adjusted mean body mass index increased from 28.0 (95% CI, 27.5-28.5) to 29.8 (95% CI, 29.2-30.4); mean hemoglobin A1c increased from 5.4% (95% CI, 5.3%-5.5%) to 5.7% (95% CI, 5.6%-5.7%) (both P < .001 for linear trends). Mean serum total cholesterol decreased from 203.3 mg/dL (95% CI, 200.9-205.8 mg/dL) to 188.5 mg/dL (95% CI, 185.2-191.9 mg/dL); prevalence of smoking decreased from 24.8% (95% CI, 21.8%-27.7%) to 18.1% (95% CI, 15.4%-20.8%) (both P < .001 for linear trends). Mean systolic blood pressure decreased from 123.5 mm Hg (95% CI, 122.2-124.8 mm Hg) in 1999-2000 to 120.5 mm Hg (95% CI, 119.6-121.3 mm Hg) in 2009-2010, then increased to 122.8 mm Hg (95% CI, 121.7-123.8 mm Hg) in 2017-2018 (P < .001 for nonlinear trend). Age- and sex-adjusted 10-year atherosclerotic cardiovascular disease risk decreased from 7.6% (95% CI, 6.9%-8.2%) in 1999-2000 to 6.5% (95% CI, 6.1%-6.8%) in 2011-2012, then did not significantly change. Age- and sex-adjusted body mass index, systolic blood pressure, and hemoglobin A1c were consistently higher, while total cholesterol was lower in non-Hispanic Black participants compared with non-Hispanic White participants (all P < .001 for group differences). Individuals with college or higher education or high family income had consistently lower levels of cardiovascular risk factors. The mean age- and sex-adjusted 10-year risk of atherosclerotic cardiovascular disease was significantly higher in non-Hispanic Black participants compared with non-Hispanic White participants (difference, 1.4% [95% CI, 1.0%-1.7%] in 1999-2008 and 2.0% [95% CI, 1.7%-2.4%] in 2009-2018]). This difference was attenuated (-0.3% [95% CI, -0.6% to 0.1%] in 1999-2008 and 0.7% [95% CI, 0.3%-1.0%] in 2009-2018) after further adjusting for education, income, home ownership, employment, health insurance, and access to health care.

Conclusions and relevance: In this serial cross-sectional survey study that estimated US trends in cardiovascular risk factors from 1999 through 2018, differences in cardiovascular risk factors persisted between Black and White participants; the difference may have been moderated by social determinants of health.


Conflict of interest statement

Conflict of Interest Disclosures: None reported.

Figures

Figure 1.
Figure 1.. Trends in Cardiovascular Risk Factors in US Adults
Trends in (A) mean body mass index (calculated as weight in kilograms divided by height in meters squared) (all P < .001 for linear trend); (B) mean systolic blood pressure (P < .001 overall, P = .01 for men, and P < .001 women for nonlinear trend); (C) mean hemoglobin A1c (all P < .001 for linear trend); (D) mean serum total cholesterol (to convert to millimoles per liter, multiply by 0.0259) (all P < .001 for linear trend); (E) prevalence of current cigarette smoking (all P < .001 for linear trend); and (F) mean estimated 10-year risk of atherosclerotic cardiovascular disease (ASCVD) (P < .001 overall, P = .10 for men, and P < .001 for women for linear trend). The 10-year risk of ASCVD was calculated using the Pooled Cohort Equations among individuals without a self-reported history of cardiovascular disease. The probability of developing ASCVD over 10 years ranged from 0% to 100%. All estimates were standardized to the 2000 US Census population using 6 age and sex categories: men aged 20-39, 40-59, and ≥60 years and women aged 20-39, 40-59, and ≥60 years. Linear and polynomial models were used to test linear and nonlinear trends. Error bars indicate 95% CIs.
Figure 2.
Figure 2.. Trends in Cardiovascular Risk Factors by Race and Ethnicity in US Adults
Trends in (A) mean body mass index (calculated as weight in kilograms divided by height in meters squared) (all P < .001 for linear trend); (B) mean systolic blood pressure (P = .001 for linear trend, P < .001 for nonlinear trend, P = .003 for nonlinear trend, and P = .002 for nonlinear trend in Asian, Black, Hispanic, and White individuals, respectively); (C) mean hemoglobin A1c (P = .26 for trend in Asian individuals; for all others, P < .001 for linear trend); (D) mean serum total cholesterol (to convert to millimoles per liter, multiply by 0.0259) (P = .76 for linear trend in Asian individuals; for all others, P < .001 for linear trend); (E) prevalence of current cigarette smoking (P > .05 for trend in Asian and Black individuals; P < .001 for linear trend in Hispanic and White individuals); and (F) mean estimated 10-year risk of atherosclerotic cardiovascular disease (ASCVD) (P = .26 for trend, P = .03 for nonlinear trend, P = .02 for linear trend, and P < .001 for linear trend in Asian, Black, Hispanic, and White individuals, respectively). The 10-year risk of ASCVD was calculated using the Pooled Cohort Equations among individuals without a self-reported history of cardiovascular disease. The probability of developing ASCVD over 10 years ranged from 0% to 100%. All estimates were standardized to the 2000 US Census population using 6 age and sex categories: men aged 20-39, 40-59, and ≥60 years and women aged 20-39, 40-59, and ≥60 years. Linear and polynomial models were used to test linear and nonlinear trends. The homogeneity of trends among racial and ethnic subgroups was tested using an interaction term of time × race and ethnicity in the regression models. Error bars indicate 95% CIs.
Figure 3.
Figure 3.. Trends in Cardiovascular Risk Factors by Education Level in US Adults
Trends in (A) mean body mass index (calculated as weight in kilograms divided by height in meters squared) (all P < .001 for linear trend); (B) mean systolic blood pressure (all P ≤ .02 for nonlinear trend); (C) mean hemoglobin A1c (all P < .001 for linear trend); (D) mean serum total cholesterol (to convert to millimoles per liter, multiply by 0.0259) (all P < .001 for linear trend); (E) prevalence of current cigarette smoking (P = .03 for linear trend in individuals with some college; P < .001 for linear trend in all others); and (F) mean estimated 10-year risk of atherosclerotic cardiovascular disease (ASCVD) (P = .004 for linear trend in individuals with less than high school; P > .05 for trend in high school graduates and those with some college; and P = .01 for nonlinear trend in college graduates or higher). The 10-year risk of ASCVD was calculated using the Pooled Cohort Equations among individuals without a self-reported history of cardiovascular disease. The probability of developing ASCVD over 10 years ranged from 0% to 100%. All estimates were standardized to the 2000 US Census population using 6 age and sex categories: men aged 20-39, 40-59, and ≥60 years and women aged 20-39, 40-59, and ≥60 years. Linear and polynomial models were used to test linear and nonlinear trends. The homogeneity of trends among education subgroups was tested using an interaction term of time × education in the regression models. Error bars indicate 95% CIs.
Figure 4.
Figure 4.. Trends in Cardiovascular Risk Factors by Family Income-to-Poverty Ratio in US Adults
Trends in (A) mean body mass index (calculated as weight in kilograms divided by height in meters squared) (all P < .001 for linear trend); (B) mean systolic blood pressure (all P ≤ .03 for nonlinear trend); (C) mean hemoglobin A1c (all P < .001 for linear trend); (D) mean serum total cholesterol (to convert to millimoles per liter, multiply by 0.0259) (all P < .001 for linear trend); (E) prevalence of current cigarette smoking (P = .15 for linear trend in individuals with an income-to-poverty ratio ≤100%; P < .001 for linear trend for all others); and (F) mean estimated 10-year risk of atherosclerotic cardiovascular disease (ASCVD) (P < .001, P = .02, and P = .06 for linear trend in individuals with income-to-poverty ratios ≤100%, >100-299%, and 300-499%, respectively; P = .009 for nonlinear trend in individuals with an income-to-poverty ratio ≥500%). The 10-year risk of ASCVD was calculated using the Pooled Cohort Equations among individuals without a self-reported history of cardiovascular disease. The probability of developing ASCVD over 10 years ranged from 0% to 100%. All estimates were standardized to the 2000 US Census population using 6 age and sex categories: men aged 20-39, 40-59, and ≥60 years and women aged 20-39, 40-59, and ≥60 years. The poverty threshold for a 4-person family was $17 029 in 1999 ($25 743 in 2018 dollar value) and $25 701 in 2018. Linear and polynomial models were used to test linear and nonlinear trends. The homogeneity of trends among family income subgroups was tested using an interaction term of time × family income subgroup in the regression models. Error bars indicate 95% CIs.

References

    1. Virani SS, Alonso A, Aparicio HJ, et al. ; American Heart Association Council on Epidemiology and Prevention Statistics Committee and Stroke Statistics Subcommittee . Heart disease and stroke statistics—2021 update: a report from the American Heart Association. Circulation. 2021;143(8):e254-e743. doi:10.1161/CIR.0000000000000950 - DOI - PubMed
    1. Shah NS, Lloyd-Jones DM, O’Flaherty M, et al. . Trends in cardiometabolic mortality in the United States, 1999-2017. JAMA. 2019;322(8):780-782. doi:10.1001/jama.2019.9161 - DOI - PMC - PubMed
    1. Murphy SL, Xu J, Kochanek KD, Arias E, Tejada-Vera B. Deaths: final data for 2018. Natl Vital Stat Rep. 2021;69(13):1-83. - PubMed
    1. Ogden CL, Fryar CD, Martin CB, et al. . Trends in obesity prevalence by race and Hispanic origin—1999-2000 to 2017-2018. JAMA. 2020;324(12):1208-1210. doi:10.1001/jama.2020.14590 - DOI - PMC - PubMed
    1. Wang L, Li X, Wang Z, et al. . Trends in prevalence of diabetes and control of risk factors in diabetes among US adults, 1999-2018. JAMA. 2021. doi:10.1001/jama.2021.9883 - DOI - PMC - PubMed

Publication types

MeSH terms