. 2022 Mar;61(2):843-857.
doi: 10.1007/s00394-021-02676-z. Epub 2021 Oct 5.

A plasma fatty acid profile associated to type 2 diabetes development: from the CORDIOPREV study

Affiliations

A plasma fatty acid profile associated to type 2 diabetes development: from the CORDIOPREV study

Alejandro Villasanta-Gonzalez et al. Eur J Nutr. 2022 Mar.

Abstract

Purpose: The prevalence of type 2 diabetes mellitus (T2DM) is increasing worldwide. For this reason, it is essential to identify biomarkers for the early detection of T2DM risk and/or for a better prognosis of T2DM. We aimed to identify a plasma fatty acid (FA) profile associated with T2DM development.

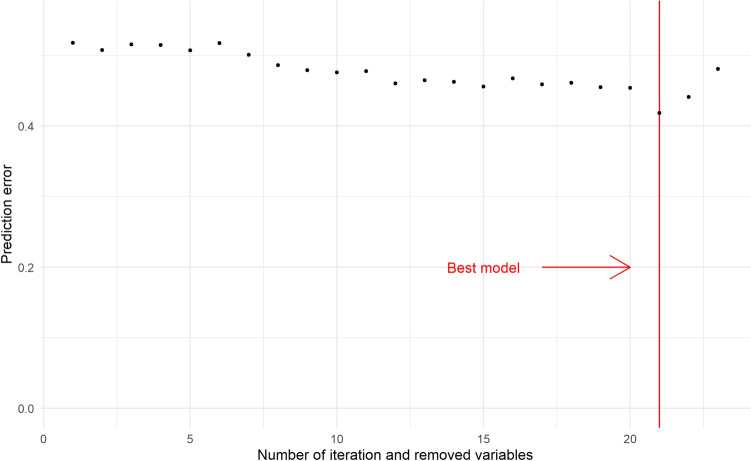
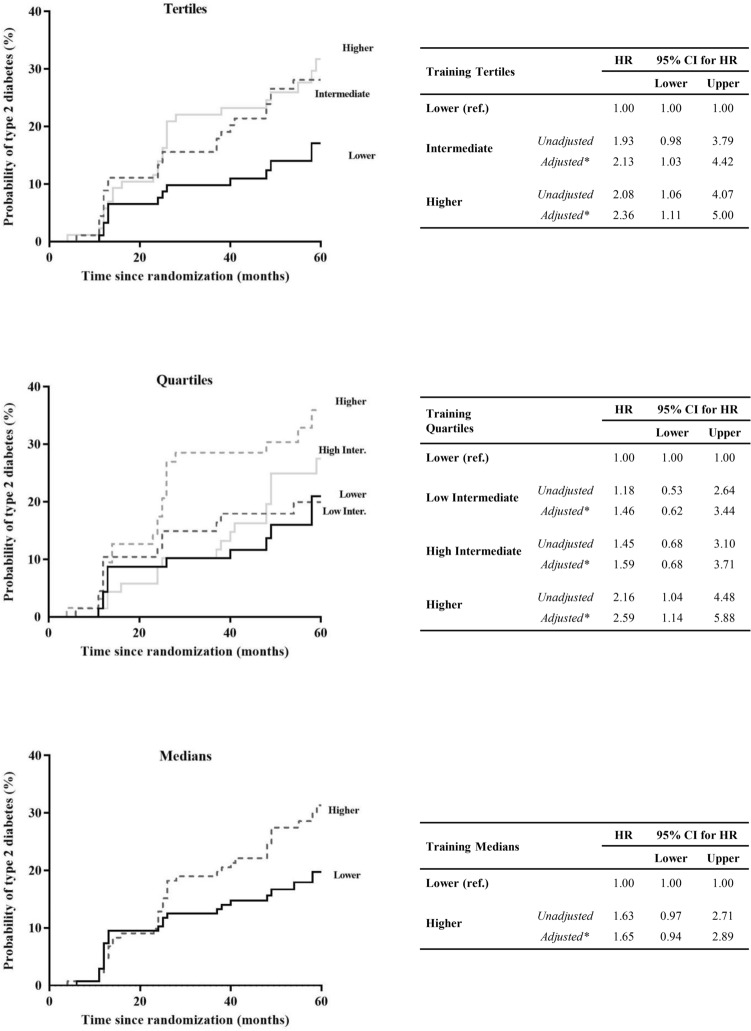
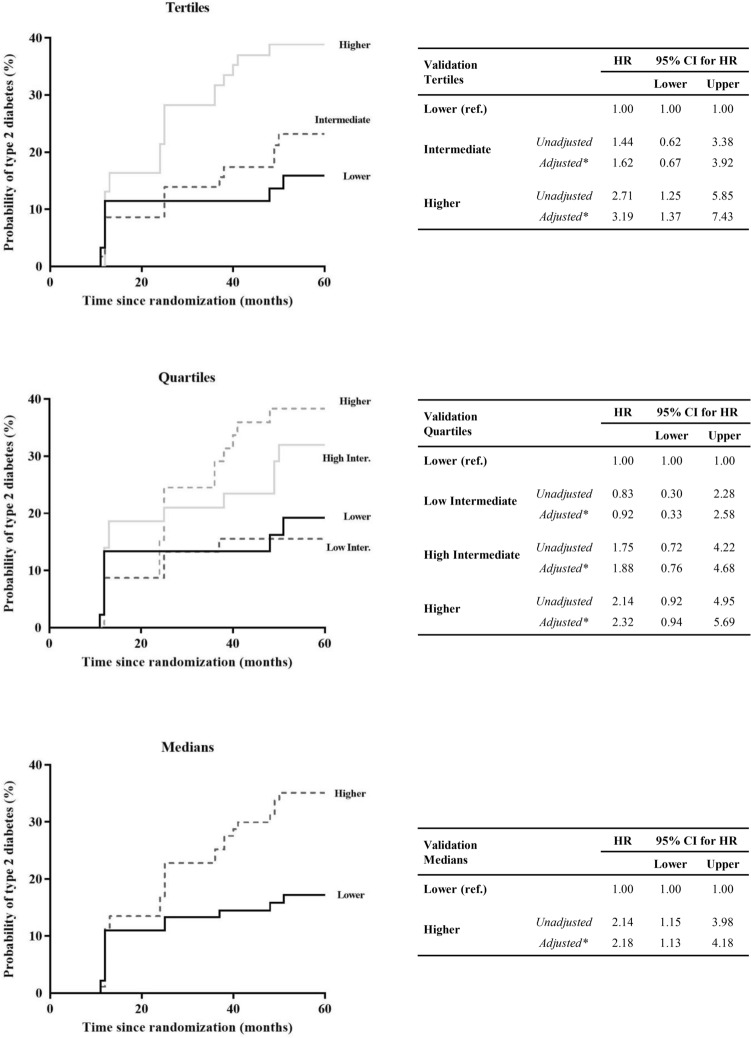
Methods: We included 462 coronary heart disease patients from the CORDIOPREV study without T2DM at baseline. Of these, 107 patients developed T2DM according to the American Diabetes Association (ADA) diagnosis criteria after a median follow-up of 60 months. We performed a random classification of patients in a training set, used to build a FA Score, and a Validation set, in which we tested the FA Score.

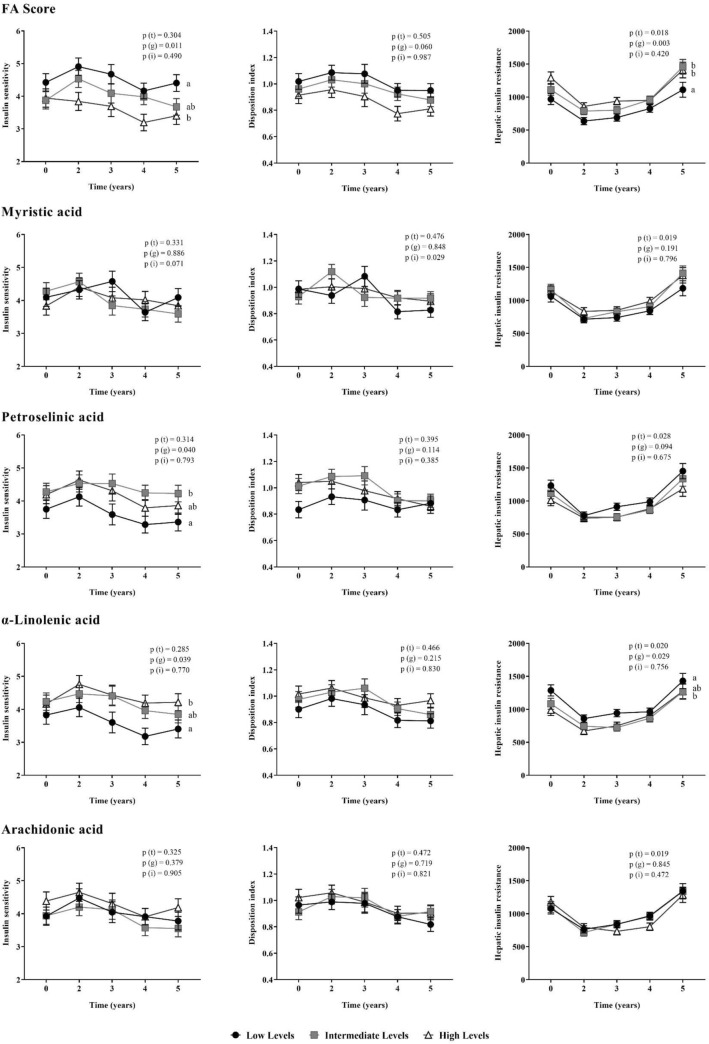
Results: FA selection with the highest prediction power was performed by random survival forest in the Training set, which yielded 4 out of the 24 FA: myristic, petroselinic, α-linolenic and arachidonic acids. We built a FA Score with the selected FA and observed that patients with a higher score presented a greater risk of T2DM development, with an HR of 3.15 (95% CI 2.04-3.37) in the Training set, and an HR of 2.14 (95% CI 1.50-2.84) in the Validation set, per standard deviation (SD) increase. Moreover, patients with a higher FA Score presented lower insulin sensitivity and higher hepatic insulin resistance (p < 0.05).

Conclusion: Our results suggest that a detrimental FA plasma profile precedes the development of T2DM in patients with coronary heart disease, and that this FA profile can, therefore, be used as a predictive biomarker. CLINICAL TRIALS.GOV.

Identifier: NCT00924937.

Keywords: COX; Disease prediction; FA Score; Fatty acids; Type 2 diabetes.


Conflict of interest statement

The author reports no conflicts of interest in this work.

Figures

Fig. 1
Fig. 1
Selection of the best model by Random Survival Forest (RSF). Selection in the Training set of fatty acids with a higher predictive power for type 2 diabetes, by applying an RSF in combination with a backward selection procedure
Fig. 2
Fig. 2
Disease-free survival by COX proportional hazards regression analysis according to FA Score in the Training set. Patients from the Training set were categorized according to the FA Score by tertiles, quartiles and median (ascending order). *This model was adjusted for age, gender, BMI, diet, treatment with statins, HDL-c and TG plasma levels. The hazard ratio (HR) between groups was calculated
Fig. 3
Fig. 3
Disease-free survival by COX proportional hazards regression analysis according to FA Score in the Validation set. Patients from the Validation set were categorized according to the FA Score by tertiles, quartiles and median (ascending order). *This model was adjusted for age, gender, BMI, diet, treatment with statins, HDL-c and TG plasma levels. The hazard ratio (HR) between groups was calculated
Fig. 4
Fig. 4
Relationship between FA profile and insulin resistance and beta-cell functionality indexes. Patients were categorized by baseline concentration of MA, PA, ALA and AA, and by FA Score calculated (ascending order). Mean ± S.E.M. of the insulin-sensitive index (ISI), disposition index (DI) and hepatic insulin resistance index (HIRI) during the follow-up period. ANOVA for repeated measures p-values adjusted by age, gender, BMI, diet, HDL-c and TG plasma levels. Global p-values: P(t): time effect; P(g): group effect; P(i): time by group interaction. Different letters indicate significant differences (p < 0.05) between groups in the Post-hoc Bonferroni's multiple comparison tests

References

    1. Guariguata L, Whiting DR, Hambleton I, Beagley J, Linnenkamp U, Shaw JE. Global estimates of diabetes prevalence for 2013 and projections for 2035. Diabetes Res Clin Pract. 2014;103(2):137–149. doi: 10.1016/j.diabres.2013.11.002. - DOI - PubMed
    1. Guasch-Ferre M, Becerra-Tomas N, Ruiz-Canela M, Corella D, Schroder H, Estruch R, Ros E, Aros F, Gomez-Gracia E, Fiol M, Serra-Majem L, Lapetra J, Basora J, Martin-Calvo N, Portoles O, Fito M, Hu FB, Forga L, Salas-Salvado J. Total and subtypes of dietary fat intake and risk of type 2 diabetes mellitus in the Prevencion con Dieta Mediterranea (PREDIMED) study. Am J Clin Nutr. 2017;105(3):723–735. doi: 10.3945/ajcn.116.142034. - DOI - PubMed
    1. Einarson TR, Acs A, Ludwig C, Panton UH. Prevalence of cardiovascular disease in type 2 diabetes: a systematic literature review of scientific evidence from across the world in 2007–2017. Cardiovasc Diabetol. 2018;17(1):83. doi: 10.1186/s12933-018-0728-6. - DOI - PMC - PubMed
    1. Defronzo RA. Insulin resistance, lipotoxicity, type 2 diabetes and atherosclerosis: the missing links. The Claude Bernard Lecture 2009. Diabetologia. 2010;53(7):1270–1287. doi: 10.1007/s00125-010-1684-1. - DOI - PMC - PubMed
    1. Kolb H, Martin S. Environmental/lifestyle factors in the pathogenesis and prevention of type 2 diabetes. BMC Med. 2017;15(1):131. doi: 10.1186/s12916-017-0901-x. - DOI - PMC - PubMed

Associated data