

Technical Note: Break-even dose level for hypofractionated treatment schedules
- PMID: 34609744
- PMCID: PMC9298418
- DOI: 10.1002/mp.15267
Technical Note: Break-even dose level for hypofractionated treatment schedules
Abstract
Purpose: To derive the isodose line R relative to the prescription dose below which irradiated normal tissue (NT) regions benefit from a hypofractionated schedule with an isoeffective dose to the tumor. To apply the formalism to clinical case examples.
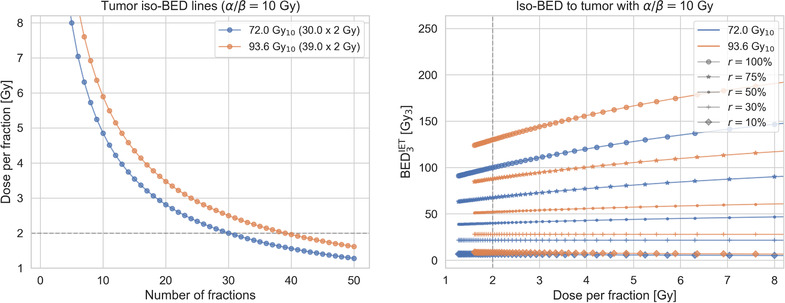
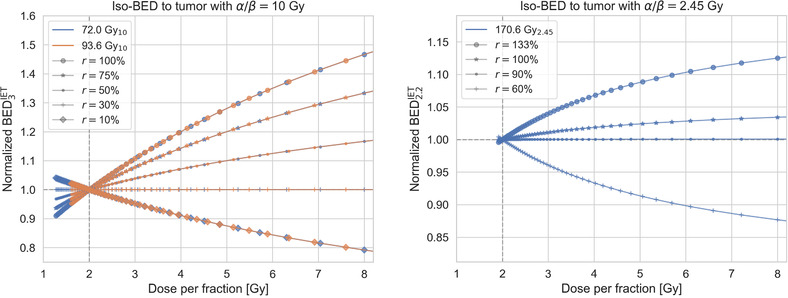
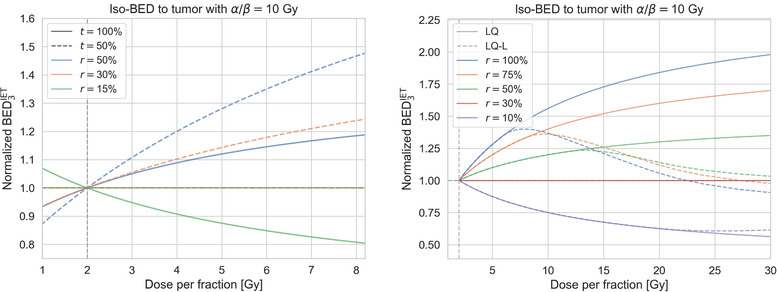
Methods: From the standard biologically effective dose (BED) equation based on the linear-quadratic (LQ) model, the BED of an NT that receives a relative proportion r of the prescribed dose per fraction for a given α/β-ratio of the tumor, (α/β)T , and NT, (α/β)NT , is derived for different treatment schedules while keeping the BED to the tumor constant. Based on this, the "break-even" isodose line R is then derived. The BED of NT regions that receive doses below R decreases for more hypofractionated treatment schedules, and hence a lower risk for NT injury is predicted in these regions. To assess the impact of a linear behavior of BED for high doses per fraction (>6 Gy), we evaluated BED also using the LQ-linear (LQ-L) model.
Results: The formalism provides the equations to derive the BED of an NT as function of dose per fraction for an isoeffective dose to the tumor and the corresponding break-even isodose line R. For generic α/β-ratios of (α/β)T = 10 Gy and (α/β)NT = 3 Gy and homogeneous dose in the target, R is 30%. R is doubling for stereotactic treatments for which tumor control correlates with the maximum dose of 100% instead of the encompassing isodose line of 50%. When using the LQ-L model, the notion of a break-even dose level R remains valid up to about 20 Gy per fraction for generic α/β-ratios and .
Conclusions: The formalism may be used to estimate below which relative isodose line R there will be a differential sparing of NT when increasing hypofractionation. More generally, it allows to assess changes of the therapeutic index for sets of isoeffective treatment schedules at different relative dose levels compared to a reference schedule in a compact manner.
Keywords: BED; LQ model; LQ-L model; hypofractionation; isoeffect.
© 2021 The Authors. Medical Physics published by Wiley Periodicals LLC on behalf of American Association of Physicists in Medicine.
Conflict of interest statement
The authors have no conflicts to disclose.
Figures
References
-
- Jones B, Dale RG, Deehan C, Hopkins KI, Morgan DAL. The role of biologically effective dose (BED) in clinical oncology. Clin Oncol. 2001;13(2):71‐81. - PubMed
-
- Hall EJ, Giaccia AJ. Radiobiology for the Radiologist. 8th ed. Wolters Kluwer; 2019.
-
- Mizuta M, Takao S, Date H, et al. A mathematical study to select fractionation regimen based on physical dose distribution and the linear–quadratic model. Int J Radiat Oncol. 2012;84(3):829‐833. - PubMed
-
- Keller H, Hope A, Meier G, Davison M. A novel dose‐volume metric for optimizing therapeutic ratio through fractionation: retrospective analysis of lung cancer treatments: optimal dose fractionation. Med Phys. 2013;40(8):084101. - PubMed
MeSH terms
Grants and funding
LinkOut - more resources
Full Text Sources
Medical
Research Materials
