Mechanism for the Generation of Robust Circadian Oscillations through Ultransensitivity and Differential Binding Affinity
- PMID: 34609867
- PMCID: PMC8515790
- DOI: 10.1021/acs.jpcb.1c05915
Mechanism for the Generation of Robust Circadian Oscillations through Ultransensitivity and Differential Binding Affinity
Abstract
Biochemical circadian rhythm oscillations play an important role in many signaling mechanisms. In this work, we explore some of the biophysical mechanisms responsible for sustaining robust oscillations by constructing a minimal but analytically tractable model of the circadian oscillations in the KaiABC protein system found in the cyanobacteria S. elongatus. In particular, our minimal model explicitly accounts for two experimentally characterized biophysical features of the KaiABC protein system, namely, a differential binding affinity and an ultrasensitive response. Our analytical work shows how these mechanisms might be crucial for promoting robust oscillations even in suboptimal nutrient conditions. Our analytical and numerical work also identifies mechanisms by which biological clocks can stably maintain a constant time period under a variety of nutrient conditions. Finally, our work also explores the thermodynamic costs associated with the generation of robust sustained oscillations and shows that the net rate of entropy production alone might not be a good figure of merit to asses the quality of oscillations.
Conflict of interest statement
The authors declare no competing financial interest.
Figures


 . Changes in the phosphorylation
levels
of the KaiC hexamers give rise to oscillations. KaiA binds to KaiC
during the ”day” and promotes phosphorylation, whereas
at “night”, KaiB binds to KaiC and sequesters KaiA,
thus leading to dephosphorylation. The horizontal rungs in all the
states correspond to the phosphotransfer reactions and the hydrolysis
of ATP accompanying it, i.e., the red arrows between IA → IIB,
and IB → IIC, purple arrows between IIIC → IIIA, and
green arrows between IVD → IVA in Figure 2a. The ratio of the forward and backward
rates is given by, γ, γ1, and γ2 which are all less than 1, because of the fact that these describe
reactions coupled to ATP hydrolysis which are inherently irreversible.
In the model, α > 1 is responsible for differential affinity,
  corresponds
to % ATP, and k1 helps in tuning ultrasensitivity.
Free KaiA, Af, provides nonlinearity to
the system.


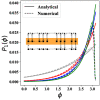
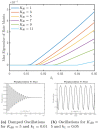
 . The time period
of oscillation for the
different cycles is denoted along the curves.

Similar articles
-
Dual KaiC-based oscillations constitute the circadian system of cyanobacteria.Genes Dev. 2008 Jun 1;22(11):1513-21. doi: 10.1101/gad.1661808. Epub 2008 May 13. Genes Dev. 2008. PMID: 18477603 Free PMC article.
-
On the effect of circadian oscillations on biochemical cell signaling by NF-κB.J Theor Biol. 2013 Oct 21;335:283-94. doi: 10.1016/j.jtbi.2013.06.027. Epub 2013 Jun 29. J Theor Biol. 2013. PMID: 23820037
-
Drosophila free-running rhythms require intercellular communication.PLoS Biol. 2003 Oct;1(1):E13. doi: 10.1371/journal.pbio.0000013. Epub 2003 Sep 15. PLoS Biol. 2003. PMID: 12975658 Free PMC article.
-
No promoter left behind: global circadian gene expression in cyanobacteria.J Biol Rhythms. 2006 Dec;21(6):419-31. doi: 10.1177/0748730406294418. J Biol Rhythms. 2006. PMID: 17107933 Free PMC article. Review.
-
Stochastic models for circadian rhythms: effect of molecular noise on periodic and chaotic behaviour.C R Biol. 2003 Feb;326(2):189-203. doi: 10.1016/s1631-0691(03)00016-7. C R Biol. 2003. PMID: 12754937 Review.
Cited by
-
Subunit shuffling dynamics in KaiC's central hub reveal the synchronization mechanism of the cyanobacterial circadian clock.bioRxiv [Preprint]. 2025 Mar 17:2025.03.17.643614. doi: 10.1101/2025.03.17.643614. bioRxiv. 2025. PMID: 40166323 Free PMC article. Preprint.
References
Publication types
MeSH terms
LinkOut - more resources
Full Text Sources

