. 2021 Oct 5;14(703):eabc5944.
doi: 10.1126/scisignal.abc5944. Epub 2021 Oct 5.

Spatial bias in cAMP generation determines biological responses to PTH type 1 receptor activation

Affiliations

Spatial bias in cAMP generation determines biological responses to PTH type 1 receptor activation

Alex D White et al. Sci Signal. .

Abstract

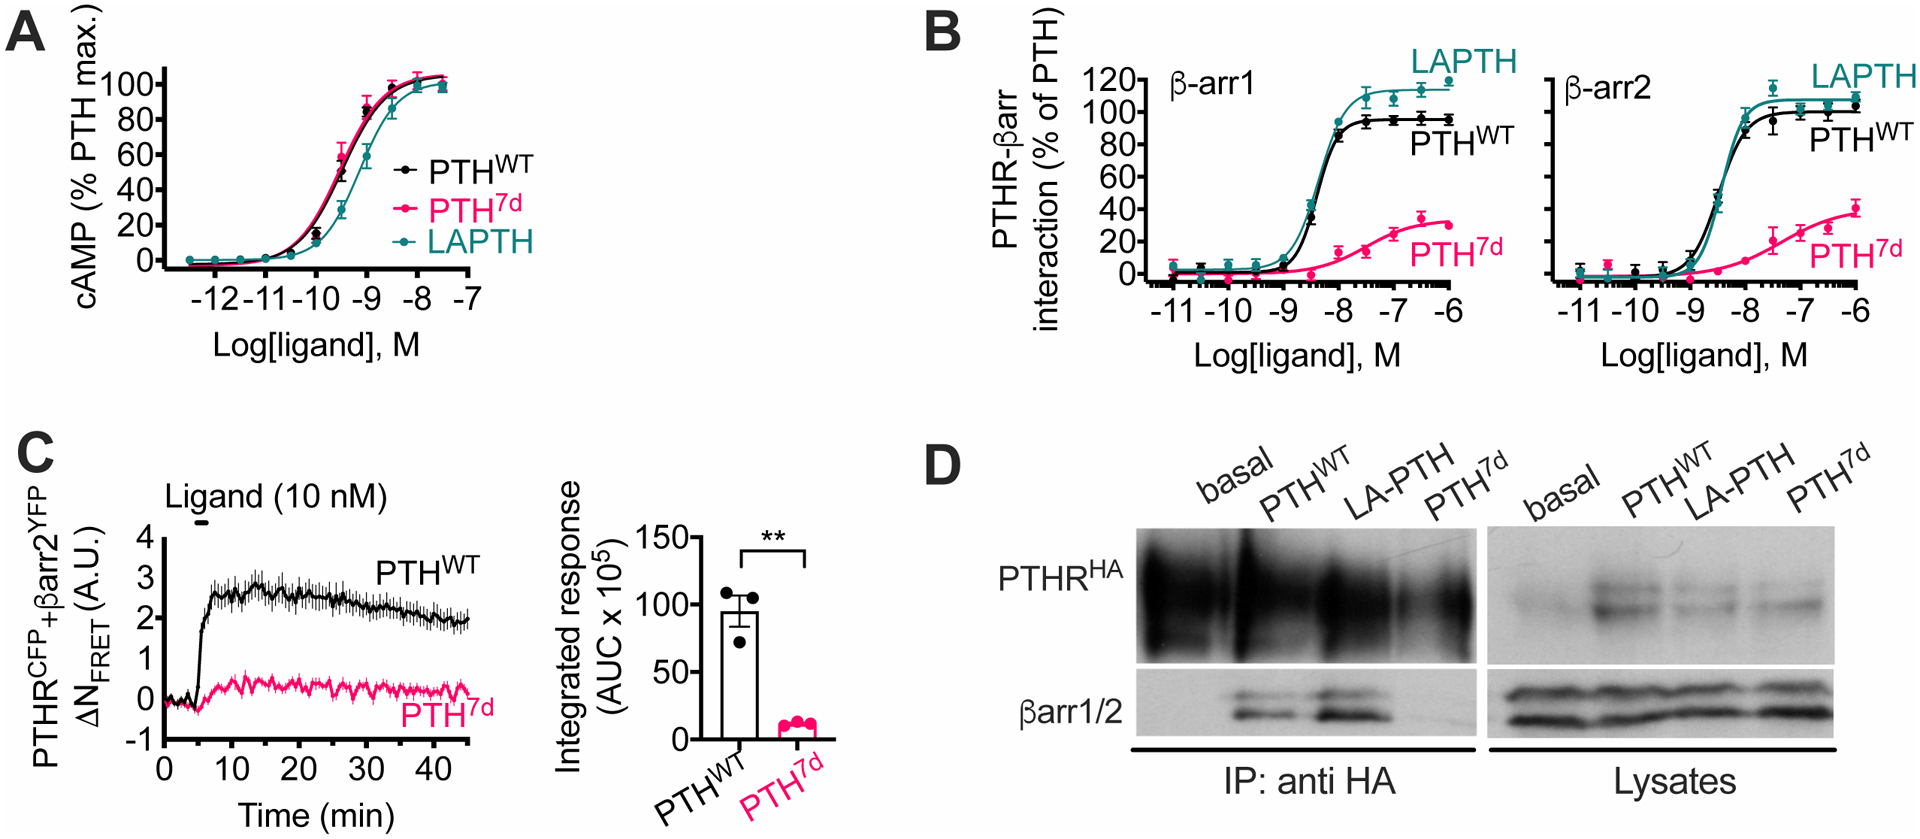
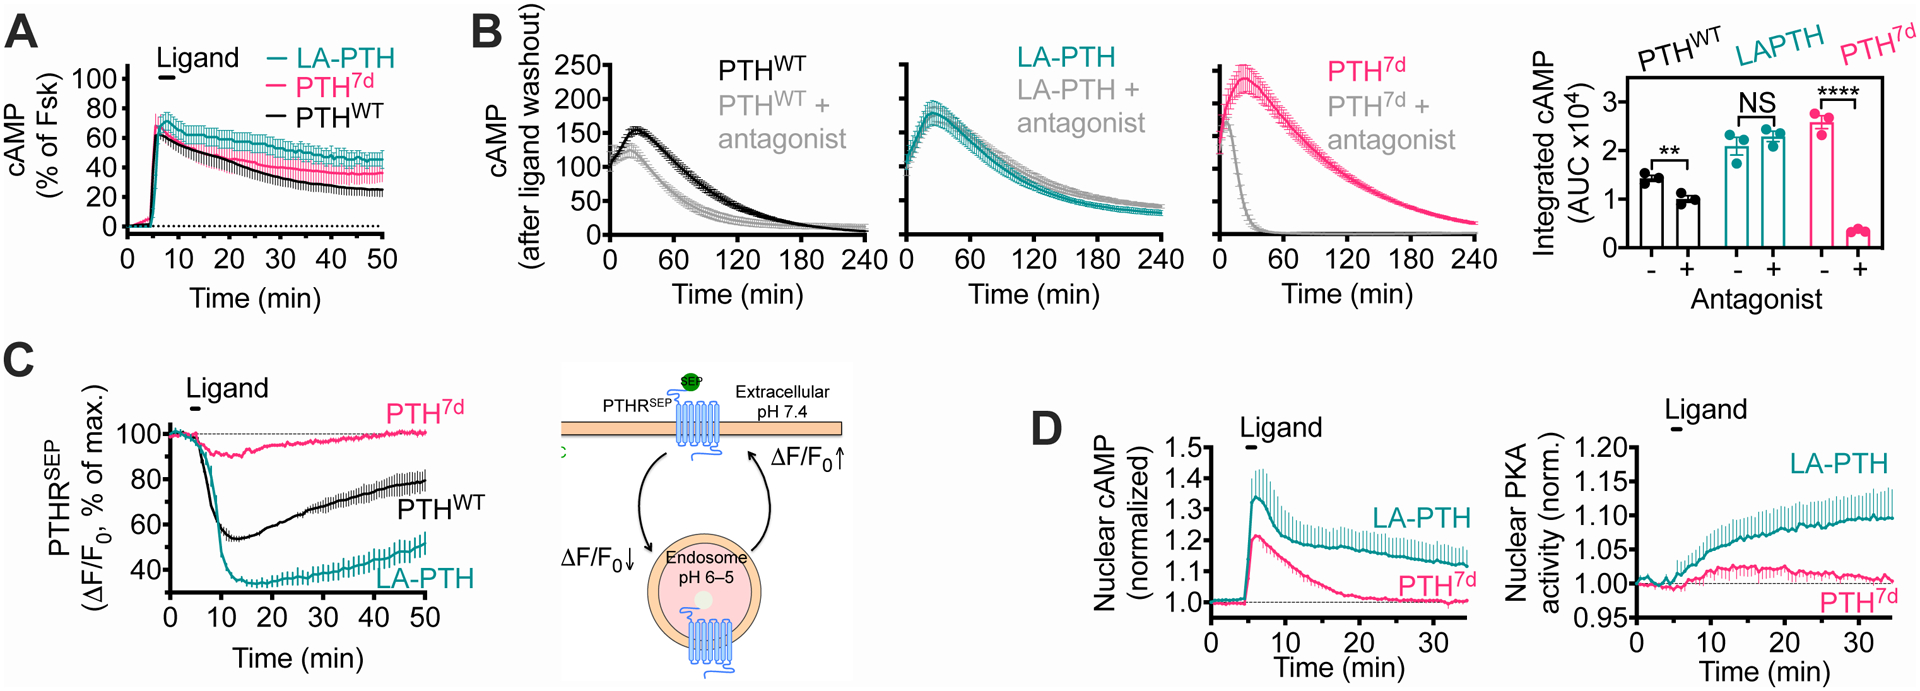
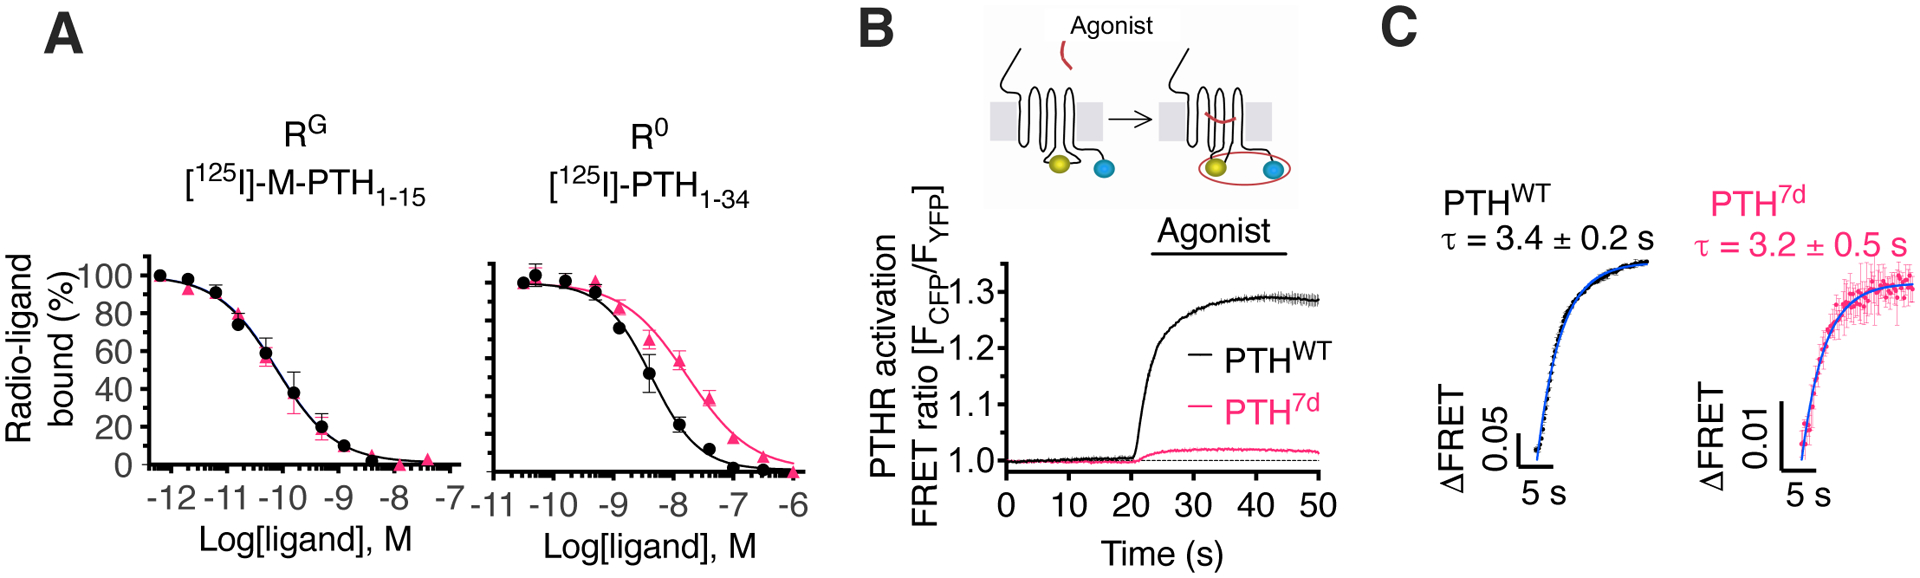
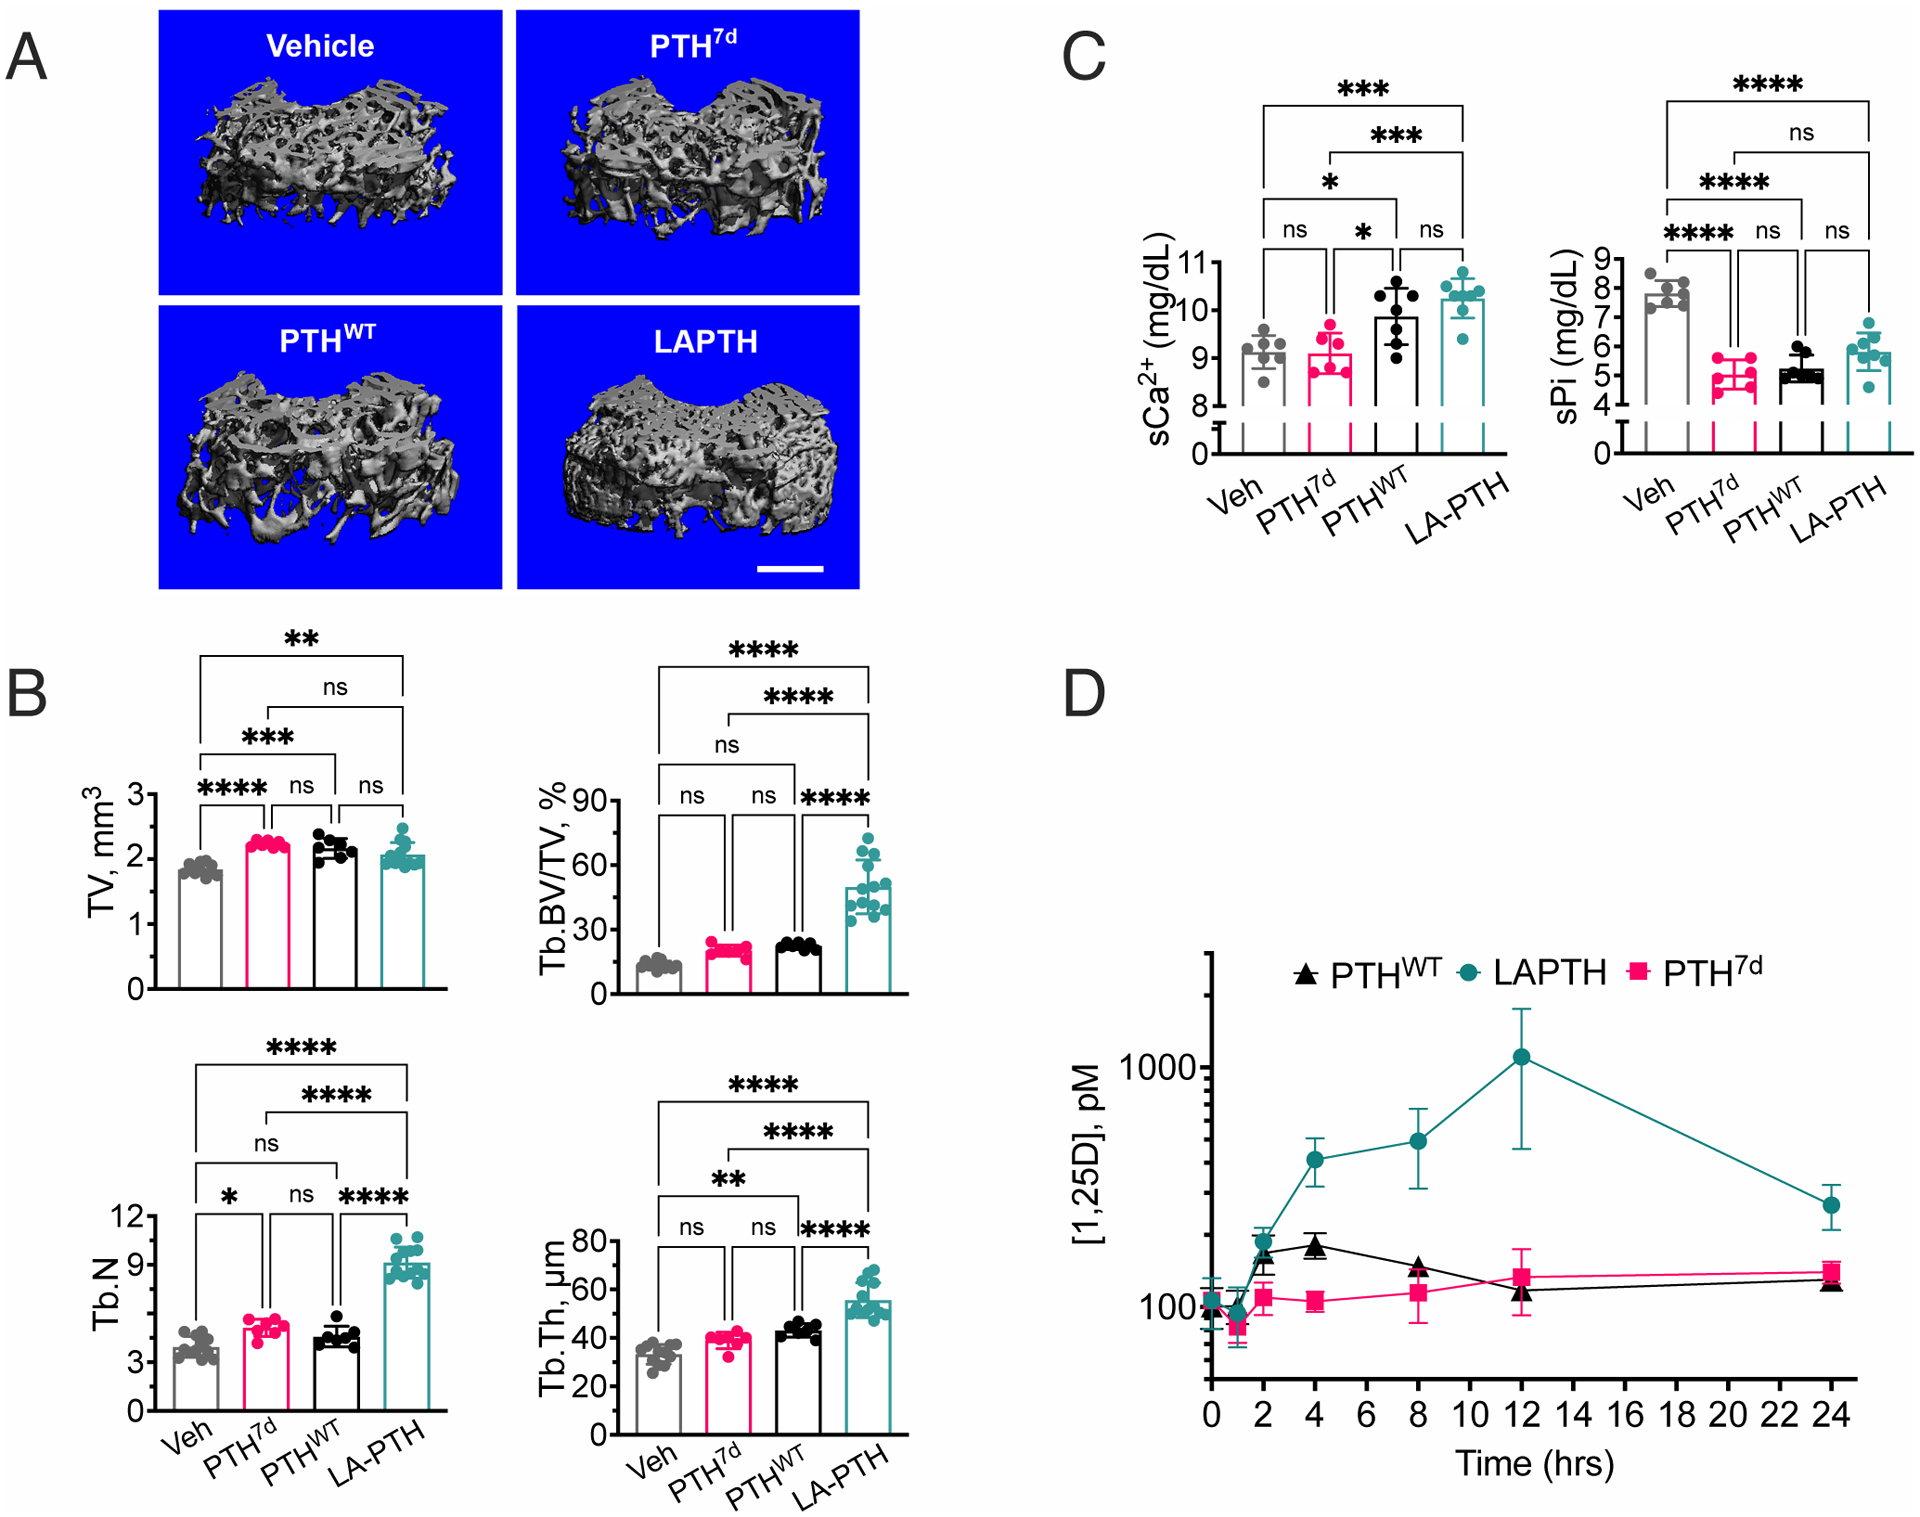
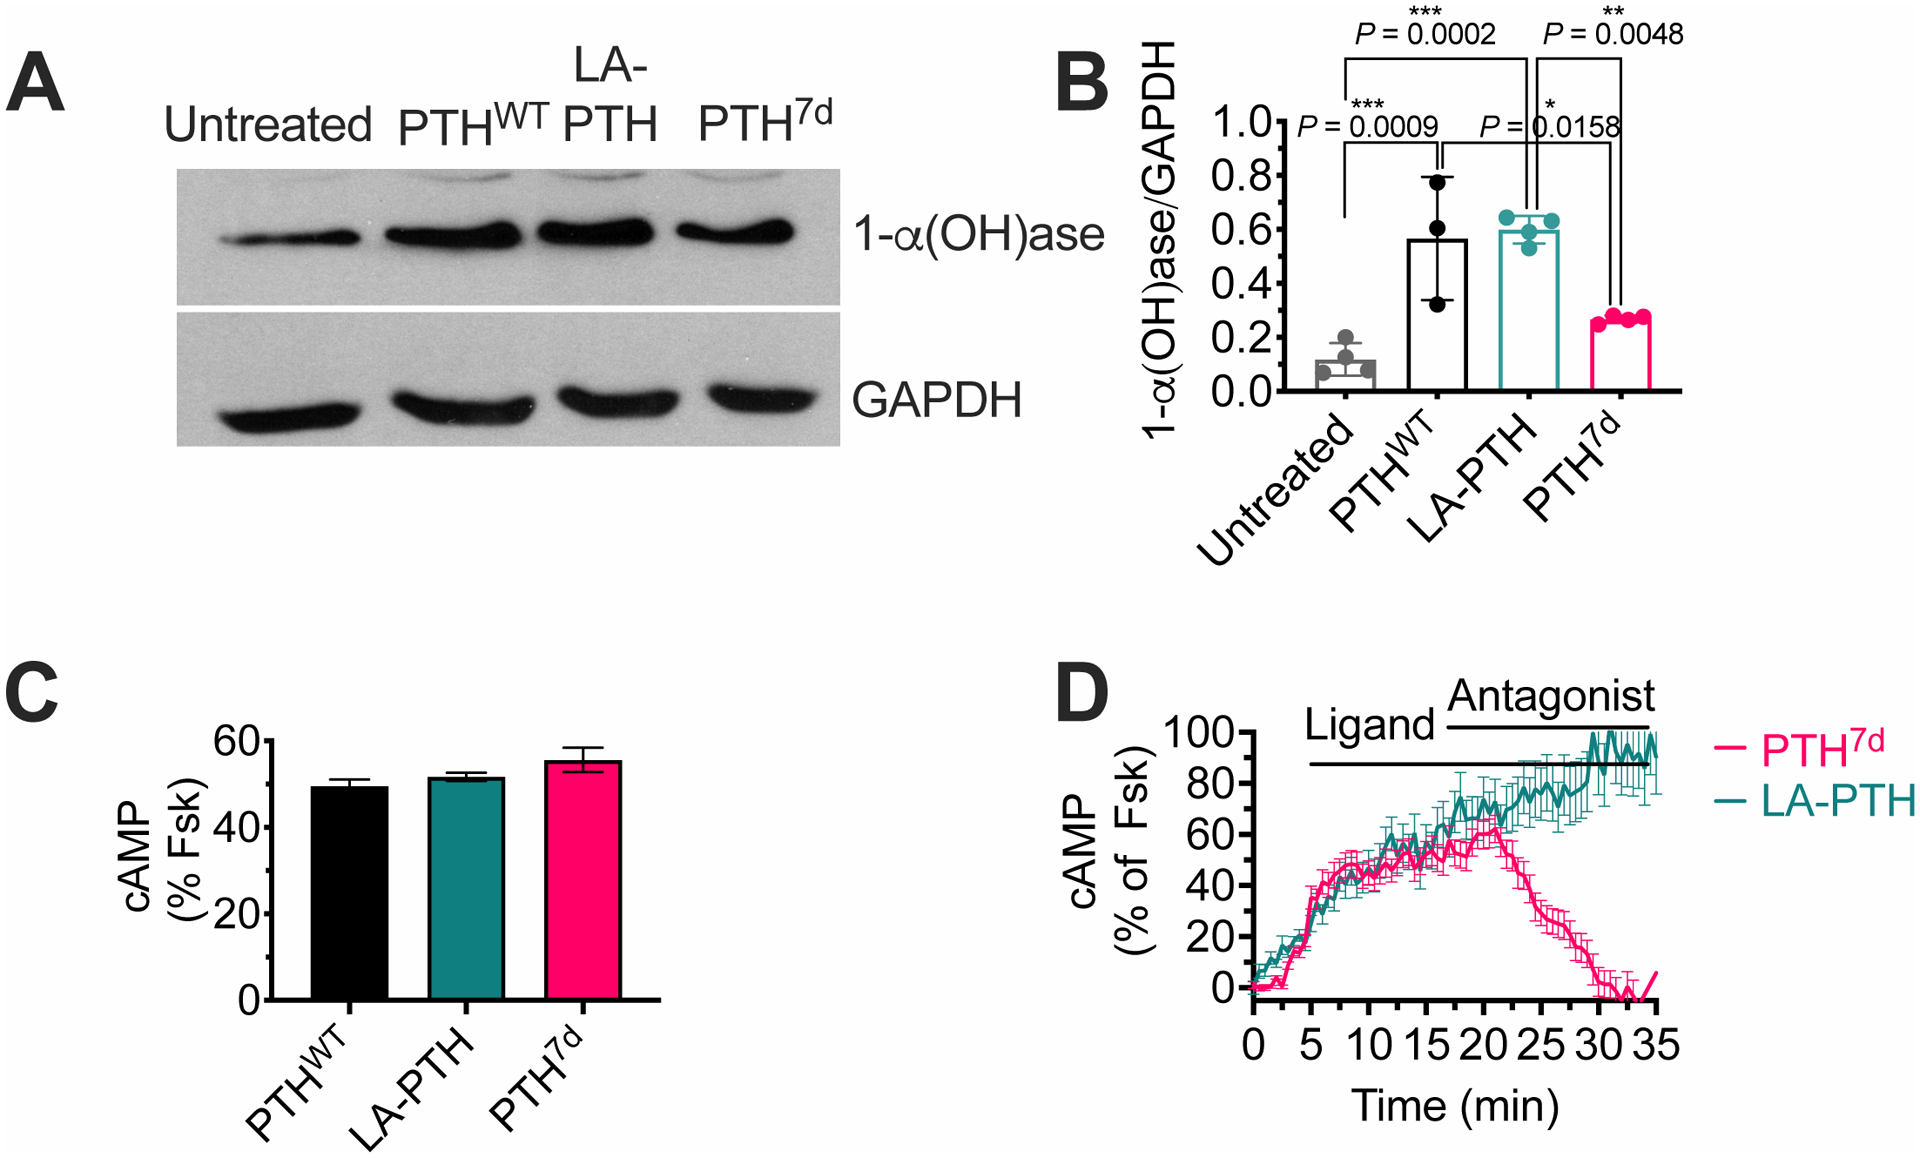
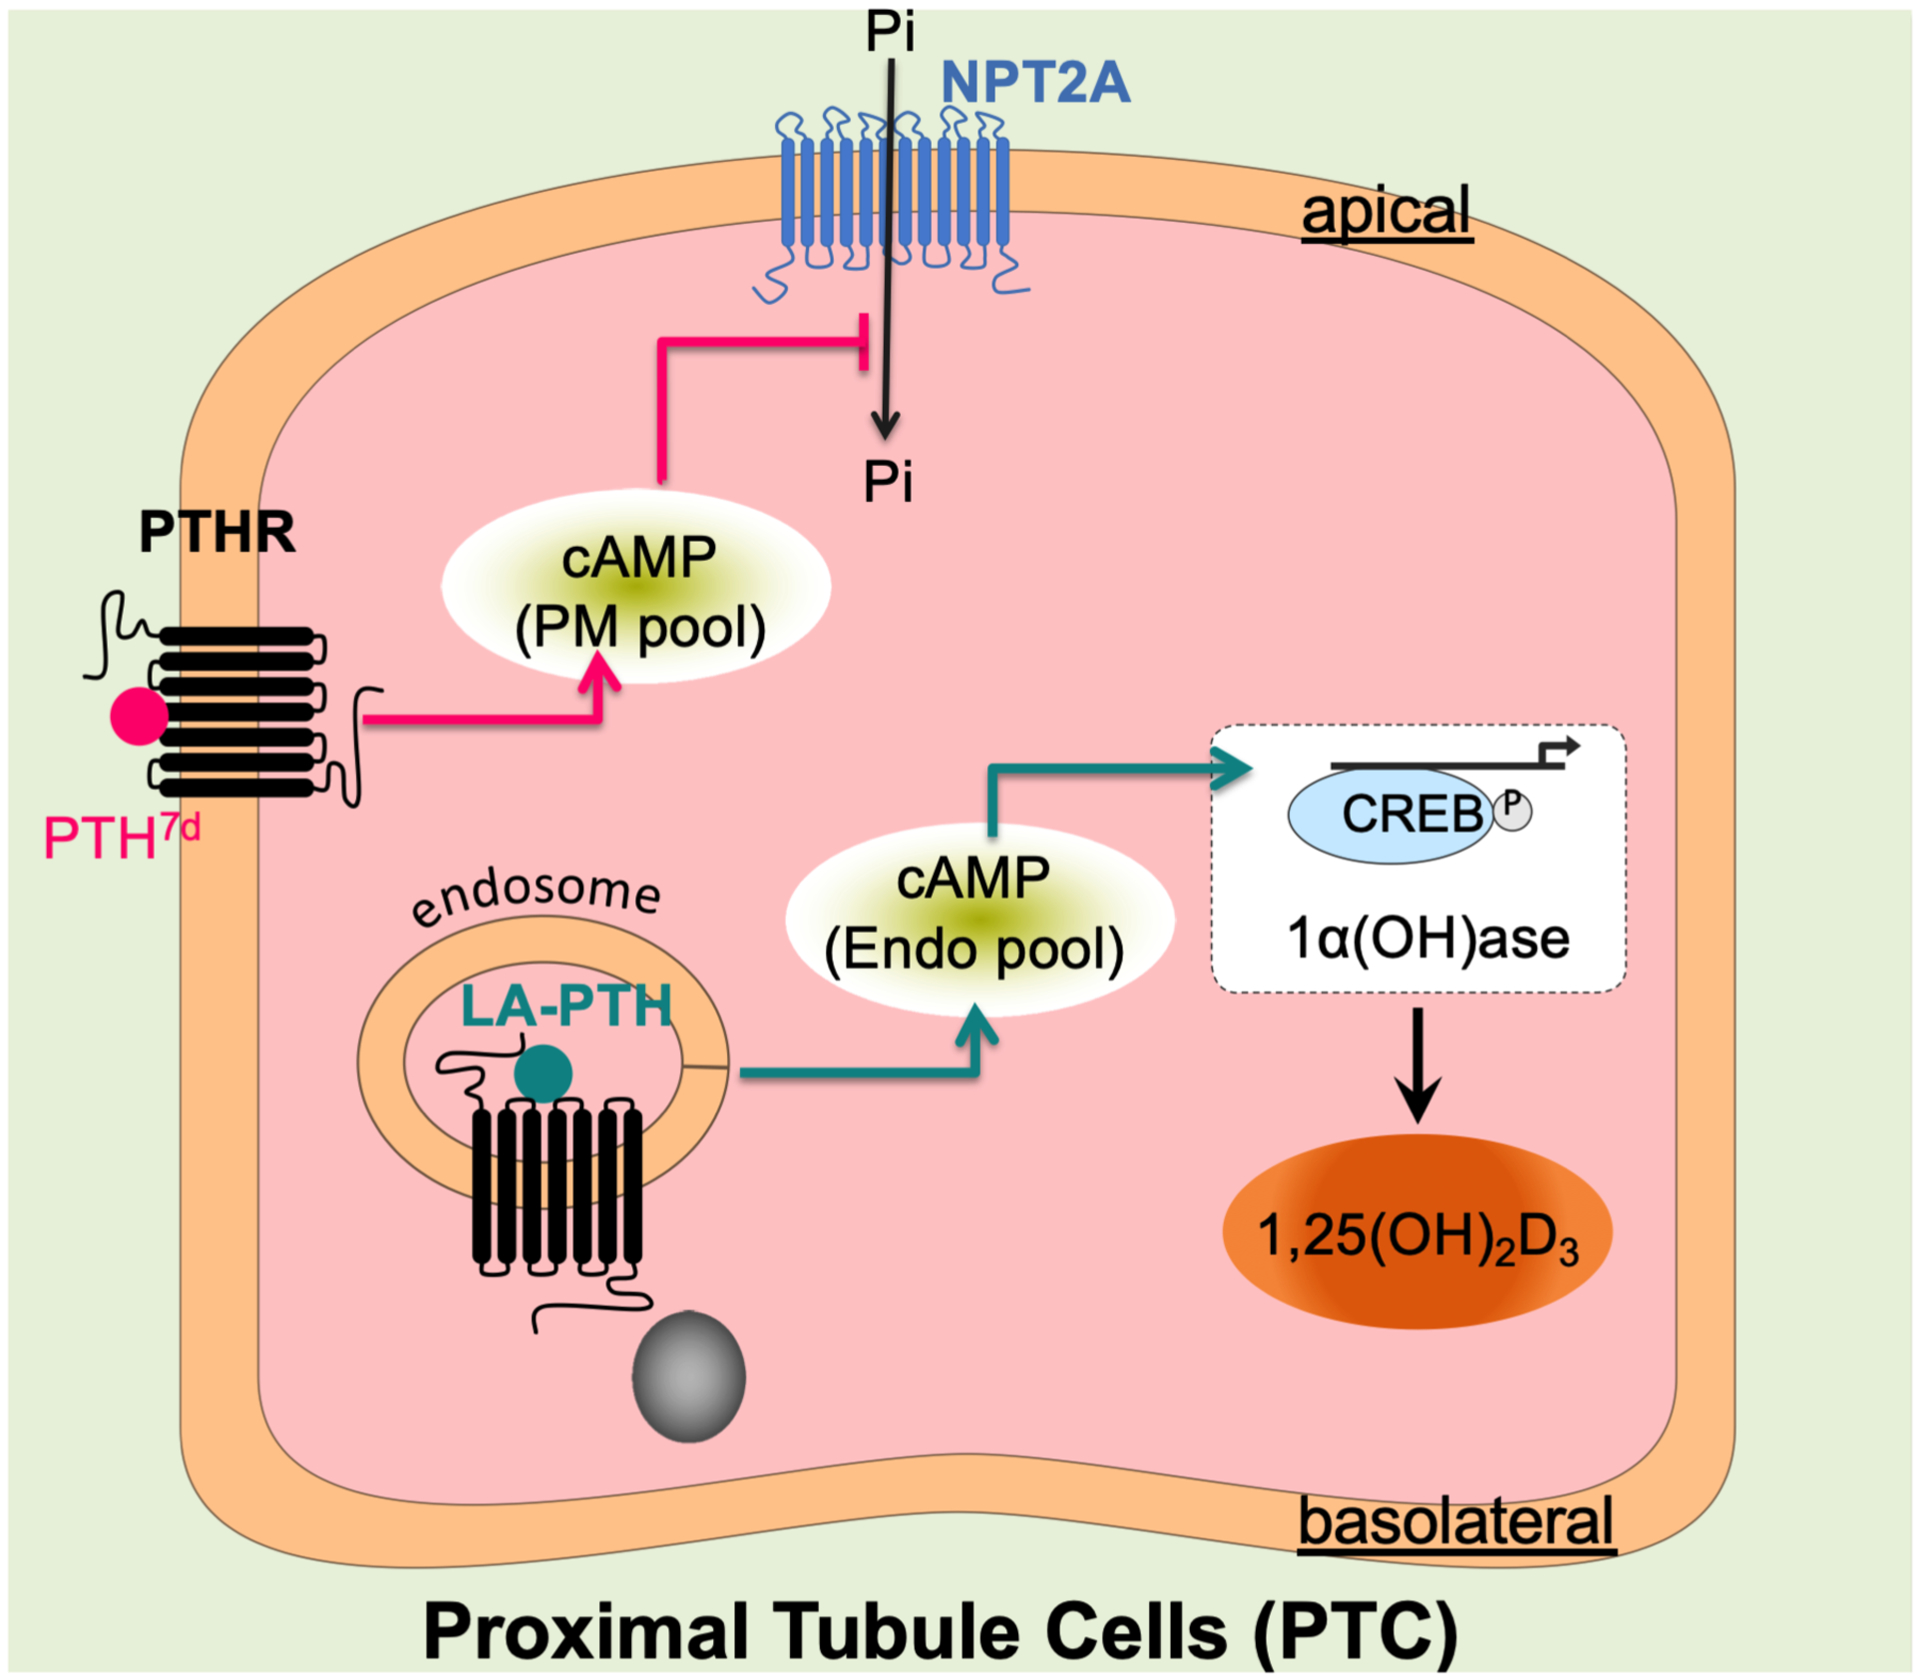
The parathyroid hormone (PTH) type 1 receptor (PTHR) is a class B G protein–coupled receptor (GPCR) that regulates mineral ion, vitamin D, and bone homeostasis. Activation of the PTHR by PTH induces both transient cell surface and sustained endosomal cAMP production. To address whether the spatial (location) or temporal (duration) dimension of PTHR-induced cAMP encodes distinct biological outcomes, we engineered a biased PTHR ligand (PTH7d) that elicits cAMP production at the plasma membrane but not at endosomes. PTH7d stabilized a unique active PTHR conformation that mediated sustained cAMP signaling at the plasma membrane due to impaired β-arrestin coupling to the receptor. Experiments in cells and mice revealed that sustained cAMP production by cell surface PTHR failed to mimic the pharmacological effects of sustained endosomal cAMP production on the abundance of the rate-limiting hydroxylase catalyzing the formation of active vitamin D, as well as increases in circulating active vitamin D and Ca2+ and in bone formation in mice. Thus, similar amounts of cAMP generated by PTHR for similar lengths of time in different cellular locations, plasma membrane and endosomes, mediate distinct physiological responses. These results unveil subcellular signaling location as a means to achieve specificity in PTHR-mediated biological outcomes and raise the prospect of rational drug design based upon spatiotemporal manipulation of GPCR signaling.


Conflict of interest statement

Competing interests: S.L. and S.H.G. are co-inventors on a patent application that includes PTH7d. S.H.G. is a cofounder of and has a secondary affiliation with Longevity Biotech, Inc. The other authors declare that they have no competing interests.

Figures

Fig. 1.
Fig. 1.. Characterization of a Gs-biased PTH analog generated by amino acid isomerization.
(A and B) Concentration-response curves for PTHWT, LA-PTH, and PTH7d in cAMP accumulation (A) or in β-arr1 or β-arr2 recruitment (B) assays. Data are means ± SEM from N = 5 independent experiments. (C) Time course and integrated response of β-arr2 recruitment measured by FRET in HEK293 cells transiently expressing PTHRCFP and β-arr2YFP following brief stimulation with 10 nM PTHWT or PTH7d. Data are means ± SEM from N = 3 independent experiments with n = 28–33 cells per experiment. ***, P < 0.005 by t-test. (D) Recruitment of endogenous β-arr1 and β-arr2 (βarr1/2) to PTHR detected by coimmunoprecipitation with HA-tagged PTHR (HAPTHR) stably expressed in HEK293 cells. Cells were challenged with 100 nM of either PTHWT, LAPTH, or PTH7d. Blot is representative of 2 independent experiments.
Fig. 2.
Fig. 2.. Location bias of PTH7d signaling.
(A) Averaged cAMP time-course responses following brief stimulation with 10 nM PTHWT, LAPTH, or PTH7d. Percentage of cAMP responses is relative to the response in the presence of forskolin (Fsk). Data are means ± SEM from N = 3 independent experiments with n = 20–26 cells per experiment. (B) Time courses and integrated responses after washout of 1 nM PTHWT, PTH7d, or LA-PTH in the presence or absence of cell-impermeable antagonist. Data are means ± SEM from N = 3 experiments. P = 0.01 (PTHWT), 0.39 (LA-PTH), and < 0.0001 (PTH7d) by t-test. (C) Time courses of internalization and recycling of PTHR tagged with super-ecliptic pHluorin (PTHRSEP) in response to 100 nM ligand measured by time-lapse confocal microscopy. A schematic depicting the measured values is also shown. Data are means ± SEM from N = 3 experiments with n = 11–14 cells per experiment. (D) Averaged nuclear cAMP and PKA activity time-course experiments following brief stimulation with 30 nM PTH7d or LA-PTH. Data are means ± SEM from N = 3 independent experiments with n = 9–14 cells per experiment.
Fig. 3.
Fig. 3.. Molecular changes induced by PTH7d.
(A) Competition binding at equilibrium with 125I-PTH1–15 and 125I-PTH1–34 as radioligands to detect the RG and R0 states of PTHR, respectively. Data are means ± SEM from N = 5 independent experiments with duplicate wells for each concentration. (B and C) The inset shows a schematic of the FRET-based PTHR activation sensor (PTHRCFP/YFP) with YFP (yellow) fused to ICL3, and CFP (blue) attached to the receptor C-terminal tail. The graph shows averaged time-courses of PTHR activation by recording changes of the FRET ratio in HEK 293 cells expressing PTHRCFP/YFP with the initial value at t = 0 set to 1 (B), and kinetics of PTHR activation (C). Cells were continuously perfused with control buffer or 1 μM agonist (horizontal bar). Data are means ± SD from N = 2 independent experiments. Note that the FRET data are expressed as FCFP/FYFP, resulting in a positive change upon agonist stimulation.
Fig. 4.
Fig. 4.. Differential pharmacological actions of PTH7d, PTHWT, and LAPTH in mice.
(A) 3-D reconstructed micro-computed tomography (μCT) images of secondary spongia at the distal femurs of mice treated with vehicle, PTH7d, PTHWT (PTH1–34), or LAPTH. Scale bar, 500μm. (B) Quantifications of skeletal parameters in trabecular (Tb) bone of distal femur, including total bone volume (TV), ratio of Tb bone volume (Tb.BV) to TV (Tb.BV/TV), Tb number (Tb.N), and Tb thickeness (Tb.Th). Parameters were assessed in mice subjected to daily injections of PTH7d, PTHWT, LA-PTH, or vehicle (Veh) for 4 weeks. Data are means ± SD from N = 7 mice/group for PTH7d and PTHWT injections and N = 14 mice/group for LA-PTH and Veh injections. *P < 0.03, ***P < 0.002, ***P < 0.0002 and ****P < 0.0001 vs Veh control mice by one-way ANOVA with Tukey-Kramer post-hoc test. (C) Quantification of serum Ca2+ (sCa2+) and phosphate (sPi) measured 2 hrs after the last of the 4-week daily injections of PTH7d, PTHWT, LA-PTH (40 μg/kg body weight/injection), or vehicle (Veh). Data are means ± SD from N = 7 mice/group. *P < 0.03, **P < 0.002, ***P < 0.0002 and ****P < 0.0001 vs Veh control mice by one-way ANOVA with Tukey-Kramer post-hoc test. (D) Quantification of serum 1.25D measured in mice before or 1, 2, 4, 8, 12, or 24 hrs after a single injection of PTH, PTH7d, or LA-PTH. Data are means ± SD from N = 7 mice/time point/drug and 15 mice for time “0” controls. Statistical analysis is shown in the Supplementary Materials (fig. S9).
Fig. 5.
Fig. 5.. Basolateral actions of PTH and its variants in polarized MDCK cells.
(A and B) Representative western blot (A) and quantification (B) of 1-α(OH)ase relative to GAPDH in polarized PTHR-expressing MDCK cells after basolateral stimulation with either LA-PTH, PTHWT, or PTH7D for 8 hours. Graph shows individual data points and means ± SD. P values were determined by one-way ANOVA with Tukey test. The P value for untreated vs PTH7d is 0.25. (C) Quantification of cAMP responses in polarized MDCK cells expressing the Green cADDis sensor at t = 30 min after basolateral stimulation with 100 nM PTHWT, LA-PTH, or PTH7d. Percentage of cAMP responses is relative to the response in the presence of forskolin (Fsk). Data are means ± SD from n = 90–107 cells. (D) cAMP time courses in polarized MDCK cells following addition of 100 nM LA-PTH or PTH7d in the absence or presence of 1 μM D-Trp12,Tyr34-bPTH7–34, a cell-impermeable competitive antagonist at the basolateral membrane. Horizontal bars indicate the application of ligand and antagonist. Data are means ± SEM from n = 48 cells.
Fig. 6.
Fig. 6.. Proposed model for location bias in cAMP and PTHR pharmacology.
Upon basolateral stimulation of proximal tubule kidney cells, the PTHR-generated endosomal cAMP pool ensures increases in serum Vitamin D by inducing the expression of 1-α(OH)ase, the rate-limiting hydroxylase catalyzing the formation of active Vitamin D, which subsequently stimulates an increase in serum Ca2+. The PTHR-generated plasma membrane cAMP pool might contribute to the inhibition of phosphate import, presumably by increasing endocytosis of the Na+-dependent phosphate cotransporter 2A (NPT2A).

References

    1. Fredriksson R, Schioth HB, The repertoire of G-protein-coupled receptors in fully sequenced genomes. Molecular pharmacology 67, 1414–1425 (2005). - PubMed
    1. Bockaert J, Pin JP, Molecular tinkering of G protein-coupled receptors: an evolutionary success. The EMBO journal 18, 1723–1729 (1999). - PMC - PubMed
    1. Galandrin S, Oligny-Longpre G, Bouvier M, The evasive nature of drug efficacy: implications for drug discovery. Trends in pharmacological sciences 28, 423–430 (2007). - PubMed
    1. Maudsley S, Martin B, Luttrell LM, The origins of diversity and specificity in g protein-coupled receptor signaling. The Journal of pharmacology and experimental therapeutics 314, 485–494 (2005). - PMC - PubMed
    1. Ferrandon S et al., Sustained cyclic AMP production by parathyroid hormone receptor endocytosis. Nat Chem Biol 5, 734–742 (2009). - PMC - PubMed

Publication types