. 2021 Nov 22;6(22):e148438.
doi: 10.1172/jci.insight.148438.

The TGF-β/HDAC7 axis suppresses TCA cycle metabolism in renal cancer

Affiliations

The TGF-β/HDAC7 axis suppresses TCA cycle metabolism in renal cancer

Hyeyoung Nam et al. JCI Insight. .

Abstract

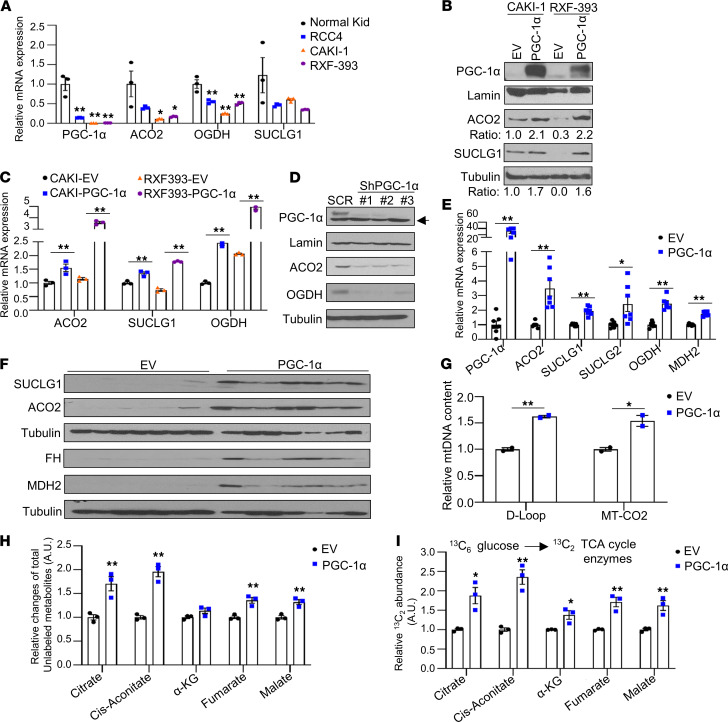
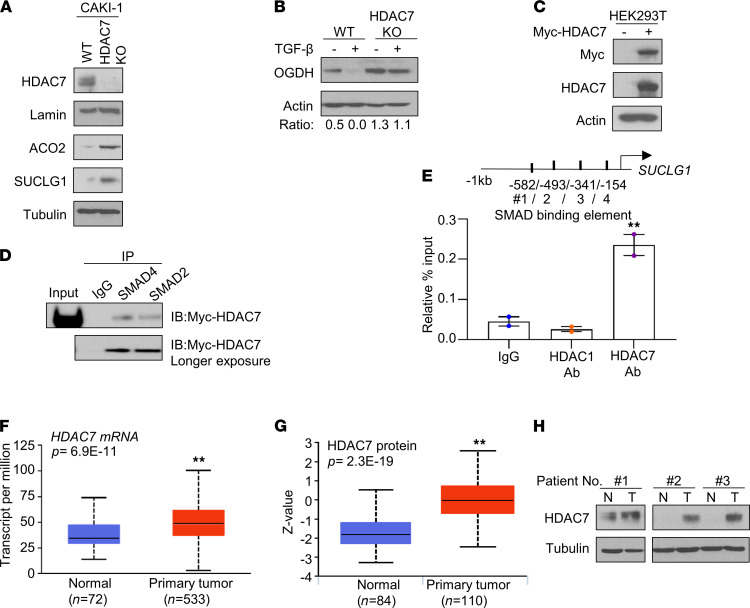
Mounting evidence points to alterations in mitochondrial metabolism in renal cell carcinoma (RCC). However, the mechanisms that regulate the TCA cycle in RCC remain uncharacterized. Here, we demonstrate that loss of TCA cycle enzyme expression is retained in RCC metastatic tissues. Moreover, proteomic analysis demonstrates that reduced TCA cycle enzyme expression is far more pronounced in RCC relative to other tumor types. Loss of TCA cycle enzyme expression is correlated with reduced expression of the transcription factor PGC-1α, which is also lost in RCC tissues. PGC-1α reexpression in RCC cells restores the expression of TCA cycle enzymes in vitro and in vivo and leads to enhanced glucose carbon incorporation into TCA cycle intermediates. Mechanistically, TGF-β signaling, in concert with histone deacetylase 7 (HDAC7), suppresses TCA cycle enzyme expression. Our studies show that pharmacologic inhibition of TGF-β restores the expression of TCA cycle enzymes and suppresses tumor growth in an orthotopic model of RCC. Taken together, this investigation reveals a potentially novel role for the TGF-β/HDAC7 axis in global suppression of TCA cycle enzymes in RCC and provides insight into the molecular basis of altered mitochondrial metabolism in this malignancy.

Keywords: Cancer; Cell Biology; Mitochondria; Molecular biology.


Conflict of interest statement

Conflict of interest: The authors have declared that no conflict of interest exists.

Figures

Figure 1
Figure 1. Suppression of TCA cycle enzymes in ccRCC.
(A) Immunoblot analysis of ACO2 and SUCLG1 in patient-matched normal kidney (N) and tumor (T) (n = 6). (B) Western blot analysis of ACO2 and SUCLG1 in a panel of RCC cell lines relative to RPTEC primary renal proximal tubule epithelial cells. The band intensities for ACO2 and SUCLG1 protein levels were quantified with reference to actin control bands using ImageJ program (NIH). (C) Protein expression of ACO2 and SUCLG1 across cancer subtypes from the CPTAC cohorts. (D) Heatmap representing expression patterns of TCA cycle enzymes in normal kidney (n = 72), VHL mutant RCC (n = 224), and VHL WT RCC (n = 225). Data were extracted from TCGA KIRC data set. The heatmap shows the log10-transformed TPM values for each gene. (E) Heatmap representing expression patterns of TCA cycle enzymes using the Illumina Human HT-12 v4 bead array in the 3-patient groups (normal, n = 9; primary, n = 9; and metastasis, n = 26). Colors in the heatmap represent log-transformed quantile normalized expression values. (F) Relative mRNA expression of TCA cycle enzymes in a separate cohort of patient-matched samples. Transcript levels were normalized to those of TBP (n = 4–6). Asterisks indicate significant differences compared with normal kidney (*P < 0.05, ** P < 0.01, 1-way ANOVA with Tukey’s multiple-comparison test).
Figure 2
Figure 2. PPARGC1A expression is positively correlated with the expression of TCA cycle enzymes in ccRCC.
(A) KEGG pathway analysis representing that the pathways are positively correlated with PPARGC1A in metastatic RCC samples (n = 26). (B and C) Positive correlation between PPARGC1A and TCA cycle enzymes in metastatic tumor samples determined by Pearson’s correlation (n = 26). (D and E) Results of correlation analysis between PPARGC1A and TCA cycle enzymes (ACO2 and SUCLG1) in TCGA KIRC data set for renal tumors. Data extracted using GEPIA web server.
Figure 3
Figure 3. PGC-1α reexpression upregulates the expression of TCA cycle enzymes and glucose flux to TCA cycle enzymes.
(A) Relative mRNA expression of the indicated genes in a panel of RCC cells relative to normal kidney (n = 3). Transcript levels were normalized to those of TBP (*P < 0.05, **P < 0.01, 1-way ANOVA with Tukey’s multiple-comparison test). (B) Western blot analysis of the indicated proteins in RCC cells stably expressing EV or PGC-1α. Relative intensities for target protein were quantified using ImageJ software. (C) mRNA expression of TCA cycle enzymes from RCC cells transduced either EV or PGC-1α (n = 3). Data represent mean ± SEM (**P < 0.01, 2-tailed Student’s t test). Data are representative of 3 independent experiments. (D) Western blot analysis of the indicated proteins in 769-P cells stably expressing shRNA control (SCR) or 3 independent PGC-1α shRNA constructs. Arrow represents nonspecific band. (E and F) SN12PM6-1 cells stably expressing EV or PGC-1α were orthotopically implanted into the left kidney of SCID mice. At 6 weeks from tumor challenge, kidney tissues were harvested and analyzed for the expression of mRNA (E) and protein for the indicated genes (F) (n = 7). (G) CAKI-1 cells stably expressing EV or PGC-1α were measured for the amount of mtDNA D-Loop structure and MT-CO2 gene (n = 2). (H and I) CAKI-1 cells stably expressing with EV or PGC-1α were incubated with uniformly labeled [U-13C6] glucose for 24 hours. The relative levels of total unlabeled metabolites (H) and labeled TCA cycle intermediates (I) (M+2) were analyzed using LC-MS (*P < 0.05, **P < 0.01, 2-tailed Student’s t test).
Figure 4
Figure 4. The expressions of PPARGC1A and TCA cycle enzymes are restored by blockade of TGF-β signaling.
(A) Relative mRNA expression of PPARGC1A in CAKI-1 cells treated with either DMSO (Con) or indicated pharmacological TGF-β inhibitors (10 μM) for 48 hours (n = 3). (B) Immunoblot analysis for PGC-1α protein expression in nuclear lysate from 769-P cells treated with indicated TGF-β inhibitors for 48 hours. (C and D) Relative mRNA expression of TCA cycle enzymes in 769-P and CAKI-1 cells treated with either DMSO or indicated TGF-β inhibitors (10 μM) for 48 hours (n = 3) (*P < 0.05, **P < 0.01, 1-way ANOVA with Tukey’s multiple-comparison test). (E) Immunoblot analysis for ACO2 and SUCLG1 protein expression in cell lysates from CAKI-1 cells treated with the indicated TGF-β inhibitor for 48 hours. (F) Western blot analysis of PGC-1α in nuclear lysates from HK2 cells exposed to TGF-β (1 ng/mL) for 24 hours. Lamin B1 was used as a loading control. (G) HK2 cells were exposed to TGF-β (1 ng/mL) for 24 hours, followed by immunoblot analysis for OGDH and SUCLG2 expression. Data are representative of 2–3 independent experiments. The unedited versions of all blot images are provided in Supplemental Figure 6.
Figure 5
Figure 5. The effect of TGF-β inhibition on cellular bioenergetics and TCA cycle enzyme expression is abolished in PGC-1α–deficient cells.
(A and B) Oxygen consumption rate (OCR) was analyzed in CAKI-1 cells treated with either DMSO (Con) or indicated pharmacological TGF-β inhibitor (10 μM) for 48 hours (n = 6~8). Oligomycin (1.5 μg/mL), FCCP (0.6 μM), and antimycin A (10 μM) were sequentially added to the cells. Representative cellular bioenergetic profiles (A) and individual parameters (B) are shown. (C) Immunoblot analysis for PGC-1α in nuclear lysates from 769-P cells transfected with either 50 nM negative control or PGC-1α siRNA in the presence of SB431542 (20 μM) for 48 hours. (D) Immunoblot analysis for TCA cycle enzymes in cell lysates from 769-P cells transfected with either NC or PGC-1α siRNA in the presence of SB431542 for 48 hours. Relative intensities for SUCLG2 and ACO2 protein expressions were quantified using ImageJ software. (E and F) OCR was analyzed in 769-P cells transfected with either 50 nM NC or PGC-1α siRNA in the absence or presence of SB431542 (20 μM) for 48 hours. OCR data are representative of 2 independent experiments, and data are means ± SEM; n = 6–8. Asterisks indicate differences relative to control (*P < 0.05, **P < 0.01, 1-way ANOVA with Tukey’s multiple-comparison test). The unedited versions of all blot images are provided in Supplemental Figure 6.
Figure 6
Figure 6. Inhibition of TGF-β signaling suppresses tumor formation and restores the expression of PPARGC1A and TCA cycle enzymes in vivo.
(A) CAKI-1 luciferase-expressing cells (1.5 × 10⁶) were implanted into renal subcapsular region of SCID mice (n = 3). Tumor formation was confirmed 1 week after cell injection, and mice were injected i.p. with either DMSO or SB431542 three times per week for 5 weeks (10 mg/kg in 20% DMSO). The in vivo luciferase bioluminescence was taken at 5 weeks after treatment with either DMSO or SB431542. (B) At 5 weeks after treatment, kidney tissues were harvested and weighed. (C) The RNA was isolated from kidney tumors of mice treated with either DMSO or SB431542 and analyzed for mRNA expression of PPARGC1A. Transcript levels were normalized to those of RPLPO (*P < 0.05, **P < 0.01, 2-tailed Student’s t test). (D) Immunoblot analysis of PGC-1α in kidney tissues from the mice treated with either DMSO or SB431542. (E and F) Relative mRNA and protein expression of TCA cycle enzymes in kidney tissues from the mice treated with either DMSO or SB431542. Relative intensities for target protein were quantified using ImageJ software. Transcript levels were normalized to those of RPLPO. All data are presented as ± SEM; n = 3 (*P < 0.05, **P < 0.01, 2-tailed Student’s t test).
Figure 7
Figure 7. The expression of TCA cycle enzymes is restored by HDAC7 knockdown.
(A) The mRNA expression of TCA cycle enzymes in CAKI-1 cells transfected with negative control (NC) or TGIF2 siRNA for 72 hours (n = 3). (B) SUCLG1 protein expression in CAKI-1 cells transfected with NC or 2 independent TGIF2 siRNA constructs for 72 hours. (C) The mRNA expression of PPARGC1A in CAKI-1 cells treated with Trichostatin A (TSA) for 24 hours (n = 3). (D) Immunoblot analysis for PGC-1α in nuclear lysate from 769-P and CAKI-1 cells treated with TSA for 24 hours. Arrow represents nonspecific band. (E) The mRNA expression of TCA cycle enzymes in CAKI-1 cells treated with TSA for 24 hours. Data are representative of 3 independent experiments and show mean ± SEM. Asterisks indicate significant differences compared with control (**P < 0.01, 2-tailed Student’s t test). (F) Immunoblot analysis for TCA cycle enzymes in cell lysate from 769-P and CAKI-1 cells treated with TSA for 24 hours. (G) 769-P cells were transfected with the indicated HDAC siRNA or NC for 72 hours. Relative mRNA expression was analyzed for TCA cycle enzymes (n = 3). Asterisks indicate significant differences compared with NC (*P < 0.05, **P < 0.01, 1-way ANOVA with Tukey’s multiple-comparison test). (H) Immunoblot analysis for the indicated proteins in cell lysates from 769-P cells transfected with either NC or 2 independent HDAC7 siRNA constructs for 72 hours. Date are representative of at least 2 independent experiments.
Figure 8
Figure 8. HDAC7/SMAD complex represses the TCA cycle enzyme expression.
(A) Western blot analysis of the indicated protein levels in WT CAKI-1 (WT) and HDAC7 CRISPR–KO CAKI-1 (HDAC7-KO). (B) WT CAKI-1 and HDAC7-KO cells were treated with or without TGF-β (1 ng/mL) for 24 hours, followed by the immunoblot analysis for OGDH. (C) Immunoblot analysis for Myc and HDAC7 in HEK293T cells transfected with EV or Myc-tagged HDAC7 for 48 hours. (D) HEK293T cells transfecting with Myc-tagged HDAC7 were immunoprecipitated using either anti-SMAD4, anti-SMAD2, or control IgG. IP samples with individual SMAD antibody were followed by immunoblotting (IB) for Myc-tagged HDAC7. IgG pulldown is included as a control. (E) ChIP-qPCR was performed on CAKI-1 cells with mouse IgG, anti-HDAC1, and anti-HDAC7. The enriched DNA was quantified by qPCR with primer sets targeting the potential SMAD binding sites upstream of the SUCLG1 transcription start site. Enrichment was calculated with the percent input method (n = 2/group, 3 independent experiments). Asterisks indicate significant differences compared with IgG control. (F) RNA-Seq analysis for HDAC7 mRNA expression in renal tumors from the TCGA data set using UALCAN analysis. (G) Protein expression of HDAC7 in normal kidney and primary tumor from the CPTAC data using UALCAN analysis. (H) Immunoblot analysis of HDAC7 in patient-matched normal kidney (N) and tumor (T). **P < 0.01, 1-way ANOVA with Tukey’s multiple-comparison test.

Similar articles

Cited by

References

    1. Janzen NK, et al. Surveillance after radical or partial nephrectomy for localized renal cell carcinoma and management of recurrent disease. Urol Clin North Am. 2003;30(4):843–852. doi: 10.1016/S0094-0143(03)00056-9. - DOI - PubMed
    1. Jemal A, et al. Cancer statistics, 2005. CA Cancer J Clin. 2005;55(1):10–30. doi: 10.3322/canjclin.55.1.10. - DOI - PubMed
    1. Kibel A, et al. Binding of the von Hippel-Lindau tumor suppressor protein to Elongin B and C. Science. 1995;269(5229):1444–1446. doi: 10.1126/science.7660130. - DOI - PubMed
    1. Ivan M, et al. HIFalpha targeted for VHL-mediated destruction by proline hydroxylation: implications for O2 sensing. Science. 2001;292(5516):464–468. doi: 10.1126/science.1059817. - DOI - PubMed
    1. Kaelin WG, The von Hippel-Lindau protein, HIF hydroxylation, and oxygen sensing. Biochem Biophys Res Commun. 2005;338(1):627–638. doi: 10.1016/j.bbrc.2005.08.165. - DOI - PubMed

Publication types

Substances