. 2021 Dec 8;6(23):e152465.
doi: 10.1172/jci.insight.152465.

Controlled human malaria infection with a clone of Plasmodium vivax with high-quality genome assembly

Affiliations

Controlled human malaria infection with a clone of Plasmodium vivax with high-quality genome assembly

Angela M Minassian et al. JCI Insight. .

Abstract

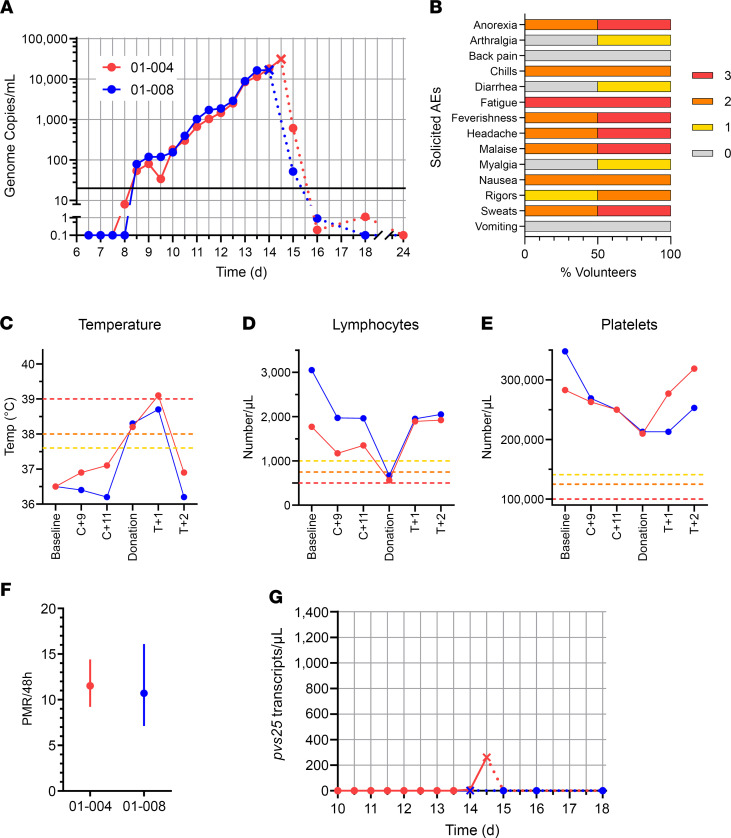
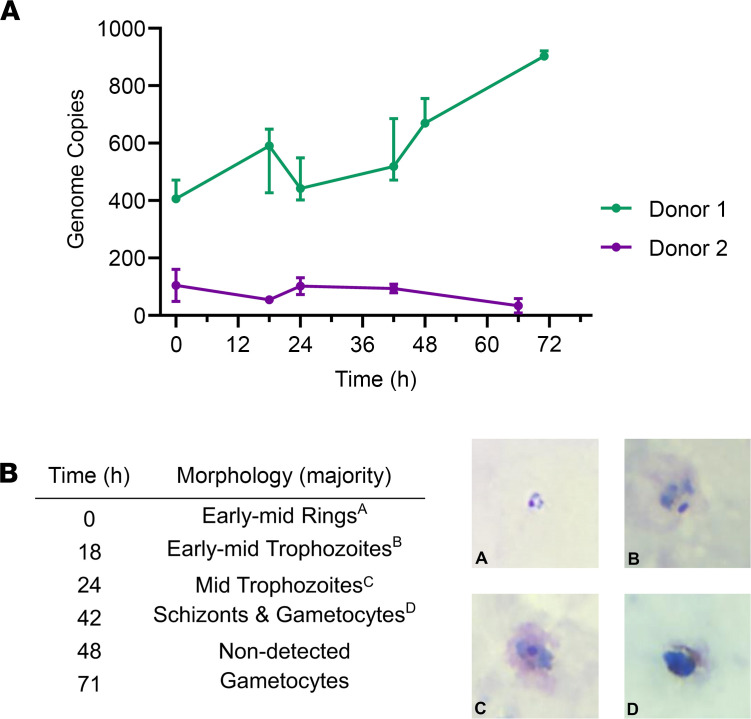
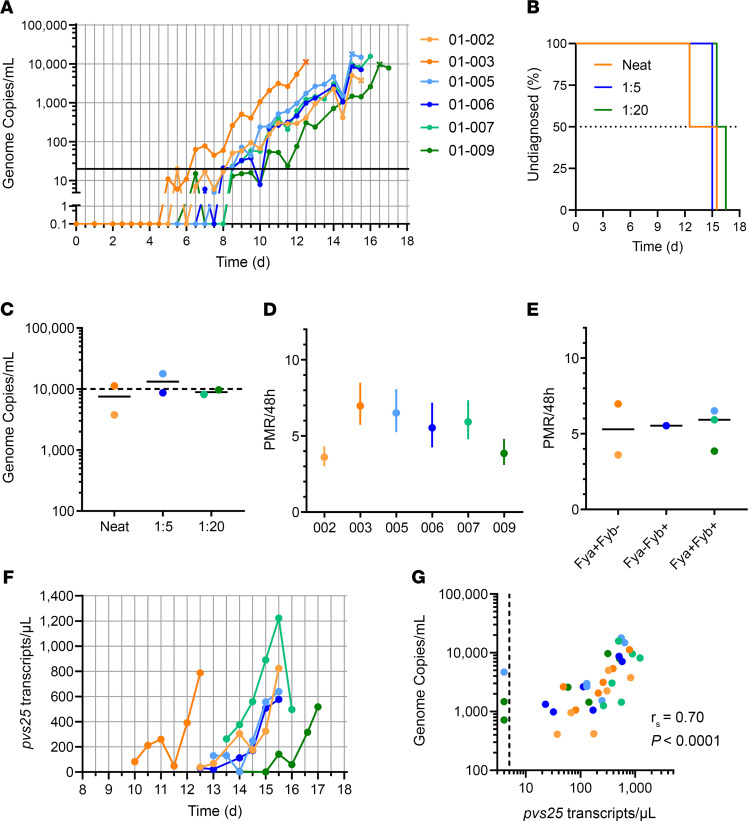
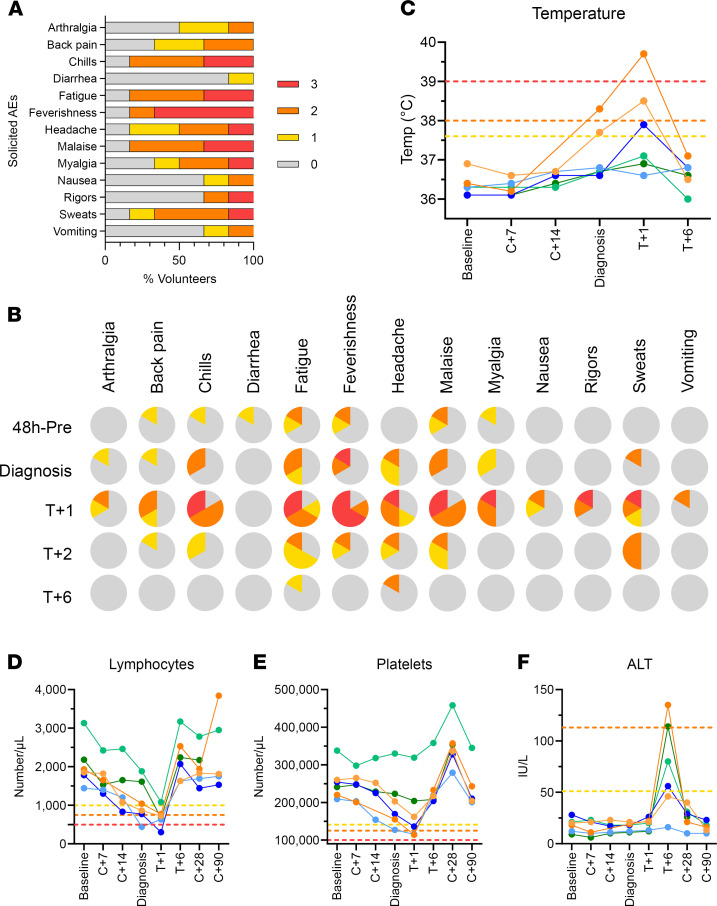
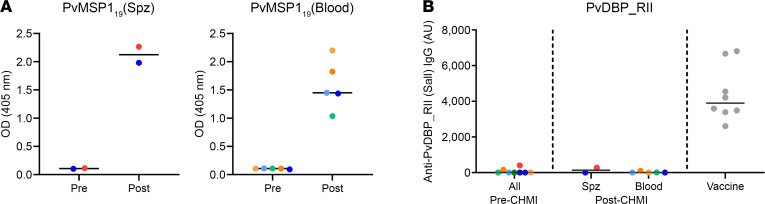
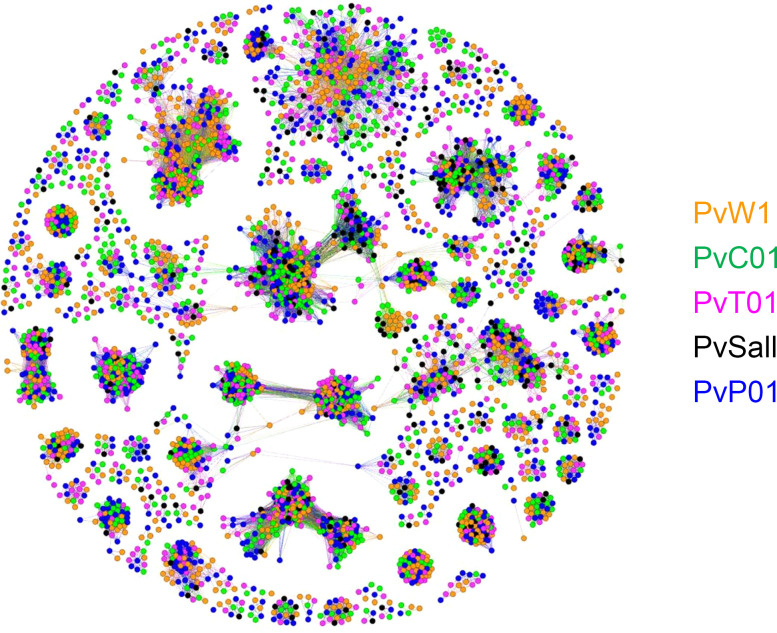
Controlled human malaria infection (CHMI) provides a highly informative means to investigate host-pathogen interactions and enable in vivo proof-of-concept efficacy testing of new drugs and vaccines. However, unlike Plasmodium falciparum, well-characterized P. vivax parasites that are safe and suitable for use in modern CHMI models are limited. Here, 2 healthy malaria-naive United Kingdom adults with universal donor blood group were safely infected with a clone of P. vivax from Thailand by mosquito-bite CHMI. Parasitemia developed in both volunteers, and prior to treatment, each volunteer donated blood to produce a cryopreserved stabilate of infected RBCs. Following stringent safety screening, the parasite stabilate from one of these donors (PvW1) was thawed and used to inoculate 6 healthy malaria-naive United Kingdom adults by blood-stage CHMI, at 3 different dilutions. Parasitemia developed in all volunteers, who were then successfully drug treated. PvW1 parasite DNA was isolated and sequenced to produce a high-quality genome assembly by using a hybrid assembly method. We analyzed leading vaccine candidate antigens and multigene families, including the vivax interspersed repeat (VIR) genes, of which we identified 1145 in the PvW1 genome. Our genomic analysis will guide future assessment of candidate vaccines and drugs, as well as experimental medicine studies.

Trial registration: ClinicalTrials.gov NCT03797989 NCT03377296.

Keywords: Infectious disease; Malaria.


Figures

Figure 1
Figure 1. Safety and parasite growth dynamics of P. vivax sporozoite CHMI.
(A) qPCR data for the VAC068 trial (n = 2). Parasitemia measured in genome copies/mL is shown over time for each volunteer. CHMI was initiated by mosquito bite on day 0. Cross symbols indicate the time point of blood donation followed by antimalarial treatment. Solid lines show qPCR readouts before treatment, and dotted lines after treatment. Solid black line indicates 20 gc/mL (the minimum level to meet positive reporting criteria); samples below this are shown for information only. (B) The solicited systemic adverse events (AEs) recorded during the CHMI period (from 1 day up until 45 days after challenge) are shown as the maximum severity reported by each volunteer and as a percentage of the volunteers reporting each individual AE (n = 2). Color-coding refers to AE grading: 0 = none; 1 = mild; 2 = moderate; 3 = severe. (C) Volunteer temperature (maximum self-recorded by volunteer or measured in clinic) at the indicated time points: baseline before CHMI; 9 and 11 days after CHMI (C+9, C+11); time of blood donation; and 1 and 2 days after treatment (T+1, T+2). AE grading cut-offs are indicated by the dotted lines (yellow = grade 1; orange = grade 2; red = grade 3). (D and E) Lymphocyte and platelet counts plotted as for C. (F) The PMR per 48 hours was modeled from the qPCR data up until the time point of blood donation/treatment; PMR ± 95% CI is shown for each volunteer. (G) Gametocytemia was assessed over time by qPCR for pvs25 transcripts; symbols and lines as per A.
Figure 2
Figure 2. Test of cryopreserved parasite viability by short-term in vitro culture assay.
(A) Test vials of cryopreserved parasites from Donor 1 and Donor 2 were thawed, and cells were used in a short-term in vitro parasite culture assay. P. vivax parasite growth was monitored by qPCR in 20 μL samples of RBC extracted at the indicated time points. Median and range of triplicate readings are shown in genome copies measured per 20 μL sample. (B) Parasite morphology was monitored at the same time points over the first growth cycle by light microscopy of Giemsa-stained thick and thin blood films Representative images are shown from Donor 1, and the predominant morphology observed is reported. Total original magnification, ×1000.
Figure 3
Figure 3. Parasite growth dynamics of P. vivax PvW1 clone blood-stage CHMI.
(A) qPCR data for the VAC069A trial (n = 6). Parasitemia measured in genome copies (gc)/mL is shown over time for each volunteer. CHMI was initiated by blood-stage inoculation on day 0. Cross symbols indicate the time point of diagnosis. Orange = neat inoculum dose; blue = 1:5; green = 1:20 dilution of the neat inoculum dose. Solid black line indicates 20 gc/mL (the minimum level to meet positive reporting criteria); samples below this are shown for information only. (B) Kaplan-Meier plot of time to diagnosis in days for the VAC069A study (n = 2/group). (C) Parasitemia measured in gc/mL at the time point of diagnosis. Individual data points and median are indicated for each dose group. Volunteers were diagnosed when they reached a threshold of 10,000 gc/mL OR if they had symptoms of malaria with a parasitemia > 5,000 gc/mL. (D) The PMR per 48 hours was modeled from the qPCR data up until the time point of diagnosis; PMR ± 95% CI is shown for each volunteer. (E) Individual and median PMR are shown with volunteers grouped according to their Duffy blood group antigen (Fy) serological phenotype. (F) Gametocytemia was assessed over time by qPCR for pvs25 transcripts; colored lines as per A. (G) Correlation of total parasitemia measured in gc/mL versus pvs25 transcripts/μL. Spearman’s rank correlation coefficient and P value are shown; n = 36.
Figure 4
Figure 4. Safety analysis of P. vivax PvW1 clone blood-stage CHMI.
(A) The solicited systemic adverse events (AEs) recorded during the CHMI period (from 1 day up until 90 days after challenge) are shown as the maximum severity reported by each volunteer and as a percentage of the volunteers reporting each individual AE (n = 6). Color-coding refers to AE grading: 0 = none; 1 = mild; 2 = moderate; 3 = severe. (B) The solicited systemic AEs recorded at the indicated time points during the CHMI period are shown as the maximum severity reported by each volunteer and as a percentage of the volunteers reporting each individual AE (n = 6). Color-coding as per A. 48h-pre = the 48 hour period prior to P. vivax diagnosis; Diagnosis = time point of diagnosis; T+1, T+2, and T+6 = indicated days after treatment. (C) Volunteer temperature (maximum self-recorded by volunteer or measured in clinic) at the indicated time points: baseline before CHMI; 7 and 14 days after CHMI (C+7, C+14); time of diagnosis; and 1 and 6 days after treatment (T+1, T+6). AE grading cut-offs are indicated by the dotted lines (yellow = grade 1; orange = grade 2; red = grade 3). (DF) Lymphocyte (D) and platelet counts (E), and alanine aminotransferase (ALT) measurements (F), all plotted as for C but also including C+28 and C+90 time points.
Figure 5
Figure 5. Induction of serum antibody responses to merozoite antigens during CHMI.
(A) Serum anti-PvMSP119 IgG ELISA was conducted on samples from the VAC068 mosquito-bite/sporozoite (spz) CHMI study (n = 2) and the VAC069A blood-stage CHMI study (n = 5, because 1 volunteer withdrew at dC+28). OD 405 nm data are shown for sera tested at a 1:100 dilution from the pre-CHMI (dC–1) and 90 days post-CHMI (dC+90) time points. Samples color-coded as per previous figures. (B) Serum anti-PvDBP_RII (SalI allele) IgG as measured by standardized ELISA, reporting in arbitrary units (AU). Same samples tested as in A. Vaccine = positive control samples (n = 8) from a previous Phase Ia clinical trial of a PvDBP_RII vaccine (29). Individual data points and median are shown.
Figure 6
Figure 6. Cluster analysis of the PvW1 VIR proteins.
Cluster analysis of the 1145 predicted VIR proteins encoded by the PvW1 genome compared with those of other P. vivax isolates (30, 31). Each spot represents a VIR protein from either PvW1 (orange), PvC01 (green), PvT01 (pink), PvSalI (black), and PvP01 (blue). Relatedness between the proteins is represented by distance; therefore, more closely related proteins cluster together. Most of the clusters contain proteins from several isolates, suggesting that the clusters are not restricted to specific genomes or geographical distribution.

Similar articles

Cited by

References

    1. Gething PW, et al. A long neglected world malaria map: Plasmodium vivax endemicity in 2010. PLoS Negl Trop Dis. 2012;6(9):e1814. doi: 10.1371/journal.pntd.0001814. - DOI - PMC - PubMed
    1. Baird JK. Evidence and implications of mortality associated with acute Plasmodium vivax malaria. Clin Microbiol Rev. 2013;26(1):36–57. doi: 10.1128/CMR.00074-12. - DOI - PMC - PubMed
    1. Galinski MR, Barnwell JW. Plasmodium vivax: who cares? Malar J. 2008;7(suppl 1):S9. - PMC - PubMed
    1. Mueller I, et al. Key gaps in the knowledge of Plasmodium vivax, a neglected human malaria parasite. Lancet Infect Dis. 2009;9(9):555–566. doi: 10.1016/S1473-3099(09)70177-X. - DOI - PubMed
    1. White NJ. Determinants of relapse periodicity in Plasmodium vivax malaria. Malar J. 2011;10:297. doi: 10.1186/1475-2875-10-297. - DOI - PMC - PubMed

Publication types

Associated data