. 2021 Nov 15;131(22):e152067.
doi: 10.1172/JCI152067.

RBMS1 regulates lung cancer ferroptosis through translational control of SLC7A11

Affiliations

RBMS1 regulates lung cancer ferroptosis through translational control of SLC7A11

Wenjing Zhang et al. J Clin Invest. .

Abstract

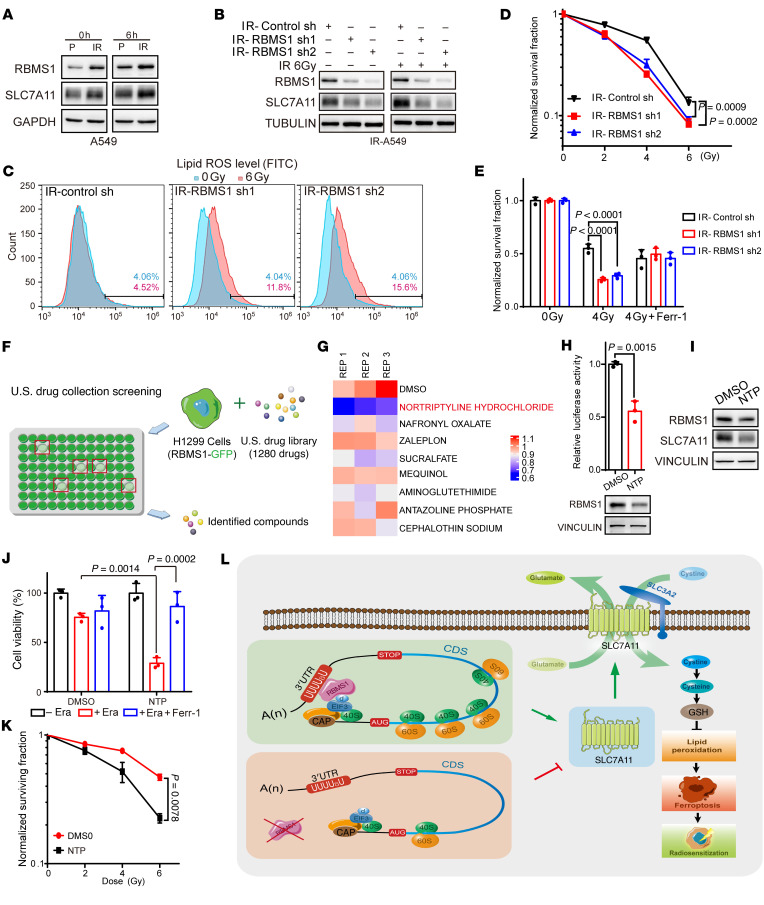
Ferroptosis, an iron-dependent nonapoptotic cell death, is a highly regulated tumor suppressing process. However, functions and mechanisms of RNA-binding proteins in regulation of evasion of ferroptosis during lung cancer progression are still largely unknown. Here, we report that the RNA-binding protein RBMS1 participates in lung cancer development via mediating ferroptosis evasion. Through an shRNA-mediated systematic screen, we discovered that RBMS1 is a key ferroptosis regulator. Clinically, RBMS1 was elevated in lung cancer and its high expression was associated with reduced patient survival. Conversely, depletion of RBMS1 inhibited lung cancer progression both in vivo and in vitro. Mechanistically, RBMS1 interacted with the translation initiation factor eIF3d directly to bridge the 3'- and 5'-UTR of SLC7A11. RBMS1 ablation inhibited the translation of SLC7A11, reduced SLC7A11-mediated cystine uptake, and promoted ferroptosis. In a drug screen that targeted RBMS1, we further uncovered that nortriptyline hydrochloride decreased the level of RBMS1, thereby promoting ferroptosis. Importantly, RBMS1 depletion or inhibition by nortriptyline hydrochloride sensitized radioresistant lung cancer cells to radiotherapy. Our findings established RBMS1 as a translational regulator of ferroptosis and a prognostic factor with therapeutic potential and clinical value.

Keywords: Cell Biology; Lung cancer; Molecular biology; Oncology; Translation.


Figures

Figure 1
Figure 1. Systematic identification of RBMS1 as a key regulator of ferroptosis in lung cancer.
(A) Workflow for RBP identification in ferroptosis regulation. A549 cells were infected with 190 viruses expressing shRNAs against distinct RBPs. (B) Volcano plot illustrating RBPs involved in regulating ferroptosis. The top 10 candidates are marked. (C) Heatmap depicting viability of A549 cells (with the top 10 RBPs identified in B depleted using distinct shRNAs) treated with erastin or erastin and ferrostatin-1 (Ferr-1). (D) Lipid peroxidation was measured by flow cytometry after C11-BODIPY staining in RBMS1-depleted H1299 cells. (E) RBMS1-depleted H1299 cells were treated with erastin and analyzed by TEM. Scale bars: 500 nm (rows 1 and 3) and 100 nm (rows 2 and 4). (F) RBMS1-depleted H1299 cells were treated with or without erastin and stained with Rho123, a known mitochondria-tracking probe, and analyzed by SIM. Scale bars: 2 μm.
Figure 2
Figure 2. RBMS1 ablation promotes lung cancer cell ferroptosis.
(A) Cell viability was assessed after treatment with different concentrations of erastin in RBMS1-depleted H1299 cells. (B) Cell death was measured after treatment with erastin (Era) or Ferr-1 and erastin in RBMS1-depleted H1299 cells. (C) Representative phase-contrast images of RBMS1-depleted H1299 cells treated with erastin, erastin and Ferr-1, erastin and Z-VAD-FMK (Z-VAD), or erastin and 3-methylademine (3-MA). Scale bar: 100 μm. (D and E) Bar graphs showing viability of RBMS1-depleted H1299 cells treated with erastin (D) or tert-butyl hydroperoxide (TBH) (E) combined with Ferr-1, Z-VAD, or 3-MA. (F) Viability of RBMS1-depleted H1299 cells was measured after culturing in low-cystine medium combined with Ferr-1, Z-VAD, or 3-MA. (G) Bar graph showing death of BMS1-depleted H1299 cells cultured in low-cystine medium with or without Ferr-1. (H and I) Cell death (H) and viability (I) were measured after treatment with erastin or erastin and Ferr-1 in RBMS1-depleted H1299 cells with or without RBMS1 reexpression. Data represent mean ± SEM, with n = 3 (A and F) or 4 (B, D, E, and GI) independent repeats. P values were determined using 1-way repeated measures ANOVA (A) or 1-way ANOVA with Tukey’s multiple comparison test (B, D, and EI).
Figure 3
Figure 3. RBMS1 is associated with lung cancer progression and prognosis in humans and mice.
(A) Representative images from immunohistochemical staining of RBMS1 in lung cancer (n = 60) and matched adjacent normal tissues (n = 60). Scale bars: 100 μm (top) and 50 μm (bottom). (B) The quantification of RBMS1 protein level in lung cancer and adjacent normal lung tissues. The RBMS1 levels were classified into 3 grades (weak positive/negative, strong positive, extra-strong positive) based on quantification of immunohistochemical staining and plotted. (C) Kaplan-Meier curve showing overall survival of lung cancer patients with high or low RBMS1 expression. (D) Micro-CT images in the indicated planes from female mice with or without RBMS1 deletion (KrasG12D/WT/Rbms1WT or KrasG12D/WT/Rbms1fl/fl CKO) in lungs at 5 or 8 weeks after infection with 9 × 10¹⁰ vg AAV-GFP-Cre. Three-dimensional rendering of micro-CT data shows lungs in gray. The lung tumor areas of KrasG12D/WT/Rbms1WT and KrasG12D/WT/Rbms1fl/fl CKO mice are outlined in red in the axial plane pictures. (E) The lung tumor areas of KrasG12D/WT/Rbms1WT and KrasG12D/WT/Rbms1fl/fl CKO mice marked in D were calculated. The median and upper and lower quartiles of tumor areas were plotted as box-and-whisker plot (n = 5, P values from unpaired t test). (F) Tumors were removed from KrasG12D/WT/Rbms1WT and KrasG12D/WT/Rbms1fl/fl CKO mice and subjected to immunohistochemical staining with anti-RBMS1 and anti-4HNE antibodies. Representative images (n = 5) are shown. Scale bars: 100 μm (top row), 50 μm (second row), and 30 μm (rows 3 and 4).
Figure 4
Figure 4. Loss of RBMS1 inhibits lung cancer cell proliferation and progression in vitro and in vivo.
(A) Levels of RBMS1 in the indicated lung cancer cell lines and normal bronchial cell lines were measured by Western blot assay. (B) H1299 cells with stable depletion of RBMS1 or control were grown for 6 days, with cell numbers counted every 2 days. The changes in cell numbers were compared to day 0, and the mean ± SEM from 3 experiments was plotted. (C) Colony formation assays using H1299 cells with stable depletion of RBMS1. Images of the whole plate are shown. Three experiments were carried out, with mean ± SEM of relative colony numbers plotted. (D) The proliferative abilities of stably RBMS1-depleted H1299 cells were measured with an EdU staining assay. Six experiments were conducted, with mean ± SEM of percentage of EdU-positive cells plotted. Scale bar: 100 μm. (E) The protein levels of RBMS1 in H1299 cells with doxycycline-inducible depletion of RBMS1 were examined in the absence or presence of doxycycline by Western blot assay. (FH) Xenograft tumors were generated using nude mice subcutaneously injected with H1299 cells with doxycycline-inducible depletion of RBMS1. Mice were fed water with or without doxycycline. (F) Pictures of the tumors removed after 32 days. (G) Tumors were weighed and plotted. (H) The average sizes of xenograft tumors were measured every 3 days and plotted (n = 7, error bars indicate mean ± SEM). P values were determined by 1-way repeated measures ANOVA (B and H), 1-way ANOVA with Dunnett’s multiple comparison test (C and D), or unpaired t test (G).
Figure 5
Figure 5. Depletion of RBMS1 stimulates ferroptosis through decreased SLC7A11.
(A) Heatmap depicting levels of the most differentially expressed RBPs from quantitative proteomics using A549 cells with depleted or overexpressed RBMS1. (B) Levels of ferroptosis-related genes were examined in RBMS1-depleted or -overexpressing H1299 cells. (C) The relative level of cystine uptake was measured in RBMS1-depleted H1299 cells. (D) Bar graph demonstrating intracellular GSH levels in RBMS1-depleted H1299 cells. (E) Lipid peroxidation was measured by flow cytometry after C11-BODIPY staining in RBMS1-depleted H1299 cells. (F) Representative phase-contrast images of RBMS1-depleted H1299 cells, with or without SLC7A11 reexpression, treated with erastin or erastin and Ferr-1. Scale bar: 100 μm. (G and H) Bar graphs showing viability (G) and death (H) of H1299 cells with RBMS1 knockdown, with or without SLC7A11 reexpression and treated with erastin or erastin and Ferr-1. Data represent mean ± SEM, n = 3 (C and D) or 4 (G and H) independent repeats. P values were determined by 1-way ANOVA with Dunnett’s multiple comparison test (C and D) or 1-way ANOVA with Tukey’s multiple comparison test (G and H).
Figure 6
Figure 6. Depletion of RBMS1 inhibits lung cancer progression partially through decreasing SLC7A11 and promoting ferroptosis.
(A) Lipid peroxidation was measured in RBMS1-depleted H1299 cells, with or without SLC7A11 reexpression, cultured in low-cystine medium. (B and C) Viability (B) and death (C) of RBMS1-depleted H1299 cells, with or without SLC7A11 reexpression, were measured after culturing in low-cystine medium combined with Ferr-1. (DF) Growth (D), colony formation (E), and proliferative abilities (F) of RBMS1-depleted H1299 cells, with or without SLC7A11 reexpression, were measured. Scale bar: 100 μm. (G and H) RBMS1-knockdown H1299 cells, with or without SLC7A11 reexpression, were subcutaneously injected into the flanks of nude mice. (G) Pictures of the removed tumors. (H) Tumors were weighed and plotted. (I) The average sizes of xenograft tumors were measured (n = 7). (J) Immunohistochemical staining of 4HNE in tumor from RBMS1-depleted H1299 cells, with or without SLC7A11 reexpression. Scale bars: 30 μm. Data represent mean ± SEM, n = 3 (D), 4 (B and C), or 6 (F) independent repeats. P values were determined by 1-way ANOVA with Tukey’s multiple comparison test (B, C, E, F, and H) or 1-way repeated measures ANOVA (D and I).
Figure 7
Figure 7. RBMS1 regulates SLC7A11 translation.
(A) The mRNA levels of SLC7A11 in RBMS1-depleted H1299 and A549 cells were examined using qRT-PCR. (B) Schematic of SLC7A11 luciferase reporter plasmids: SLC7A11-fluc-FL (promoter region, 5′-UTR, and 3′-UTR); SLC7A11-fluc-T1 (promoter region and 5′-UTR); SLC7A11-fluc-T2 (promoter region, 5′-UTR, and nt 1–3846 of 3′-UTR); and SLC7A11-fluc-T3 (promoter region, 5′-UTR, and nt 3827–7859 of 3′-UTR). (C) SLC7A11-fluc-FL was transiently transfected into RBMS1-depleted H1299 cells and the mRNA level of SLC7A11-fluc was examined using qRT-PCR. (D) SLC7A11-fluc-T1, SLC7A11-fluc-T2, and SLC7A11-fluc-T3 were transiently transfected into RBMS1-depleted H1299 cells. (E) SLC7A11-fluc-T3 was transiently transfected into RBMS1-depleted H1299 cells with or without reexpression of RBMS1. In CE, the relative luciferase activities were determined by calculating the ratio of firefly luciferase activity over Renilla luciferase activity. Data represent mean ± SEM, n = 3 (A and CE) independent repeats. P values were determined by 1-way ANOVA with Dunnett’s multiple comparison test (A, C, and D) or 1-way ANOVA with Tukey’s multiple comparison test (E).
Figure 8
Figure 8. Ribo-seq analysis of RBMS1-depleted or -overexpressing cells.
Ribo-seq assay was used to analyze RBMS1-depleted (knockdown, KD) and -overexpressing (OE) cells. Clustering heatmap of the differentially expressed genes was assessed with the Euclidean distance measurement in columns and Z normalization in rows.
Figure 9
Figure 9. RBMS1 interacts with eIF3d.
(A) Gene ontology analysis of immunoprecipitation-coupled mass spectrometry (IP-MS) using cells expressing RBMS1. (B) Functional association network of genes from IP-MS were analyzed with the STRING database. (C and D) Immunoprecipitation was performed in H1299 cells expressing Flag-eIF3d, Flag-eIF3i, or Flag-eIF3m (C), or H1299 cells expressing Flag-RBMS1 (D), and the precipitated complexes were analyzed. (E) H1299 cells expressing Flag-eIF3d, Flag-eIF3i, or Flag-eIF3m were immunoprecipitated with or without RNase-A treatment, and the precipitated complexes were analyzed. (F) GST pull-down assays to analyze direct binding of recombinant GST-tagged human RBMS1 and His-tagged eIF3d, eIF3m, or eIF3i. (G) PLA was performed to examine the interaction between RBMS1 and eIF3d. PLA signals are shown in red and nuclei in blue. Scale bar: 20 μm.
Figure 10
Figure 10. RBMS1 interacts with eIF3d to bridge the 3′- and 5′-UTR of SLC7A11 to promote its translation.
(A) SLC7A11-fluc-T2 and SLC7A11-fluc-T3 were transiently transfected into eIF3d-overexpressing H1299 cells. (B) SLC7A11-fluc-T3 was transiently transfected into RBMS1-depleted H1299 cells with or without eIF3d overexpression. For A and B, data represent mean ± SEM (n = 3). P values were calculated from unpaired t test (A) or 1-way ANOVA with Tukey’s multiple comparison test (B). (C) The level of SLC7A11 was examined in eIF3d-depleted H1299 cells. (D) The levels of SLC7A11, RBMS1, and eIF3d were examined in H1299 cells expressing RBMS1, with or without eIF3d depletion. (E) Binding of SLC7A11 5′- and 3′-UTR with RBMS1 was examined by RNA-IP (RIP) in A549 cells expressing FLAG-RBMS1. (F) Binding of SLC7A11 5′- and 3′-UTR with eIF3d was examined by RNA-IP in A549 cells expressing FLAG-eIF3d. (G) Binding of SLC7A11 3′- or 5′-UTR with eIF3d was examined by RNA-IP assay in A549 cells expressing FLAG-eIF3d with or without RBMS1 depletion. (H) Binding of SLC7A11 5′- or 3′-UTR with RBMS1 was examined by RNA-IP assay in A549 cells expressing FLAG-RBMS1 with or without eIF3d depletion. (I) Schematic of the model for how RBMS1 regulates the translation of SLC7A11.
Figure 11
Figure 11. RBMS1 is positively correlated with SLC7A11 in clinical samples and mice.
(A) RBMS1 and SLC7A11 levels of 7 paired lung cancer patient tumors (T) and adjacent tissues (N) were analyzed. (B) Correlation of SLC7A11 with RBMS1 levels was analyzed. (C) Representative images from immunohistochemical staining of SLC7A11 in lung cancers (n = 60) and normal tissues (n = 60). Scale bars: 100 μm (left) and 50 μm (right). (D) The relative immunohistochemical staining levels of SLC7A11 were quantified and classified into 3 grades. (E) Kaplan-Meier curve showing overall survival of lung cancer patients with high and low SLC7A11 expression. (F) Tumors were removed from KrasG12D/WT/Rbms1WT or CKO mice and subjected to immunohistochemical staining with an anti-SLC7A11 antibody. Scale bars: 100 μm (top) and 50 μm (bottom).(G) MEFs obtained from 14-day-old embryos of Rbms1fl/fl CKO mice were infected with AD-Cre to delete RBMS1 and levels of RBMS1 and SLC7A11 were examined. (H) Bar graphs showing cell viability of RBMS1-depleted MEFs treated with erastin, with or without Ferr-1. Data represent mean ± SEM (n = 3). P values were determined using 1-way-ANOVA with Tukey’s multiple comparison test (H).
Figure 12
Figure 12. RBMS1 regulates lung cancer cell radioresistance through SLC7A11.
(A and B) RBMS1 and SLC7A11 levels in irradiation-resistant (IR-resistant) A549 cells with or without irradiation (A) and with or without RBMS1 depletion (B) were measured. (C) Lipid peroxidation was measured by flow cytometry after C11-BODIPY staining in RBMS1-depleted IR-resistant A549 cells with or without irradiation. (D and E) Clonogenic survival was examined in RBMS1-depleted IR-resistant A549 cells treated with different radiation dosages (D), or irradiation with and without Ferr-1 (E). (F) H1299 cells expressing pEGFP-RBMS1 were treated with 1280 compounds and fluorescence intensities were examined. (G) Heatmap depicting the GFP intensity in A549 cells treated with 8 identified compounds. (H) IR-resistant A549 cells were transfected with SLC7A11-fluc-T3 and treated with nortriptyline hydrochloride (NTP). The luciferase activities and RBMS1 levels were examined. (I) RBMS1 and SLC7A11 levels in NTP-treated IR-resistant A549 cells were examined. (J) Bar graphs showing viability of IR-resistant A549 cells treated with NTP or erastin, with or without Ferr-1. (K) Clonogenic survival was examined in NTP-treated IR-resistant A549 cells with different radiation dosages. (L) The schematic of how RBMS1 regulates SLC7A11 translation and ferroptosis in lung cancer. Data represent mean ± SEM (n = 3). P values were determined using 1-way ANOVA with Tukey’s multiple comparison test (E and J), 1-way repeated measures ANOVA (D and K), or unpaired t test (H).

Similar articles

Cited by

References

    1. Dixon SJ, et al. Ferroptosis: an iron-dependent form of nonapoptotic cell death. Cell. 2012;149(5):1060–1072. doi: 10.1016/j.cell.2012.03.042. - DOI - PMC - PubMed
    1. Yang WS, Stockwell BR. Ferroptosis: death by lipid peroxidation. Trends Cell Biol. 2016;26(3):165–176. doi: 10.1016/j.tcb.2015.10.014. - DOI - PMC - PubMed
    1. Xie Y, et al. Ferroptosis: process and function. Cell Death Differ. 2016;23(3):369–379. doi: 10.1038/cdd.2015.158. - DOI - PMC - PubMed
    1. Tang D, et al. Ferroptosis: molecular mechanisms and health implications. Cell Res. 2021;31(2):107–125. doi: 10.1038/s41422-020-00441-1. - DOI - PMC - PubMed
    1. Chen X, et al. Broadening horizons: the role of ferroptosis in cancer. Nat Rev Clin Oncol. 2021;18(5):280–296. doi: 10.1038/s41571-020-00462-0. - DOI - PubMed

Publication types