

Impact of color-coded and warning nutrition labelling schemes: A systematic review and network meta-analysis
- PMID: 34610024
- PMCID: PMC8491916
- DOI: 10.1371/journal.pmed.1003765
Impact of color-coded and warning nutrition labelling schemes: A systematic review and network meta-analysis
Abstract
Background: Suboptimal diets are a leading risk factor for death and disability. Nutrition labelling is a potential method to encourage consumers to improve dietary behaviour. This systematic review and network meta-analysis (NMA) summarises evidence on the impact of colour-coded interpretive labels and warning labels on changing consumers' purchasing behaviour.
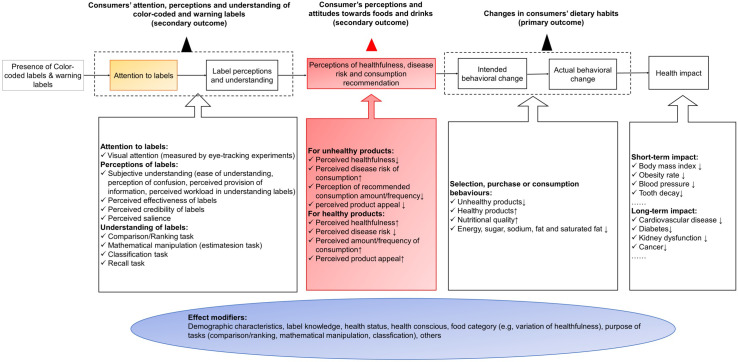
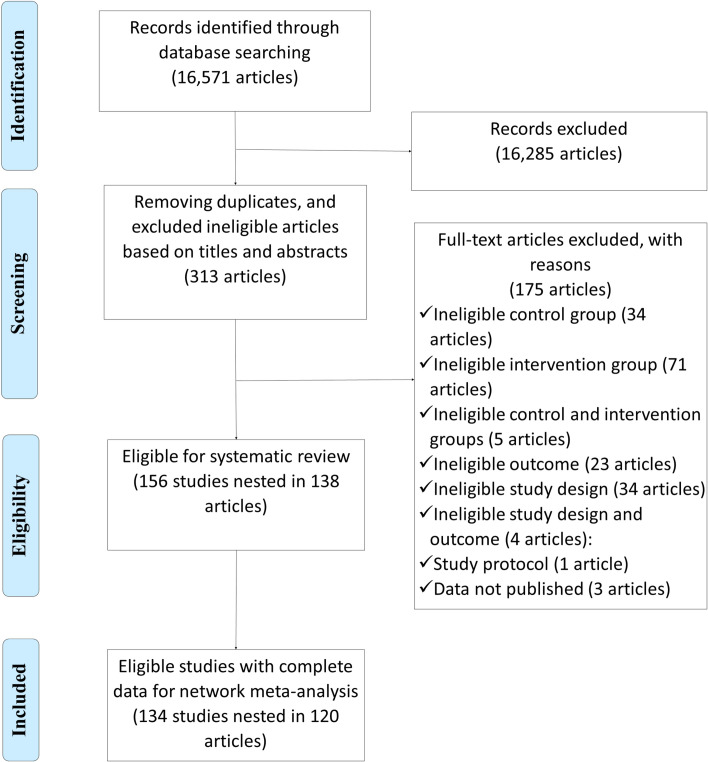
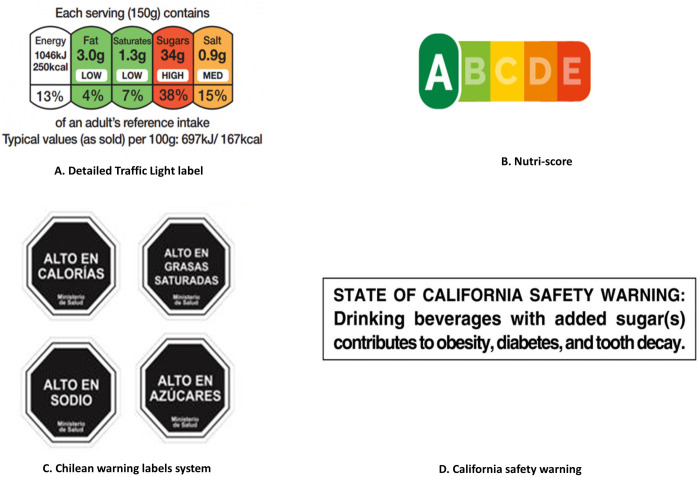
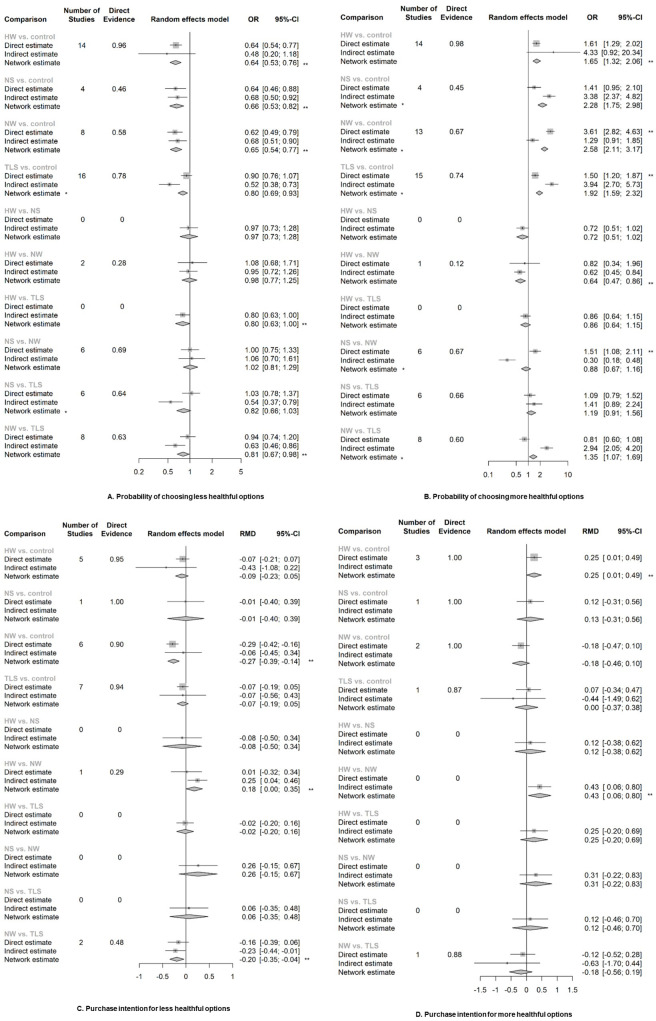
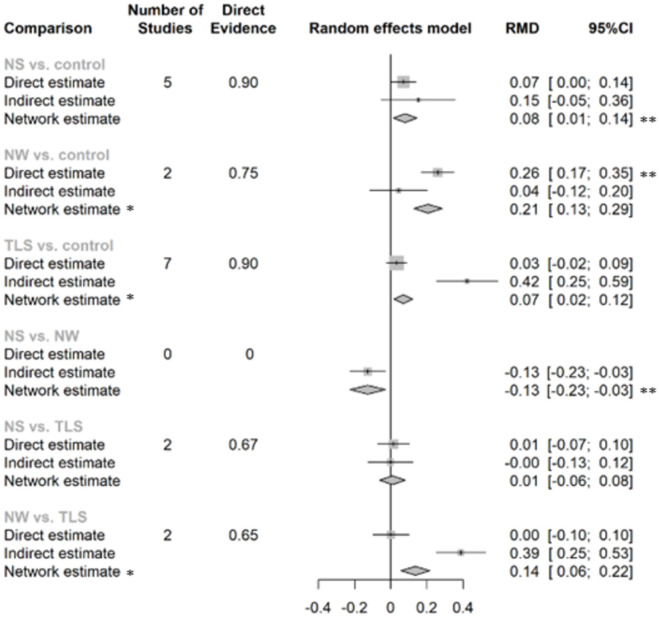
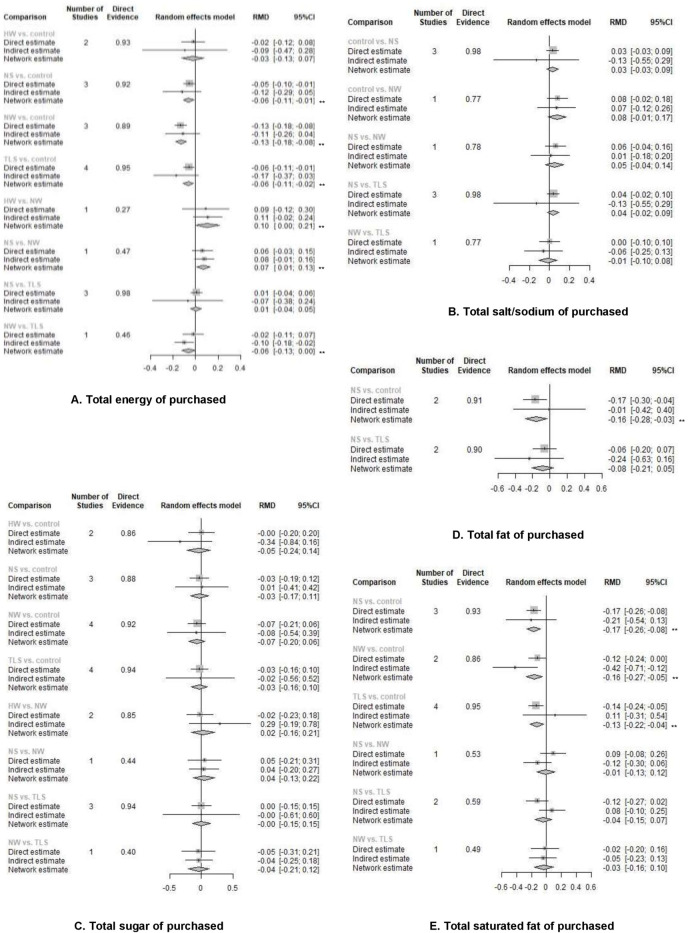
Methods and findings: We conducted a literature review of peer-reviewed articles published between 1 January 1990 and 24 May 2021 in PubMed, Embase via Ovid, Cochrane Central Register of Controlled Trials, and SCOPUS. Randomised controlled trials (RCTs) and quasi-experimental studies were included for the primary outcomes (measures of changes in consumers' purchasing and consuming behaviour). A frequentist NMA method was applied to pool the results. A total of 156 studies (including 101 RCTs and 55 non-RCTs) nested in 138 articles were incorporated into the systematic review, of which 134 studies in 120 articles were eligible for meta-analysis. We found that the traffic light labelling system (TLS), nutrient warning (NW), and health warning (HW) were associated with an increased probability of selecting more healthful products (odds ratios [ORs] and 95% confidence intervals [CIs]: TLS, 1.5 [1.2, 1.87]; NW, 3.61 [2.82, 4.63]; HW, 1.65 [1.32, 2.06]). Nutri-Score (NS) and warning labels appeared effective in reducing consumers' probability of selecting less healthful products (NS, 0.66 [0.53, 0.82]; NW,0.65 [0.54, 0.77]; HW,0.64 [0.53, 0.76]). NS and NW were associated with an increased overall healthfulness (healthfulness ratings of products purchased using models such as FSAm-NPS/HCSP) by 7.9% and 26%, respectively. TLS, NS, and NW were associated with a reduced energy (total energy: TLS, -6.5%; NS, -6%; NW, -12.9%; energy per 100 g/ml: TLS, -3%; NS, -3.5%; NW, -3.8%), sodium (total sodium/salt: TLS, -6.4%; sodium/salt per 100 g/ml: NS: -7.8%), fat (total fat: NS, -15.7%; fat per 100 g/ml: TLS: -2.6%; NS: -3.2%), and total saturated fat (TLS, -12.9%; NS: -17.1%; NW: -16.3%) content of purchases. The impact of TLS, NS, and NW on purchasing behaviour could be explained by improved understanding of the nutrition information, which further elicits negative perception towards unhealthful products or positive attitudes towards healthful foods. Comparisons across label types suggested that colour-coded labels performed better in nudging consumers towards the purchase of more healthful products (NS versus NW: 1.51 [1.08, 2.11]), while warning labels have the advantage in discouraging unhealthful purchasing behaviour (NW versus TLS: 0.81 [0.67, 0.98]; HW versus TLS: 0.8 [0.63, 1]). Study limitations included high heterogeneity and inconsistency in the comparisons across different label types, limited number of real-world studies (95% were laboratory studies), and lack of long-term impact assessments.
Conclusions: Our systematic review provided comprehensive evidence for the impact of colour-coded labels and warnings in nudging consumers' purchasing behaviour towards more healthful products and the underlying psychological mechanism of behavioural change. Each type of label had different attributes, which should be taken into consideration when making front-of-package nutrition labelling (FOPL) policies according to local contexts. Our study supported mandatory front-of-pack labelling policies in directing consumers' choice and encouraging the food industry to reformulate their products.
Protocol registry: PROSPERO (CRD42020161877).
Conflict of interest statement
I have read the journal’s policy and the authors of this manuscript have the following competing interests: JS is funded, and GAM and FJH are partially funded by the National Institute for Health Research (NIHR) (16/136/77) using UK aid from the UK Government to support global health research. The views expressed in this publication are those of the authors and not necessarily those of the NIHR or the UK government. GAM is the chair of Blood Pressure UK, Action on Salt, Sugar and Health and World Action on Salt, Sugar and Health (WASSH). FJH is a member of Action on Salt, Sugar and Health and WASSH. Blood Pressure UK, Action on Salt, Sugar and Health and WASSH are nonprofit charitable organizations. GAM and FJH do not receive any financial support from them. MKB is funded by the Medical Research Council/UK Research and Innovation under the Newton Fund Impact Scheme call (grant MR/V005847/1) and Vital Strategies. JW is the Director of the WHO Collaborating Centre on Population Salt Reduction, is supported by a National Heart Foundation Career Development Fellowship (1082924), and through an NHMRC Centre of Research Excellence on food policy interventions to reduce salt (1117300). KT is supported by an NHMRC Early Career Fellowship (1161597) and a Postdoctoral Fellowship (102140) from the National Heart Foundation of Australia. NRCC reports personal fees from Resolve to Save Lives (RTSL), and the World Bank outside the submitted work; and an unpaid consultant on dietary sodium and hypertension control to numerous governmental and non-governmental organisations.
Figures
References
-
- Roth GA, Abate D, Abate KH, Abay SM, Abbafati C, Abbasi N, et al. Global, regional, and national age-sex-specific mortality for 282 causes of death in 195 countries and territories, 1980–2017: a systematic analysis for the Global Burden of Disease Study 2017. Lancet. 2018;392(10159):1736–88. Epub 2018/11/08. doi: 10.1016/S0140-6736(18)32203-7 . - DOI - PMC - PubMed
-
- Guideline: Sugars intake for adults and children. Geneva, Switzerland: World Health Organization; 2015. - PubMed
-
- Factsheet: Overweight and Obesity. World Health Organization; 2020.
Publication types
MeSH terms
Grants and funding
LinkOut - more resources
Full Text Sources
Medical
Miscellaneous
