. 2021 Dec:192:112965.
doi: 10.1016/j.phytochem.2021.112965. Epub 2021 Oct 2.

Acropetal and basipetal cardenolide transport in Erysimum cheiranthoides (wormseed wallflower)

Affiliations

Acropetal and basipetal cardenolide transport in Erysimum cheiranthoides (wormseed wallflower)

Martin L Alani et al. Phytochemistry. 2021 Dec.

Abstract

Plant specialized metabolites are often subject to within-plant transport and have tissue-specific distribution patterns. Among plants in the Brassicaceae, the genus Erysimum is unique in producing not only glucosinolates but also cardenolides. Ten cardenolides were detected with varying abundance in different tissues of Erysimum cheiranthoides L (Brassicaceae; wormseed wallflower). As is predicted by the optimal defense theory, cardenolides were most abundant in young leaves and reproductive tissues. The lowest concentrations were observed in senescing leaves and roots. Crosses between wildtype E. cheiranthoides and a mutant line with an altered cardenolide profile showed that the seed cardenolide phenotype is determined entirely by the maternal genotype. Prior to the development of the first true leaves, seedling cotyledons also had the maternal cardenolide profile. Hypocotyl grafting experiments showed that the root cardenolide profile is determined entirely by the aboveground plant genotype. In further grafting experiments, there was no evidence of cardenolide transport into the leaves, but a mixed cardenolide profile was observed in the stems and inflorescences of plants that had been grafted at vegetative and flowering growth stages, respectively. Together, these results indicate that E. cheiranthoides leaves are a site of cardenolide biosynthesis.

Keywords: Brassicaceae; Cardenolide; Cardiac glycoside; Crosses; Erysimum cheiranthoides; Grafting; Transport; Wormseed wallflower.


Conflict of interest statement

Declaration of interests

The authors declare that they have no known competing financial interests or personal relationships that could have appeared to influence the work reported in this paper.

Figures

Figure 1.
Figure 1.
As described by Züst et al (2020), abundant cardenolides in E. cheiranthoides have digitoxigenin, cannogenol, cannogenin, or strophanthidin as the steroid core. Sugar side chains added to these steroid cores provide additional structural variation. The side chains of Dig-10, Dig-19, Dig-20, and Can-32 have not been fully characterized but are predicted based on MS fragmentation.
Figure 2.
Figure 2.
Principal component analysis (PCA) biplot of genin abundance as a percentage of total cardenolide abundance. Variable loadings for the first two principal components are displayed as vectors.
Figure 3.
Figure 3.
Maternal genotype determines seed cardenolide phenotype. Seed cardenolide content was measured in seeds from naturally self-pollinated and manually crossed plants. Different letters indicate P < 0.05 differences for each cardenolide, ANOVA followed by Tukey’s HSD test. Bars are mean +/− s.d. of N = 4-5. wt = wildtype E. cheiranthoides var. Elbtalaue, 454 = 454 cardenolide mutant line. Peak areas were normalized to an ouabain internal standard.
Figure 4.
Figure 4.
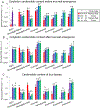
Cotyledons retain maternal plant cardenolide phenotype until true leaf emergence. (A) Cardenolide content of cotyledons before true leaf emergence, (B) cardenolide content of cotyledons after true leaf emergence, (C) cardenolide content of true leaves. Different letters indicate P < 0.05 differences for each cardenolide, ANOVA followed by Tukey’s HSD test. Bars are mean +/− s.d. of N = 6-10. wt = wildtype E. cheiranthoides var. Elbtalaue, 454 = 454 cardenolide mutant line. Peak areas were normalized to an ouabain internal standard.
Figure 5.
Figure 5.
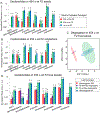
Cotyledons retain maternal plant cardenolide phenotype until true leaf emergence. Cardenolides were measured in F2 progeny of wt x 454 F1 plants. (A) Cardenolide content of single F2 seeds, (B) cardenolide content of F2 cotyledons from individual plants before true leaf emergence, (C) principal component analysis of cardenolide content of true leaves of F2 plants, and (D) cardenolide content of F2 true leaves. Different letters indicate P < 0.05 differences for each cardenolide, ANOVA followed by Tukey’s HSD test. Bars are mean +/− s.d. of N = 4-6 homozygotes and 20-24 F2s. wt = wildtype E. cheiranthoides var. Elbtalaue, 454 = 454 cardenolide mutant line. Ellipses in the PCA plot represent 95% confidence intervals. Peak areas were normalized to an ouabain internal standard.
Figure 6.
Figure 6.
Grafting experiments show that shoot genotype determines root cardenolide phenotype. Seedlings were grafted at the cotyledon stage and cardenolides were measured in leaves and roots after three weeks. (A) Scion (leaf) cardenolides in grafted plants. (B) Stock (root) cardenolides in grafted plants. Different letters indicate P < 0.05 differences for each cardenolide, ANOVA followed by Tukey’s HSD test. Bars are mean +/− s.d. of N = 5-13 for shoot samples and 4-10 for root samples, wt = wildtype E. cheiranthoides var Elbtalaue; 454 = 454 cardenolide mutant line. Peak areas were normalized to an ouabain internal standard.
Figure 7.
Figure 7.
Cardenolides transport in aboveground tissue. The stalks of three to four-week-old wildtype and 454 cardenolide mutant plants were grafted. Two weeks later, cardenolides were measured in (A) leaves above the graft junction, (B) leaves below the graft junction, (C) stems immediately above the graft junction, and (D) stems immediately below the graft junction. The principal component analysis (PCA) is of eight detected cardenolides. Bar graphs of the data are in Supplemental Figure S3. Ellipses signify 95% confidence intervals.
Figure 8.
Figure 8.
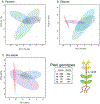
Intermediate cardenolide profiles in inflorescence-grafted plants. Plants were grafted at the inflorescence stage, with the graft junction above the leaves of the stock and below the developing inflorescence of the scion. Cardenolide content was measured in (A) flowers, (B) green siliques, and (C) dry seeds of the grafted plants. The principal component analysis (PCA) is of eight detected cardenolides. Ellipses signify 95% confidence intervals. Bar graphs of the data are in Supplemental Figure S4.

References

    1. Agrawal AA, Petschenka G, Bingham RA, Weber MG, Rasmann S, 2012. Toxic cardenolides: chemical ecology and coevolution of specialized plant-herbivore interactions. New Phytol 194, 28–45. 10.1111/j.1469-8137.2011.04049.x - DOI - PubMed
    1. Alfermann AW, Boy HM, Döller PC, Hagedorn W, Heins M, Wahl J, Reinhard E, 1977. Biotransformation of Cardiac Glycosides by Plant Cell Cultures, in: Barz W, Reinhard E, Zenk MH (Eds.), Plant Tissue Culture and Its Bio-Technological Application, Proceedings in Life Sciences. Springer, Berlin, Heidelberg, pp. 125–141. 10.1007/978-3-642-66646-9_11 - DOI
    1. Andersen TG, Nour-Eldin HH, Fuller VL, Olsen CE, Burow M, Halkier BA, 2013. Integration of biosynthesis and long-distance transport establish organ-specific glucosinolate profiles in vegetative Arabidopsis. The Plant Cell 25, 3133–3145. 10.1105/tpc.113.110890 - DOI - PMC - PubMed
    1. Baldwin IT, 1989. Mechanism of damage-induced alkaloid production in wild tobacco. J Chem Ecol 15, 1661–1680. 10.1007/BF01012392 - DOI - PubMed
    1. Benton HP, Want EJ, Ebbels TMD, 2010. Correction of mass calibration gaps in liquid chromatography-mass spectrometry metabolomics data. Bioinformatics 26, 2488–2489. 10.1093/bioinformatics/btq441 - DOI - PubMed