. 2021 Dec 1;81(23):5818-5832.
doi: 10.1158/0008-5472.CAN-21-1033. Epub 2021 Oct 5.

Genomic and Transcriptomic Analysis of Relapsed and Refractory Childhood Solid Tumors Reveals a Diverse Molecular Landscape and Mechanisms of Immune Evasion

Affiliations

Genomic and Transcriptomic Analysis of Relapsed and Refractory Childhood Solid Tumors Reveals a Diverse Molecular Landscape and Mechanisms of Immune Evasion

Sara A Byron et al. Cancer Res. .

Abstract

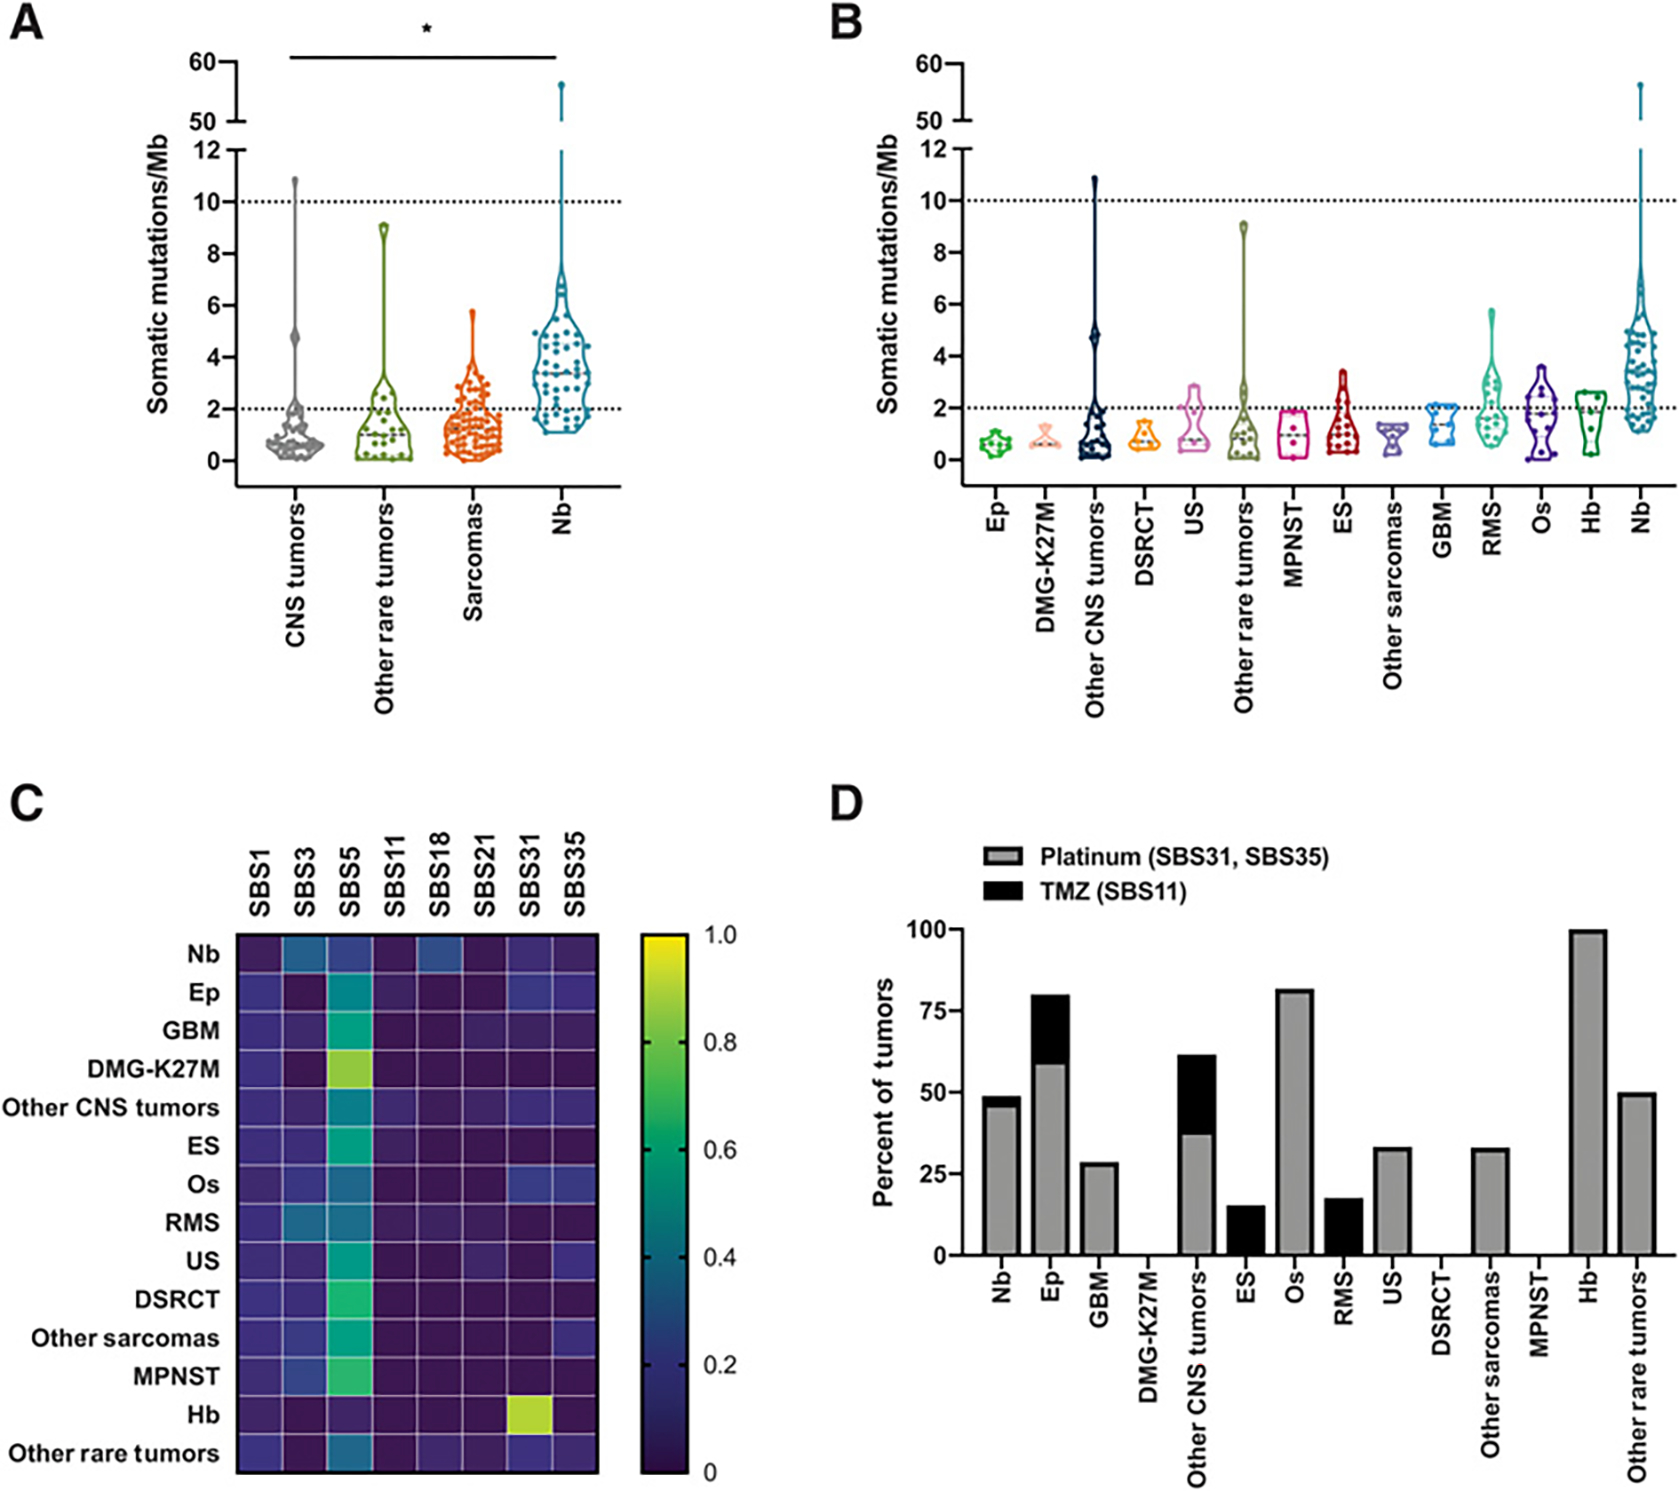
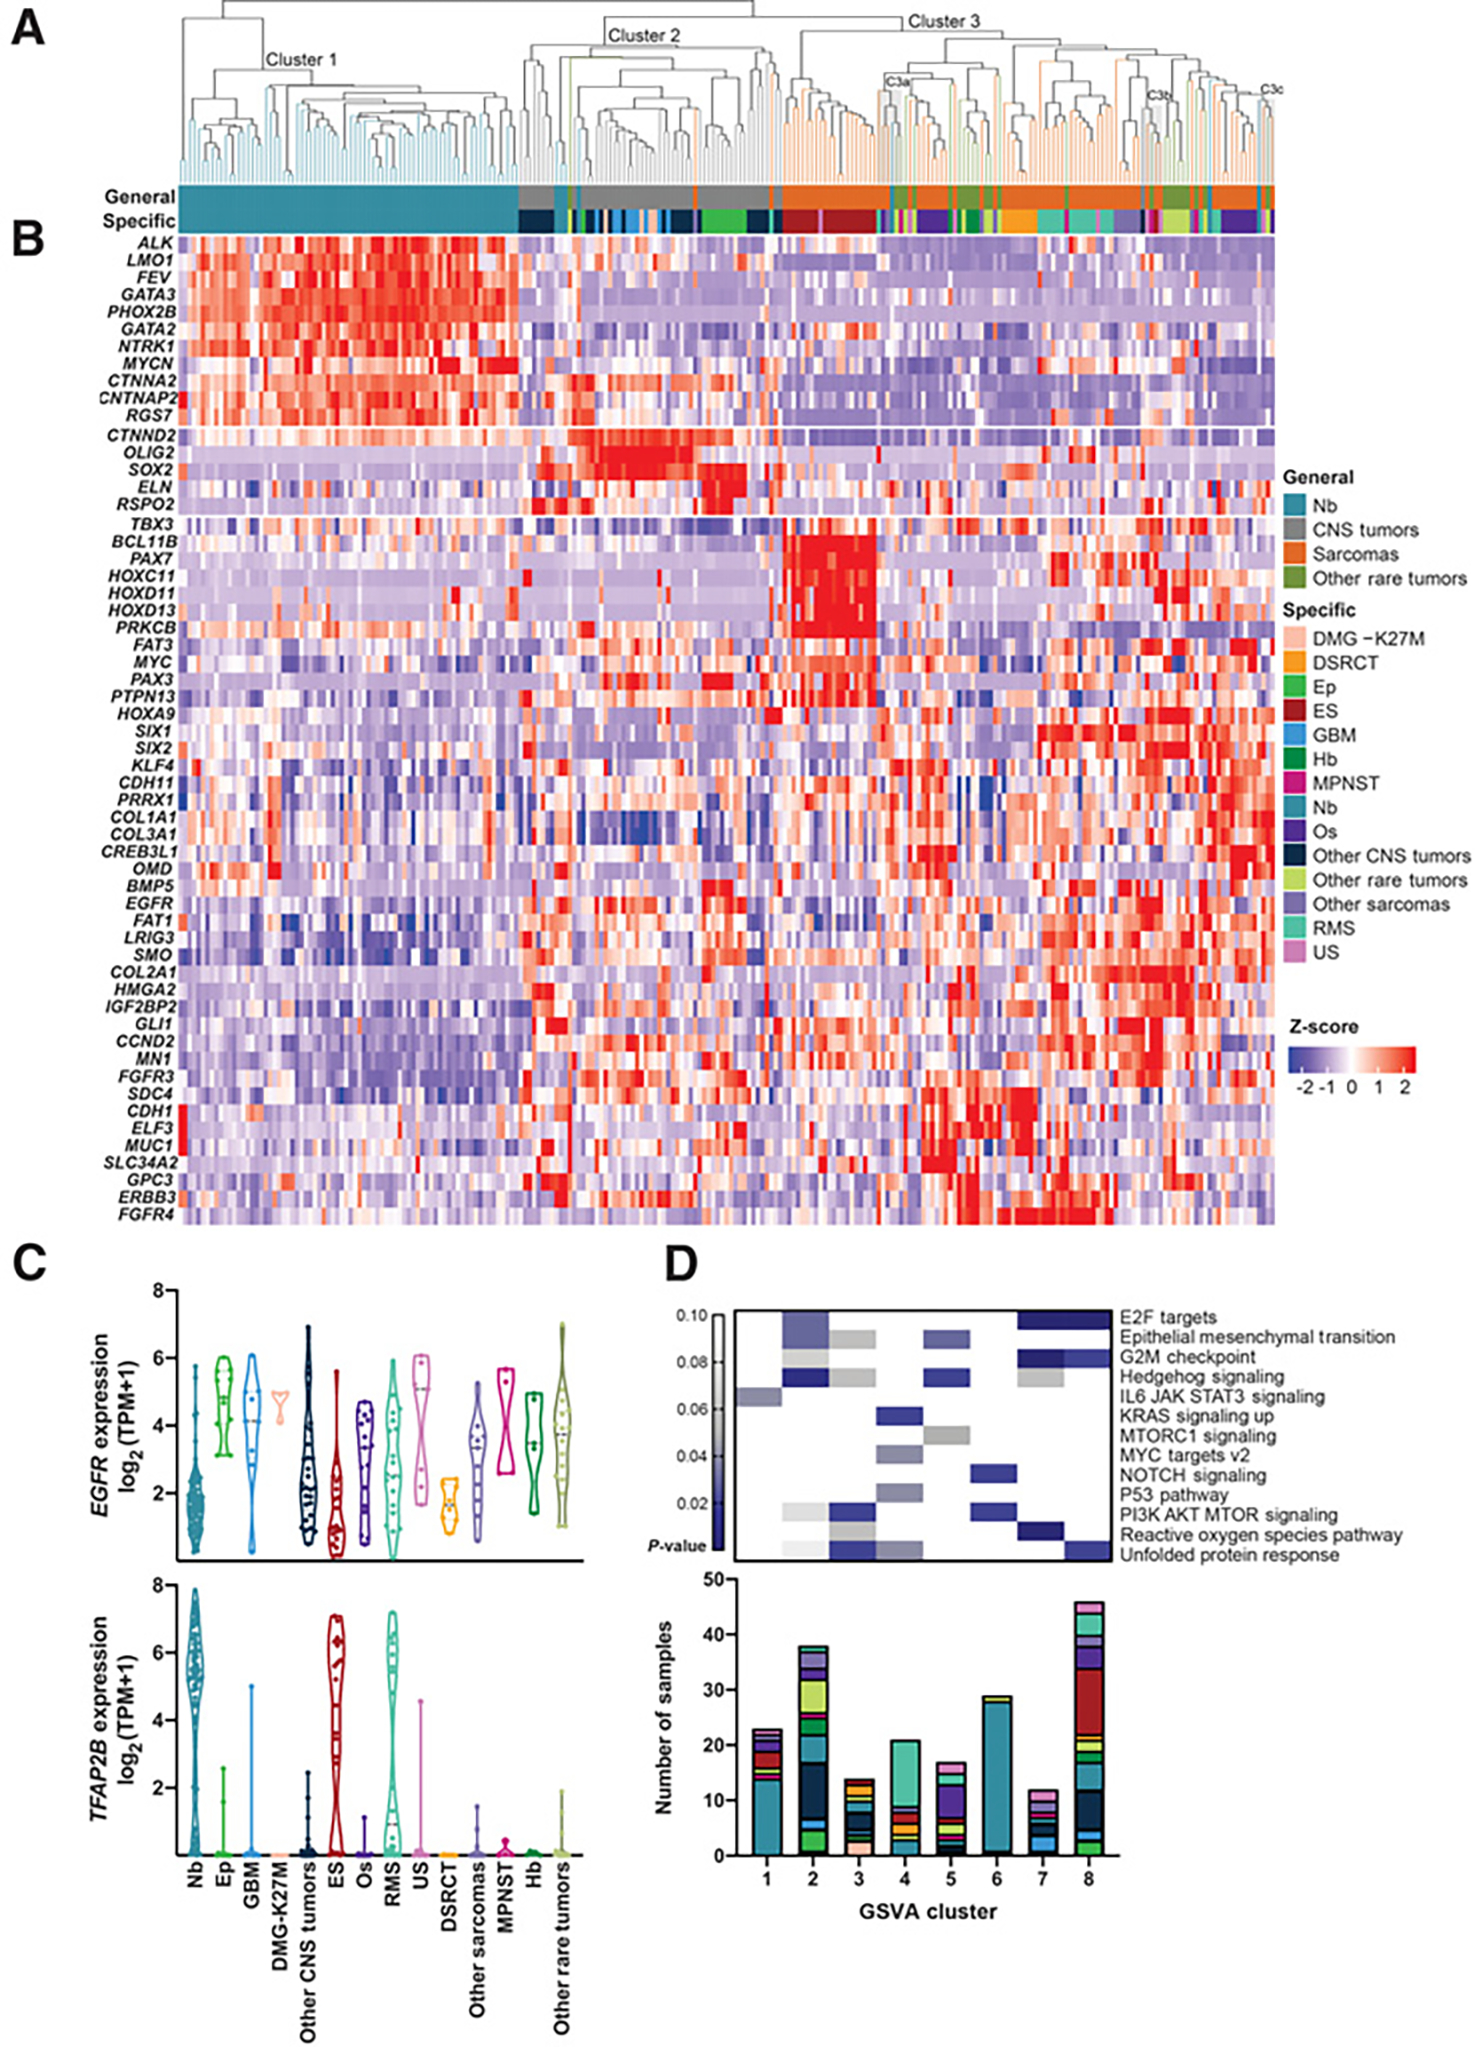
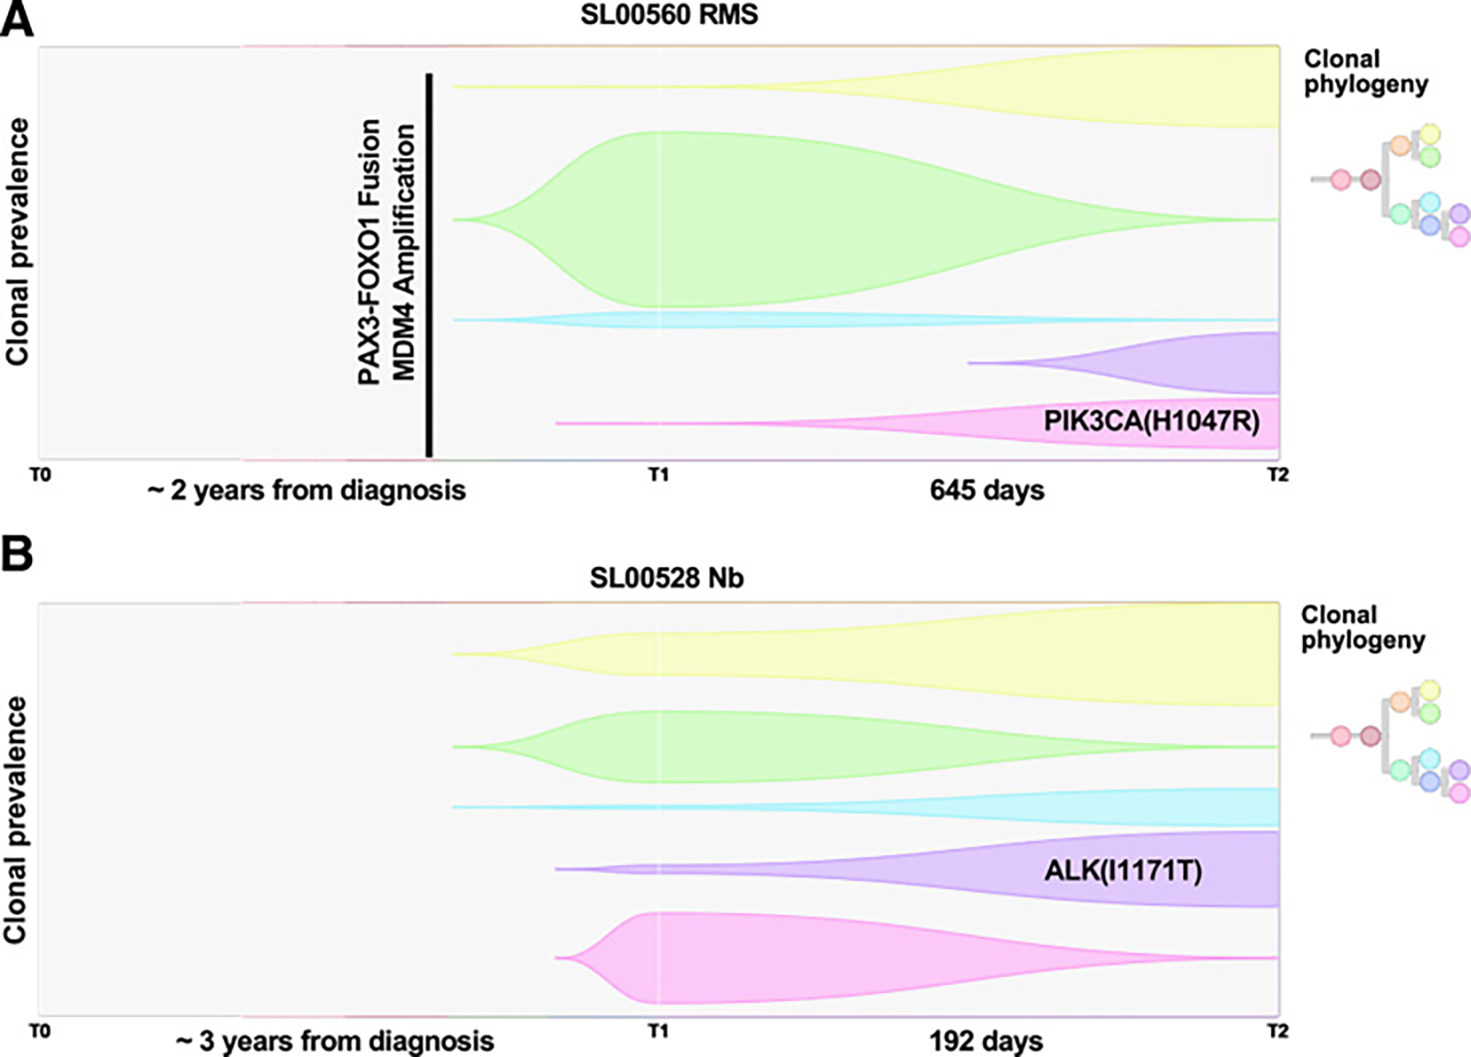
Children with treatment-refractory or relapsed (R/R) tumors face poor prognoses. As the genomic underpinnings driving R/R disease are not well defined, we describe here the genomic and transcriptomic landscapes of R/R solid tumors from 202 patients enrolled in Beat Childhood Cancer Consortium clinical trials. Tumor mutational burden (TMB) was elevated relative to untreated tumors at diagnosis, with one-third of tumors classified as having a pediatric high TMB. Prior chemotherapy exposure influenced the mutational landscape of these R/R tumors, with more than 40% of tumors demonstrating mutational signatures associated with platinum or temozolomide chemotherapy and two tumors showing treatment-associated hypermutation. Immunogenomic profiling found a heterogenous pattern of neoantigen and MHC class I expression and a general absence of immune infiltration. Transcriptional analysis and functional gene set enrichment analysis identified cross-pathology clusters associated with development, immune signaling, and cellular signaling pathways. While the landscapes of these R/R tumors reflected those of their corresponding untreated tumors at diagnosis, important exceptions were observed, suggestive of tumor evolution, treatment resistance mechanisms, and mutagenic etiologies of treatment. SIGNIFICANCE: Tumor heterogeneity, chemotherapy exposure, and tumor evolution contribute to the molecular profiles and increased mutational burden that occur in treatment-refractory and relapsed childhood solid tumors.


Figures

Figure 1.
Figure 1.
Somatic mutation burden and mutation signatures in relapsed and refractory childhood solid tumors. Somatic mutation burden and mutation signatures for patients with matched tumor and normal WES. The last biopsy is shown for patients with multiple biopsies. A, TMB for general tumor type categories for 184 patients with matched tumor and normal WES. Dashed lines indicate the thresholds for pediatric high TMB (2 or more mutations/Mb) and pediatric hypermutant (10 or more mutations/Mb) tumors. B, TMB for specific tumor type categories for each of 184 patients. Tumor types with at least 4 patients are shown, and tumor types with fewer than 4 distinct patients are grouped into “Other CNS Tumors,” “Other Sarcomas,” and “Other Rare Tumors.” Tumor types are presented in ascending median TMB order. Ep, ependymoma; DMG-K27M, H3K27M-mutant diffuse midline gliomas; DSRCT, desmoplastic small round cell tumor; US, undifferentiated sarcoma; MPNST, malignant peripheral nerve sheath tumor; ES, Ewing sarcoma; GBM, glioblastoma; RMS, rhabdomyosarcoma; Os, osteosarcoma; Hb, hepatoblastoma; Nb, neuroblastoma. Dashed lines indicate the thresholds for pediatric high TMB (2 or more mutations/Mb) and pediatric hypermutant (10 or more mutations/Mb) tumors. C, Mutation signatures reflective of the trinucleotide context of somatic SNVs in the 146 cases with more than 50 somatic SNVs. The proportion of mutations mapping to the indicated COSMIC mutational signatures, averaged within each tumor type, is displayed. D, The frequency of tumors with treatment-associated mutational signatures (SBS11, SBS31, SBS35) is displayed.
Figure 2.
Figure 2.
Genomic landscape of relapsed and refractory childhood solid tumors. The genomic landscape of likely pathogenic driver mutations in 184 patients with BCC with tumor and matched normal WES. A, Somatic coding mutation burden is shown as a per-patient bar graph. Chromosome arm-level gains or losses, present in atleast 15 patients within the cohort, are displayed. Cancer genes bearing likely pathogenic germline SNVs and somatic SNVs, CNVs, SVs, and fusions are ordered according to general tumor type and frequency. Hotspot activating mutations include ACVR1 (R206H), ALK (F1174L, I1171T, R1275Q), BRAF (V600E), CTNNB1 (D32V), EGFR (exon 20 insertion mutation—A767_V769dup, tandem kinase domain duplication), FBXW7 (R465H), FGFR4 (V550L/E), H3F3A (K27M), HRAS/KRAS/NRAS (G12D, G13C/R, Q61K, A146T), MYCN (P44L), PDGFRA (V561D), PIK3CA (E542K, E545K, H1047R), PIK3R1 (N564D), PPM1D (exon 6 truncating mutation, S421*, E423fs, E525*), and PTPN11 (A72D, G503V, T507K). B, Frequency of gene alterations according to general tumor type. C, Venn diagram indicating intersection of cancer gene mutations across general tumor types.
Figure 3.
Figure 3.
Immunogenomic landscape of relapsed and refractory childhood solid tumors. A–D, Neoantigen burden and MHC class I expression for patients with tumor-normal WES and tumor mRNA sequencing. The last biopsy is shown for patients with multiple biopsies. Violin plots display the number of expressed, predicted strong-binding neoantigens (A), and HLA-A, HLA-B, and HLA-C expression (B–D) by tumor type. The median value for the entire cohort is indicated by a dotted line. Median values for individual tumor types are shown as a line within the violin plot, and individual values displayed as closed circles. Tumor types with at least 4 patients are shown, with tumor types with less than 4 patients grouped into “Other CNS Tumors,” “Other Sarcomas,” and “Other Rare Tumors.” E, Immune infiltration scores calculated from XCell based on bulk RNA-sequencing data.
Figure 4.
Figure 4.
Gene expression patterns in relapsed and refractory childhood solid tumors. A, Unsupervised hierarchical clustering using 2,199 genes. Three main clusters were formed (Cluster 1, Cluster 2, Cluster 3). Three mixed-pathology subclusters within Cluster 3 with P values < 0.05 (C3a, C3b, and C3c) are shaded in gray. B, Heatmap of genes that are significantly differentially expressed in one group versus two others. COSMIC genes are represented here. C, EGFR and TFAP2B as selected examples of genes with cross-pathology expression patterns. D, P values for enrichment of cancer hallmark gene sets within the consensus clustered tumor groups (GSVA clusters 1–8; top). Hallmarks with significant enrichment within at least one group are shown. Tumor types associated with each GSVA cluster (bottom). Colors correspond to the specific tumor types as displayed in the legend for A.
Figure 5.
Figure 5.
Longitudinal analysis of relapsed and refractory childhood solid tumors. Fish plot and predicted clonal phylogeny for two R/R tumors with longitudinal samples. RMS (A) and neuroblastoma (Nb; B).

References

    1. Siegel RL, Miller KD, Jemal A. Cancer statistics, 2020. CA Cancer J Clin 2020;70:7–30. - PubMed
    1. Grobner SN, Worst BC, Weischenfeldt J, Buchhalter I, Kleinheinz K, Rudneva VA, et al. The landscape of genomic alterations across childhood cancers. Nature 2018;555:321–7. - PubMed
    1. Ma X, Liu Y, Liu Y, Alexandrov LB, Edmonson MN, Gawad C, et al. Pan-cancer genome and transcriptome analyses of 1,699 paediatric leukaemias and solid tumours. Nature 2018;555:371–6. - PMC - PubMed
    1. Chang W, Brohl AS, Patidar R, Sindiri S, Shern JF, Wei JS, et al. MultiDimensional ClinOmics for precision therapy of children and adolescent young adults with relapsed and refractory cancer: a report from the center for cancer research. Clin Cancer Res 2016;22:3810–20. - PMC - PubMed
    1. Wong M, Mayoh C, Lau LMS, Khuong-Quang DA, Pinese M, Kumar A, et al. Whole genome, transcriptome and methylome profiling enhances actionable target discovery in high-risk pediatric cancer. Nat Med 2020;26:1742–53. - PubMed

Publication types

MeSH terms

Substances