. 2021 Oct 5;12(10):905.
doi: 10.1038/s41419-021-04165-x.

Targeting the miRNA-155/TNFSF10 network restrains inflammatory response in the retina in a mouse model of Alzheimer's disease

Affiliations

Targeting the miRNA-155/TNFSF10 network restrains inflammatory response in the retina in a mouse model of Alzheimer's disease

Chiara Burgaletto et al. Cell Death Dis. .

Abstract

Age-related disorders, such as Alzheimer's disease (AD) and age-related macular degeneration (AMD) share common features such as amyloid-β (Aβ) protein accumulation. Retinal deposition of Aβ aggregates in AMD patients has suggested a potential link between AMD and AD. In the present study, we analyzed the expression pattern of a focused set of miRNAs, previously found to be involved in both AD and AMD, in the retina of a triple transgenic mouse model of AD (3xTg-AD) at different time-points. Several miRNAs were differentially expressed in the retina of 3xTg-AD mice, compared to the retina of age-matched wild-type (WT) mice. In particular, bioinformatic analysis revealed that miR-155 had a central role in miRNA-gene network stability, regulating several pathways, including apoptotic and inflammatory signaling pathways modulated by TNF-related apoptosis-inducing ligand (TNFSF10). We showed that chronic treatment of 3xTg-AD mice with an anti-TNFSF10 monoclonal antibody was able to inhibit the retinal expression of miR-155, which inversely correlated with the expression of its molecular target SOCS-1. Moreover, the fine-tuned mechanism related to TNFSF10 immunoneutralization was tightly linked to modulation of TNFSF10 itself and its death receptor TNFRSF10B, along with cytokine production by microglia, reactive gliosis, and specific AD-related neuropathological hallmarks (i.e., Aβ deposition and Tau phosphorylation) in the retina of 3xTg-AD mice. In conclusion, immunoneutralization of TNFSF10 significantly preserved the retinal tissue in 3xTg-AD mice, suggesting its potential therapeutic application in retinal degenerative disorders.


Conflict of interest statement

The authors declare no competing interests.

Figures
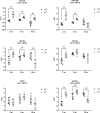
Fig. 1
Fig. 1. Differential expression analysis of miRNAs in the retina of 3xTg-AD mice.
RT-qPCR was performed to determine the expression of miR-155, miR-126a, miR-23a, miR-34a, miR-9, miR-27a in the retinas from 3xTg-AD mice at three different (3-, 9-, and 15-month-old) age periods. Data are expressed as mean ± standard deviation. One-way ANOVA and Tukey’s multiple comparisons test were used to determine statistical significance. *p < 0.05 vs. WT age-matched mice. N = 6 animals; 6 independent retinal samples, 2 pooled retinas per sample in each group.
Fig. 2
Fig. 2. The miRNA-gene network predicted by miRNet analysis.
The predicted network (Prefuse force directed layout based on edge betweenness) included about 20000 edges (connections) and 10000 nodes (miRNAs or genes). Only three nodes showed the highest degree (included table) and particularly the highest betweenness centrality (red color). From left to right, the red nodes represent miR-155, miR-34a, and miR-27a, bearing also the highest degree values. These mentioned node parameters strictly influence the stability of the network. Centrality metric analyses were carried out with Cytoscape and network parameters were plotted in the graphic representation: closeness centrality (proportional to node dimension), betweenness centrality (temperature color scale, blue < red), edge betweenness (proportional to edge thickness).
Fig. 3
Fig. 3. Anti-TNFSF10 treatment decreased miR-155 retinal levels in 15-month-old 3xTg-AD mice.
A RT-qPCR was performed to determine the retinal expression of miR-155-5p in 15-month-old 3xTg-AD mice treated with anti-TNFSF10. One-way ANOVA and post-hoc Tukey’s multiple comparisons test were used. N = 5 animals; 5 independent retinal samples, 2 pooled retinas per sample in each group. B Bioinformatic prediction of SOCS-1 mRNA binding with miR-155-5p. C Western blot analysis was performed to evaluate the expression of the miR-155-5p molecular target SOCS-1 in the retinas of 3xTg-AD mice. D Densitometric analysis of western blots. Data are expressed as mean ± standard deviation. One-way ANOVA and post-hoc Tukey’s multiple comparisons test were used to determine statistical significance. *p < 0.05. N = 5 animals; 5 independent retinal samples, 2 pooled retinas per sample in each group.
Fig. 4
Fig. 4. TNFSF10-neutralizing antibody treatment preserved retinal structure in 15-month-old 3xTg-AD mice.
Hematoxylin and eosin staining of retinal tissue of WT and 3xTg-AD mice were performed to analyze retina morphological changes following chronic treatment with vehicle or TNFSF10-neutralizing antibody. Original magnification, x200. Scale bar = 200 µm. N = 5 animals; 5 independent retinal samples per group. NFL nerve fiber layer, GCL ganglion cell layer, IPL inner plexiform layer, INL inner nuclear layer, OPL outer plexiform layer, ONL outer nuclear layer, IS inner segment; OS outer segment, RPE retinal pigment epithelial.
Fig. 5
Fig. 5. Anti-TNFSF10 treatment modulated retinal expression of TNFSF10 and its TNFRSF10B receptor in 3xTg-AD mice.
A Immunoblots of retinal lysates for the expression of TNFRSF10B and TNFSF10 proteins. B Densitometric analysis of western blots. Data are expressed as mean ± standard deviation. One-way ANOVA and post-hoc Tukey’s multiple comparisons test were used for statistical analysis. *p < 0.05. N = 5 animals; 5 independent retinal samples, 2 pooled retinas per sample in each group. C Immunohistochemical staining for TNFSF10 and its receptor TNFRSF10B in the retina of WT and 3xTg-AD mice, treated either with vehicle or anti-TNFSF10 antibody. Original magnification, x63. Scale bar = 10 µm. D Densitometric analysis of the TNFRSF10B and TNFSF10 immunofluorescence signal in the RPE and OPL retinal layers. Data are expressed as mean ± standard deviation. One-way ANOVA and post-hoc Tukey’s multiple comparisons test were used for statistical analysis. *p < 0.05. N = 5 animals; 5 independent retinal samples per group. For each retinal section, 14 optical fields were analyzed.
Fig. 6
Fig. 6. Anti-TNFSF10 treatment inhibited pro-inflammatory microglia activation in the outer-plexiform and in the RPE layers of 3xTg-AD mouse retina.
A Western blots for TNF-α, Ιba-1 and IL-10 protein expression in the retinas of 3xTg-AD mice, following chronic treatment with an anti-TNFSF10 monoclonal antibody or vehicle. B Densitometric analysis of western blots. Data are expressed as mean ± standard deviation. One-way ANOVA and post-hoc Tukey’s multiple comparisons test were used for statistical analysis. *p < 0.05. N = 5 animals; 5 independent retinal samples, 2 pooled retinas per sample in each group. C Immunohistochemical staining for TNF-α, Iba-1 in the retina of 3xTg-AD mice, treated with either vehicle or anti-TNFSF10 antibody. Original magnification, x63. Scale bar = 10 µm. D Immunohistochemical staining for Iba-1, IL-10 in the retina of WT and 3xTg-AD mice, treated with either vehicle or anti-TNFSF10 antibody. Original magnification, x63. Scale bar = 10 µm. E Densitometric analysis of the Iba-1, and TNF-α immunofluorescence signal in the RPE and OPL retinal layers. F Densitometric analysis of the Iba-1, and IL-10 immunofluorescence in the RPE and OPL retinal layers. Data are expressed as mean ± standard deviation. One-way ANOVA and post-hoc Tukey’s multiple comparisons test were used for statistical analysis. *p < 0.05. N = 5 animals; 5 independent retinal samples per group. For each retinal section, 14 optical fields were analyzed.
Fig. 7
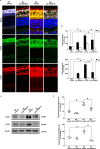
Fig. 7. Anti-TNFSF10 treatment inhibited astrogliosis in the outer-plexiform and in the RPE layers of the 3xTg-AD mouse retina.
A Immunohistochemical staining for GFAP, COX2 in the retina of WT and 3xTg-AD mice treated with anti-TNFSF10 or vehicle. Original magnification, x63. Scale bar = 10 µm. B Densitometric analysis of the GFAP and COX2 immunofluorescence signal in the RPE and OPL retinal layers. One-way ANOVA and post-hoc Tukey’s multiple comparisons test were used for statistical analysis. * p < 0.05. N = 5 animals; 5 independent retinal samples per group. For each retinal section, 14 optical fields were analyzed. C Western blot images for GFAP, COX-2 protein expression in the retina of mice following chronic treatment with an anti-TNFSF10 monoclonal antibody or vehicle. D Densitometric analysis of western blots. Data are expressed as mean ± standard deviation. One-way ANOVA and post-hoc Tukey’s multiple comparisons test were used to determine statistical significance. *p < 0.05. N = 5 animals; 5 independent retinal samples, 2 pooled retinas per sample in each group.
Fig. 8
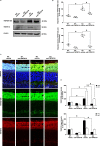
Fig. 8. Anti-TNFSF10 treatment inhibited Aβ and p-TAU deposition in the outer-plexiform and in the RPE layers of the 3xTg-AD mouse retina.
A Immunohistochemical staining for p-TAU in the retina of WT and 3xTg-AD mice treated with anti-TNFSF10 or vehicle. Original magnification, x63. Scale bar = 10 µm. B Densitometric analysis of the p-TAU immunofluorescence signal in the RPE and OPL retinal layers. One-way ANOVA and post-hoc Tukey’s multiple comparisons test were used for statistical analysis. *p < 0.05. N = 5 animals; 5 independent retinal samples. For each retinal section, 14 optical fields were analyzed. C Western blot representative images for p-TAU protein expression in the retina of mice following chronic treatment with an anti-TNFSF10 monoclonal antibody or vehicle. D Densitometric analysis of western blots. Data are expressed as mean ± standard deviation. One-way ANOVA and post-hoc Tukey’s multiple comparisons test were used for statistical analysis. *p < 0.05. N = 5 animals; 5 independent retinal samples, 2 pooled retinas per sample in each group.

References

    1. Hart NJ, Koronyo Y, Black KL, Koronyo-Hamaoui M. Ocular indicators of Alzheimer’s: exploring disease in the retina. Acta Neuropathol (Berl) 2016;132:767–87. doi: 10.1007/s00401-016-1613-6. - DOI - PMC - PubMed
    1. King A, Bodi I, Troakes C. The neuropathological diagnosis of Alzheimer’s disease-the challenges of pathological mimics and concomitant pathology. Brain Sci. 2020;10:479. doi: 10.3390/brainsci10080479. - DOI - PMC - PubMed
    1. Czakó C, Kovács T, Ungvari Z, Csiszar A, Yabluchanskiy A, Conley S, et al. Retinal biomarkers for Alzheimer’s disease and vascular cognitive impairment and dementia (VCID): implication for early diagnosis and prognosis. GeroScience. 2020;42:1499–525. doi: 10.1007/s11357-020-00252-7. - DOI - PMC - PubMed
    1. Mei X, Yang M, Zhu L, Zhou Q, Li X, Chen Z, et al. Retinal levels of amyloid beta correlate with cerebral levels of amyloid beta in young APPswe/PS1dE9 transgenic mice before onset of Alzheimer’s disease. Behav Neurol. 2020;2020:1574816. doi: 10.1155/2020/1574816. - DOI - PMC - PubMed
    1. Koronyo Y, Biggs D, Barron E, Boyer DS, Pearlman JA, Au WJ, et al. Retinal amyloid pathology and proof-of-concept imaging trial in Alzheimer’s disease. JCI Insight. 2017;2:93621. doi: 10.1172/jci.insight.93621. - DOI - PMC - PubMed

Publication types

MeSH terms