. 2021 Oct 5;12(1):5815.
doi: 10.1038/s41467-021-25983-9.

Diverse sediment microbiota shape methane emission temperature sensitivity in Arctic lakes

Affiliations

Diverse sediment microbiota shape methane emission temperature sensitivity in Arctic lakes

Joanne B Emerson et al. Nat Commun. .

Abstract

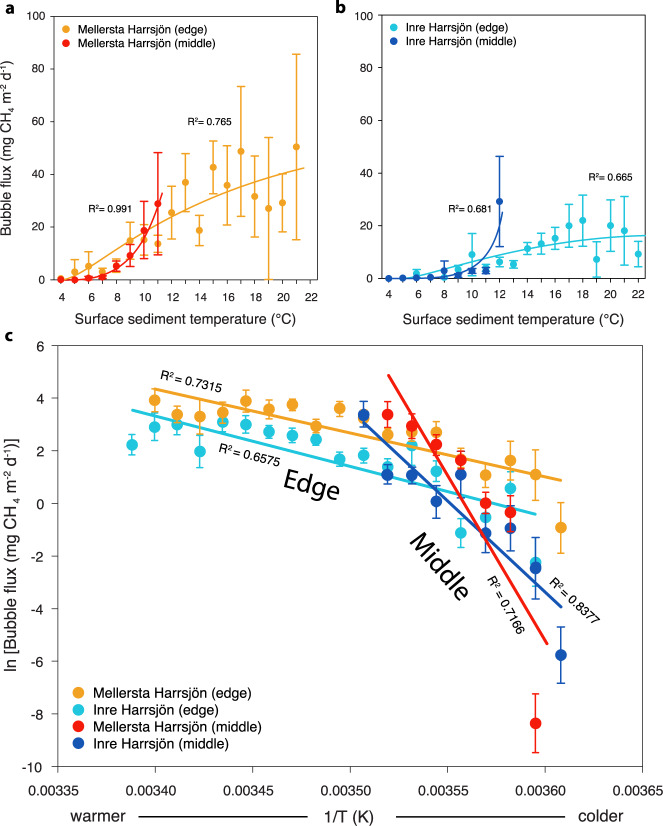
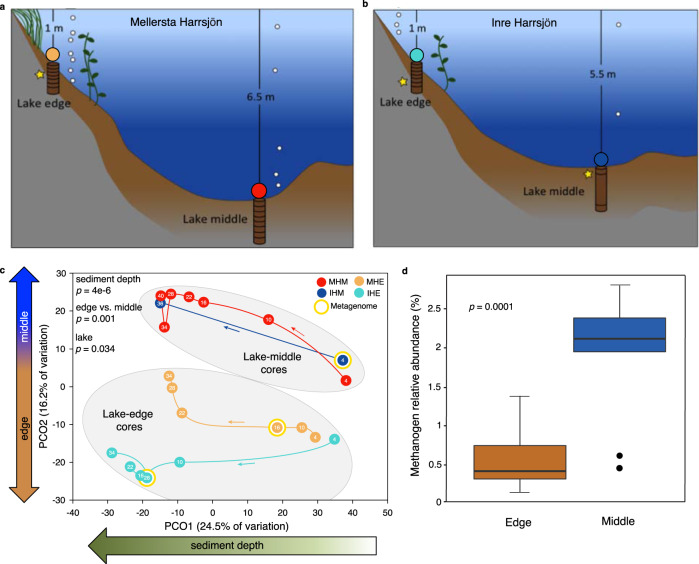
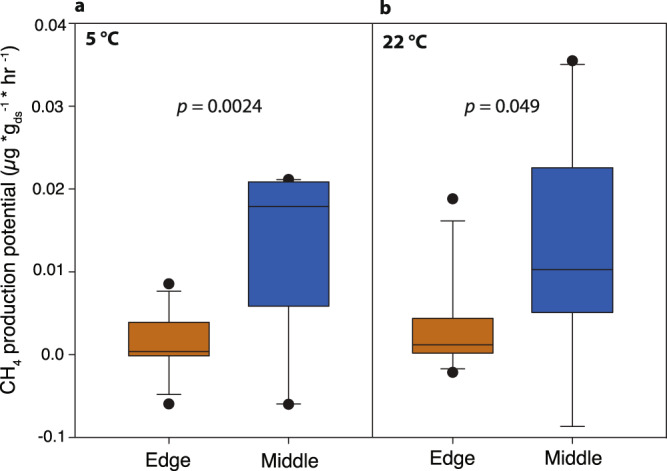
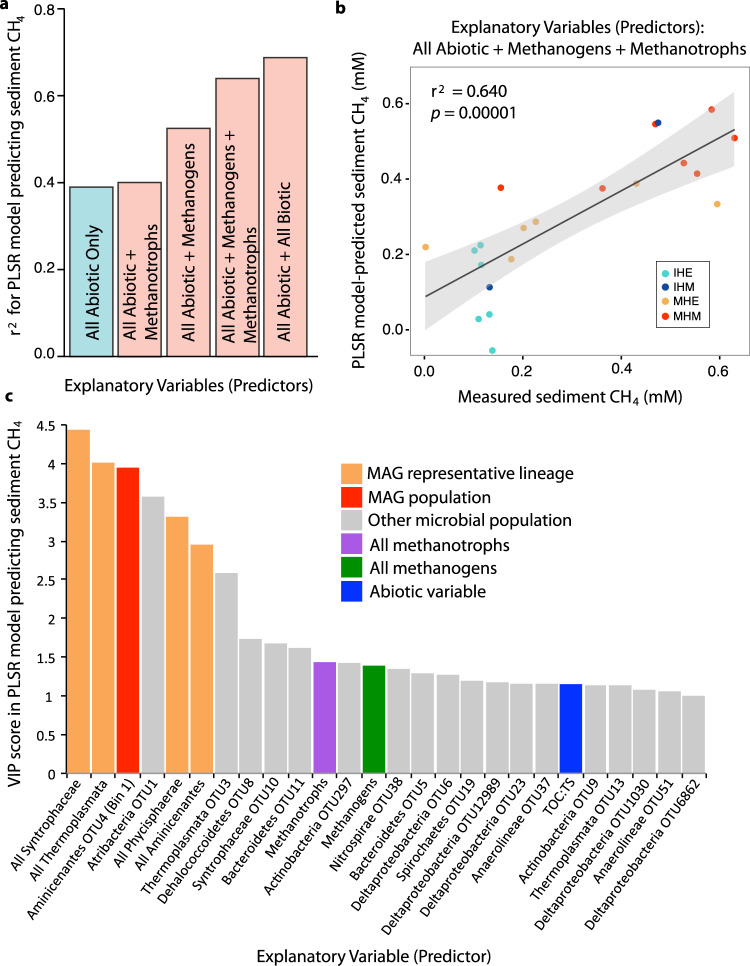
Northern post-glacial lakes are significant, increasing sources of atmospheric carbon through ebullition (bubbling) of microbially-produced methane (CH4) from sediments. Ebullitive CH4 flux correlates strongly with temperature, reflecting that solar radiation drives emissions. However, here we show that the slope of the temperature-CH4 flux relationship differs spatially across two post-glacial lakes in Sweden. We compared these CH4 emission patterns with sediment microbial (metagenomic and amplicon), isotopic, and geochemical data. The temperature-associated increase in CH4 emissions was greater in lake middles-where methanogens were more abundant-than edges, and sediment communities were distinct between edges and middles. Microbial abundances, including those of CH4-cycling microorganisms and syntrophs, were predictive of porewater CH4 concentrations. Results suggest that deeper lake regions, which currently emit less CH4 than shallower edges, could add substantially to CH4 emissions in a warmer Arctic and that CH4 emission predictions may be improved by accounting for spatial variations in sediment microbiota.


Conflict of interest statement

The authors declare no competing interests.

Figures

Fig. 1
Fig. 1. Temperature responsiveness of ebullitive methane flux from two post-glacial lakes.
Ebullitive CH4 flux as a function of surface sediment temperature (data were binned in 1 °C intervals; see Methods) from June to September 2009–2014 for the edge vs. middle regions of a Lake Mellersta Harrsjön (MH) (MH edge—n = 1581, MH middle—n = 795 independent ebullitive CH4 flux measurements) and b Lake Inre Harrsjön (IH) (IH edge—n = 2318, IH middle—n = 432 independent ebullitive CH4 flux measurements). Error bars in a and b are 95% confidence intervals, fit lines are 2nd-degree polynomials, and points are means. c Arrhenius plots of the data in a and b (n = 5126 independent ebullitive CH4 flux measurements); ln(bubble CH4 flux) vs. the inverse surface sediment temperature in K. Points are means and error bars are 95% confidence intervals. Data are color-coded by the lake and by edge (littoral) and middle (pelagic) zones.
Fig. 2
Fig. 2. Lake sediment bacteria and archaea in two post-glacial lakes.
a, b Schematic overview of lakes and cores collected for DNA sequencing analyses, with core subsections indicated by horizontal lines. Cores in each lake are referred to as Lake edge or Lake middle, with overlying water depth as indicated, and the four colored circles are used to distinguish each core and/or lake location throughout the figures. Yellow stars indicate cores and depths targeted for shotgun metagenomics. c Principal coordinates analysis (PCoA) of microbial community composition across samples (each core subsection, n = 21), based on 16S rRNA gene amplicon abundances of microbial operational taxonomic units (OTUs); circles represent samples, and samples in closer proximity have more similar microbial community composition. Thin arrows along colored lines indicate increasing depth within each core. p-Values from one-way PERMANOVA indicate how significantly microbial community composition differed according to the indicated categorical variable (significant if p < 0.05). d Percent relative abundance of OTUs identified as methanogens in 16S rRNA gene amplicon data in lake edges compared to lake middles (p-value from two-tailed Student’s t-test, significant if p < 0.05), n = 21 biologically independent samples. Lines in boxes depict the median, boxes indicate 75th percentile, whiskers 95th percentile, and points are outliers.
Fig. 3
Fig. 3. Methane production from anaerobic laboratory incubations of lake sediments.
Sediments were collected from edges and middles of lakes Inre Harrsjön and Mellersta Harrsjön in 2012 and 2013 (see Methods) and incubated at a 5 °C (n = 12 independent incubation experiments) and b 22 °C (n = 12 independent incubation experiments). Headspace CH4 concentrations were measured daily for 5 days and average daily CH4 fluxes were calculated for each sample. Lines in boxes depict the median, boxes indicate 75th percentile, whiskers 95th percentile, and points are outliers. ds dry sediment. p-Values for both a and b are from one-way ANOVA edge vs. middle comparisons (significant if p < 0.05).
Fig. 4
Fig. 4. Partial least squares regression (PLSR) statistical modeling to predict sediment CH4 concentrations.
PLSR analyses tested the ability of different suites of explanatory variables to predict measured sediment CH4 concentrations in the four cores from 2012 across depths (n = 21); in all models, all measured abiotic variables (except those related to CH4 concentrations, see Methods) were included as explanatory variables, and biotic variables were added as indicated. Biotic variables included relative abundances of specific OTUs and/or summed OTU abundances grouped by taxonomy or predicted metabolism (as indicated), from 16S rRNA gene amplicon data. a Correlation coefficient (r2) for PLSR models predicting sediment CH4 using different combinations of explanatory variables. Each bar represents a single underlying data point, with the value of that point indicated by the bar height along the y-axis. b Linear regression of measured and model-predicted sediment CH4, considering all abiotic variables and methanogen and methanotroph abundances as explanatory variables; error band represents 95% confidence interval; each point is a sample, colored by core. c For the model with the highest r2 (rightmost in panel a), all significant explanatory variables are shown (VIP scores > 1, n = 26 significant explanatory variables out of 153 total variables considered). VIP scores show the relative contribution of each variable to the model, with higher VIP scores indicating a more significant contribution. Each bar represents a single underlying data point, with the value of that point indicated by the bar height along the y-axis.

References

    1. Wik M, Varner RK, Anthony KW, MacIntyre S, Bastviken D. Climate-sensitive northern lakes and ponds are critical components of methane release. Nat. Geosci. 2016;9:99–105. doi: 10.1038/ngeo2578. - DOI
    1. Wik M, et al. Energy input is primary controller of methane bubbling in subarctic lakes. Geophys. Res. Lett. 2014;41:555–560. doi: 10.1002/2013GL058510. - DOI
    1. Holgerson MA, Raymond PA. Large contribution to inland water CO2 and CH4 emissions from very small ponds. Nat. Geosci. 2016;9:222–226. doi: 10.1038/ngeo2654. - DOI
    1. Tan Z, Zhuang Q. Arctic lakes are continuous methane sources to the atmosphere under warming conditions. Environ. Res. Lett. 2015;10:054016. doi: 10.1088/1748-9326/10/5/054016. - DOI
    1. Verpoorter C, Kutser T, Seekell DA, Tranvik LJ. A global inventory of lakes based on high-resolution satellite imagery. Geophys. Res. Lett. 2014;41:6396–6402. doi: 10.1002/2014GL060641. - DOI

Publication types