. 2021 Oct 5;12(1):5820.
doi: 10.1038/s41467-021-26013-4.

Understanding the effectiveness of government interventions against the resurgence of COVID-19 in Europe

Affiliations

Understanding the effectiveness of government interventions against the resurgence of COVID-19 in Europe

Mrinank Sharma et al. Nat Commun. .

Abstract

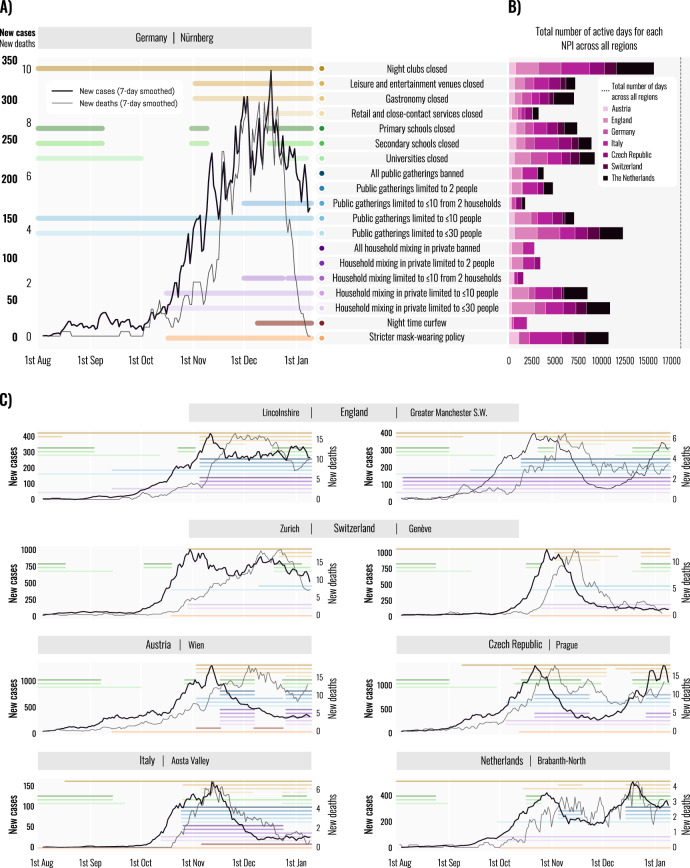
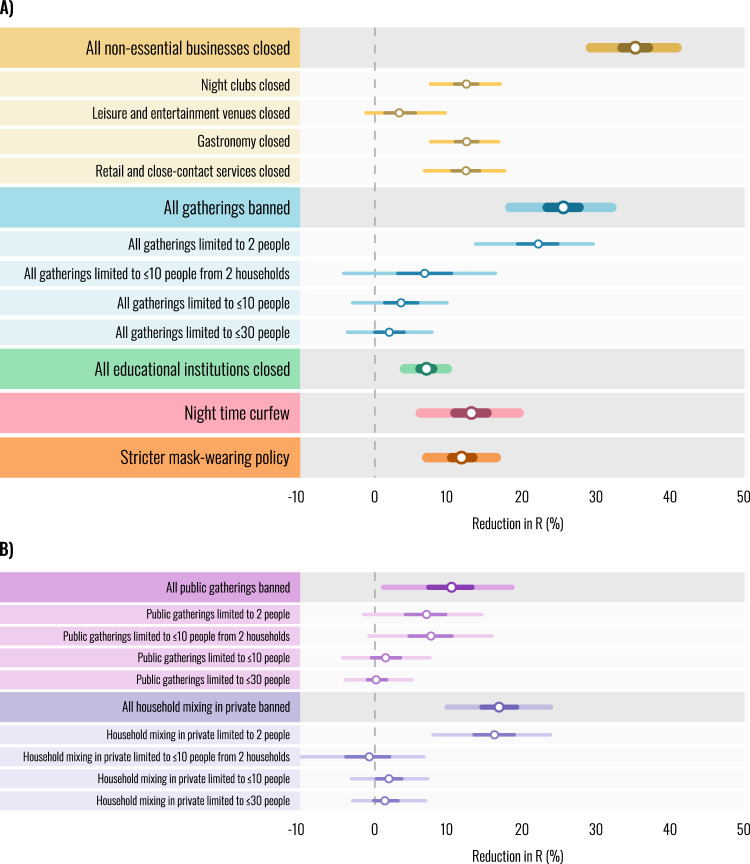
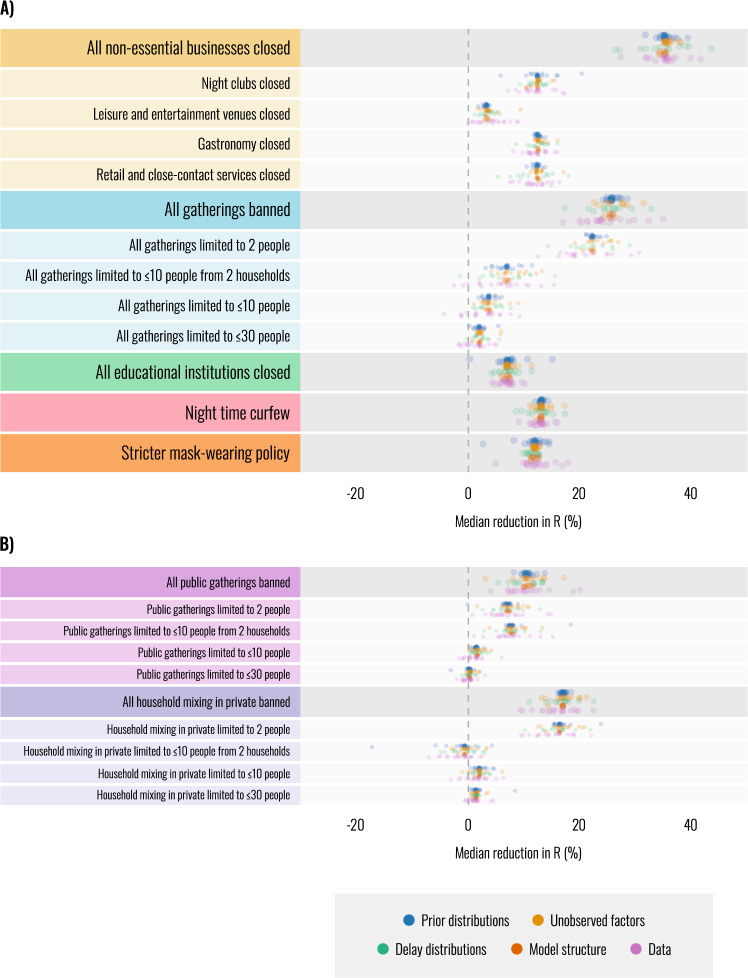
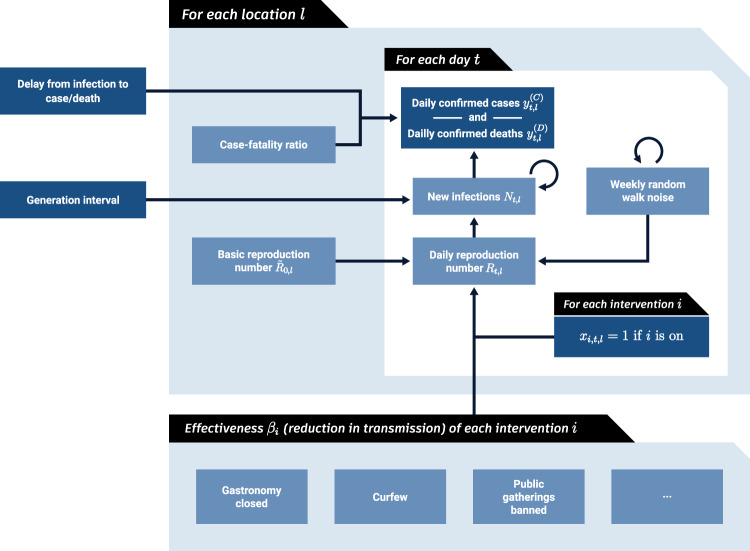
European governments use non-pharmaceutical interventions (NPIs) to control resurging waves of COVID-19. However, they only have outdated estimates for how effective individual NPIs were in the first wave. We estimate the effectiveness of 17 NPIs in Europe's second wave from subnational case and death data by introducing a flexible hierarchical Bayesian transmission model and collecting the largest dataset of NPI implementation dates across Europe. Business closures, educational institution closures, and gathering bans reduced transmission, but reduced it less than they did in the first wave. This difference is likely due to organisational safety measures and individual protective behaviours-such as distancing-which made various areas of public life safer and thereby reduced the effect of closing them. Specifically, we find smaller effects for closing educational institutions, suggesting that stringent safety measures made schools safer compared to the first wave. Second-wave estimates outperform previous estimates at predicting transmission in Europe's third wave.


Conflict of interest statement

J. Kulveit has advised several governmental and nongovernmental entities about interventions against COVID-19. L. Chindelevitch has acted as a paid consultant to Pfizer and the Foundation for Innovative New Diagnostics, outside of the submitted work. He also volunteers as a scientist with the creative destruction lab Oxford. Y. Gal has received a research grant (studentship) from GlaxoSmithKline, outside of the submitted work. S. Bhatt sits on and advises the Scientific Pandemic Influenza Group on Modelling (SPI-M) a subgroup of the Scientific Advisory Group for Emergencies (SAGE). His work on this board is funded by the UKRI/MRC. The remaining authors declare no competing interests. None of the above-mentioned entities had any influence on the conceptualisation, design, data collection, analysis, decision to publish, or preparation of the paper.

Figures

Fig. 1
Fig. 1. Dataset.
A Cases, deaths and implementation dates of nonpharmaceutical interventions in an example region (Nürnberg, Germany). Coloured lines indicate the dates that each intervention was active. Colours represent different interventions. B The total number of days that each intervention was used in our dataset, aggregated across n = 114 regions but separated by country. The dashed vertical line indicates the total number of region days in our dataset. C Additional timelines showing cases, deaths, and interventions in six regions. Comparing two regions within England (Lincolnshire and Greater Manchester S.W.) and within Switzerland (Zürich and Géneve) reveals significant subnational variation, both in the interventions used and in the evolution of the epidemic.
Fig. 2
Fig. 2. Intervention effectiveness under default model settings.
Posterior percentage reductions in Rt shown. Markers indicate posterior median estimates from 5000 posterior samples across four chains. Lines indicate the 50 and 95% posterior credible intervals. A negative 1% reduction refers to a 1% increase in Rt. A Effectiveness of the main interventions included in our study. Intervention names preceded by “All” show the combined effect of multiple interventions. For example, “All gatherings banned” shows the combined effect of banning all public gatherings and all households mixing in private. B Individual effectiveness estimates for gathering types, separated into public gatherings and household mixing in private.
Fig. 3
Fig. 3. Robustness of median intervention effectiveness estimates across n = 86 experimental conditions (univariate sensitivity analysis).
Each dot represents the posterior median intervention effectiveness under a particular experimental condition. This figure contains only univariate sensitivity analysis—please see Supplementary Note 2.2 for multivariate sensitivity. Dot colour indicates categories of sensitivity analyses. Each category contains several sensitivity analyses (17 in total) and each sensitivity analysis contains several experimental conditions (n = 86 in total). Supplementary Table S1 lists all sensitivity analyses by category. A Robustness of effectiveness estimates of the main interventions included in our study. Intervention names preceded by “All” show the combined effect of multiple interventions. For example, “All gatherings banned” shows the combined effect of banning all public gatherings and all households mixing in private. B Robustness of the individual effectiveness estimates for separately banning public gatherings or household mixing in private.
Fig. 4
Fig. 4. Model Overview.
Dark blue nodes are observed. We describe the diagram from bottom to top. The mean effect parameter of NPI i is βi. On each day t, a location’s reproduction number Rt,l depends on the basic reproduction number R~0,l, the NPIs active in that location and a location-specific latent weekly random walk. The active NPIs are encoded by xi,t,l, which is 1 if NPI i is active in location l at time t, and 0 otherwise. A random walk flexibly accounts for trends in transmission due to unobserved factors. Rt,l is used to compute daily infections Nt,l given the generation interval distribution and the infections on previous days. Finally, the expected number of daily confirmed cases yt,lC and deaths yt,lD are computed using discrete convolutions of Nt,l with the relevant delay distributions.

References

    1. Flaxman S, et al. Imperial College COVID-19 Response Team, A. C. Ghani, C. A. Donnelly, S. Riley, M. A. C. Vollmer, N. M. Ferguson, L. C. Okell, S. Bhatt, Estimating the effects of non-pharmaceutical interventions on COVID-19 in Europe. Nature. 2020;584:257–261. doi: 10.1038/s41586-020-2405-7. - DOI - PubMed
    1. Brauner JM, et al. Inferring the effectiveness of government interventions against COVID-19. Science. 2021;371:eabd9338. doi: 10.1126/science.abd9338. - DOI - PMC - PubMed
    1. Hsiang S, et al. The effect of large-scale anti-contagion policies on the COVID-19 pandemic. Nature. 2020;584:262–267. doi: 10.1038/s41586-020-2404-8. - DOI - PubMed
    1. Salje H, et al. Estimating the burden of SARS-CoV-2 in France. Science. 2020;369:208–211. doi: 10.1126/science.abc3517. - DOI - PMC - PubMed
    1. Looi M-K. Covid-19: is a second wave hitting Europe? Br. Med. J. 2020;371:m4113. doi: 10.1136/bmj.m4113. - DOI - PubMed

Publication types