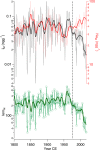
Antarctic ozone hole modifies iodine geochemistry on the Antarctic Plateau
- PMID: 34611165
- PMCID: PMC8492625
- DOI: 10.1038/s41467-021-26109-x
Antarctic ozone hole modifies iodine geochemistry on the Antarctic Plateau
Abstract
Polar stratospheric ozone has decreased since the 1970s due to anthropogenic emissions of chlorofluorocarbons and halons, resulting in the formation of an ozone hole over Antarctica. The effects of the ozone hole and the associated increase in incoming UV radiation on terrestrial and marine ecosystems are well established; however, the impact on geochemical cycles of ice photoactive elements, such as iodine, remains mostly unexplored. Here, we present the first iodine record from the inner Antarctic Plateau (Dome C) that covers approximately the last 212 years (1800-2012 CE). Our results show that the iodine concentration in ice remained constant during the pre-ozone hole period (1800-1974 CE) but has declined twofold since the onset of the ozone hole era (~1975 CE), closely tracking the total ozone evolution over Antarctica. Based on ice core observations, laboratory measurements and chemistry-climate model simulations, we propose that the iodine decrease since ~1975 is caused by enhanced iodine re-emission from snowpack due to the ozone hole-driven increase in UV radiation reaching the Antarctic Plateau. These findings suggest the potential for ice core iodine records from the inner Antarctic Plateau to be as an archive for past stratospheric ozone trends.
© 2021. The Author(s).
Conflict of interest statement
The authors declare no competing interests.
Figures


References
-
- Orphal J, et al. Absorption cross-sections of ozone in the ultraviolet and visible spectral regions: Status report 2015. J. Mol. Spectrosc. 2016;327:105–121. doi: 10.1016/j.jms.2016.07.007. - DOI
-
- Williamson CE, et al. Solar ultraviolet radiation in a changing climate. Nat. Clim. Change. 2014;4:434–441. doi: 10.1038/nclimate2225. - DOI
-
- Molina MJ, Rowland FS. Stratospheric sink for chlorofluoromethanes: chlorine atom-catalysed destruction of ozone. Nature. 1974;249:810–812. doi: 10.1038/249810a0. - DOI
-
- McElroy MB, Salawitch RJ, Wofsy SC, Logan JA. Reductions of Antarctic ozone due to synergistic interactions of chlorine and bromine. Nature. 1986;321:759–762. doi: 10.1038/321759a0. - DOI
-
- Solomon S. Stratospheric ozone depletion: a review of concepts and history. Rev. Geophys. 1999;37:275–316. doi: 10.1029/1999RG900008. - DOI
Publication types
LinkOut - more resources
Full Text Sources
Miscellaneous

