

A high-resolution HLA reference panel capturing global population diversity enables multi-ancestry fine-mapping in HIV host response
- PMID: 34611364
- PMCID: PMC8959399
- DOI: 10.1038/s41588-021-00935-7
A high-resolution HLA reference panel capturing global population diversity enables multi-ancestry fine-mapping in HIV host response
Erratum in
-
Author Correction: A high-resolution HLA reference panel capturing global population diversity enables multi-ancestry fine-mapping in HIV host response.Nat Genet. 2021 Dec;53(12):1722. doi: 10.1038/s41588-021-00979-9. Nat Genet. 2021. PMID: 34728834 Free PMC article. No abstract available.
Abstract
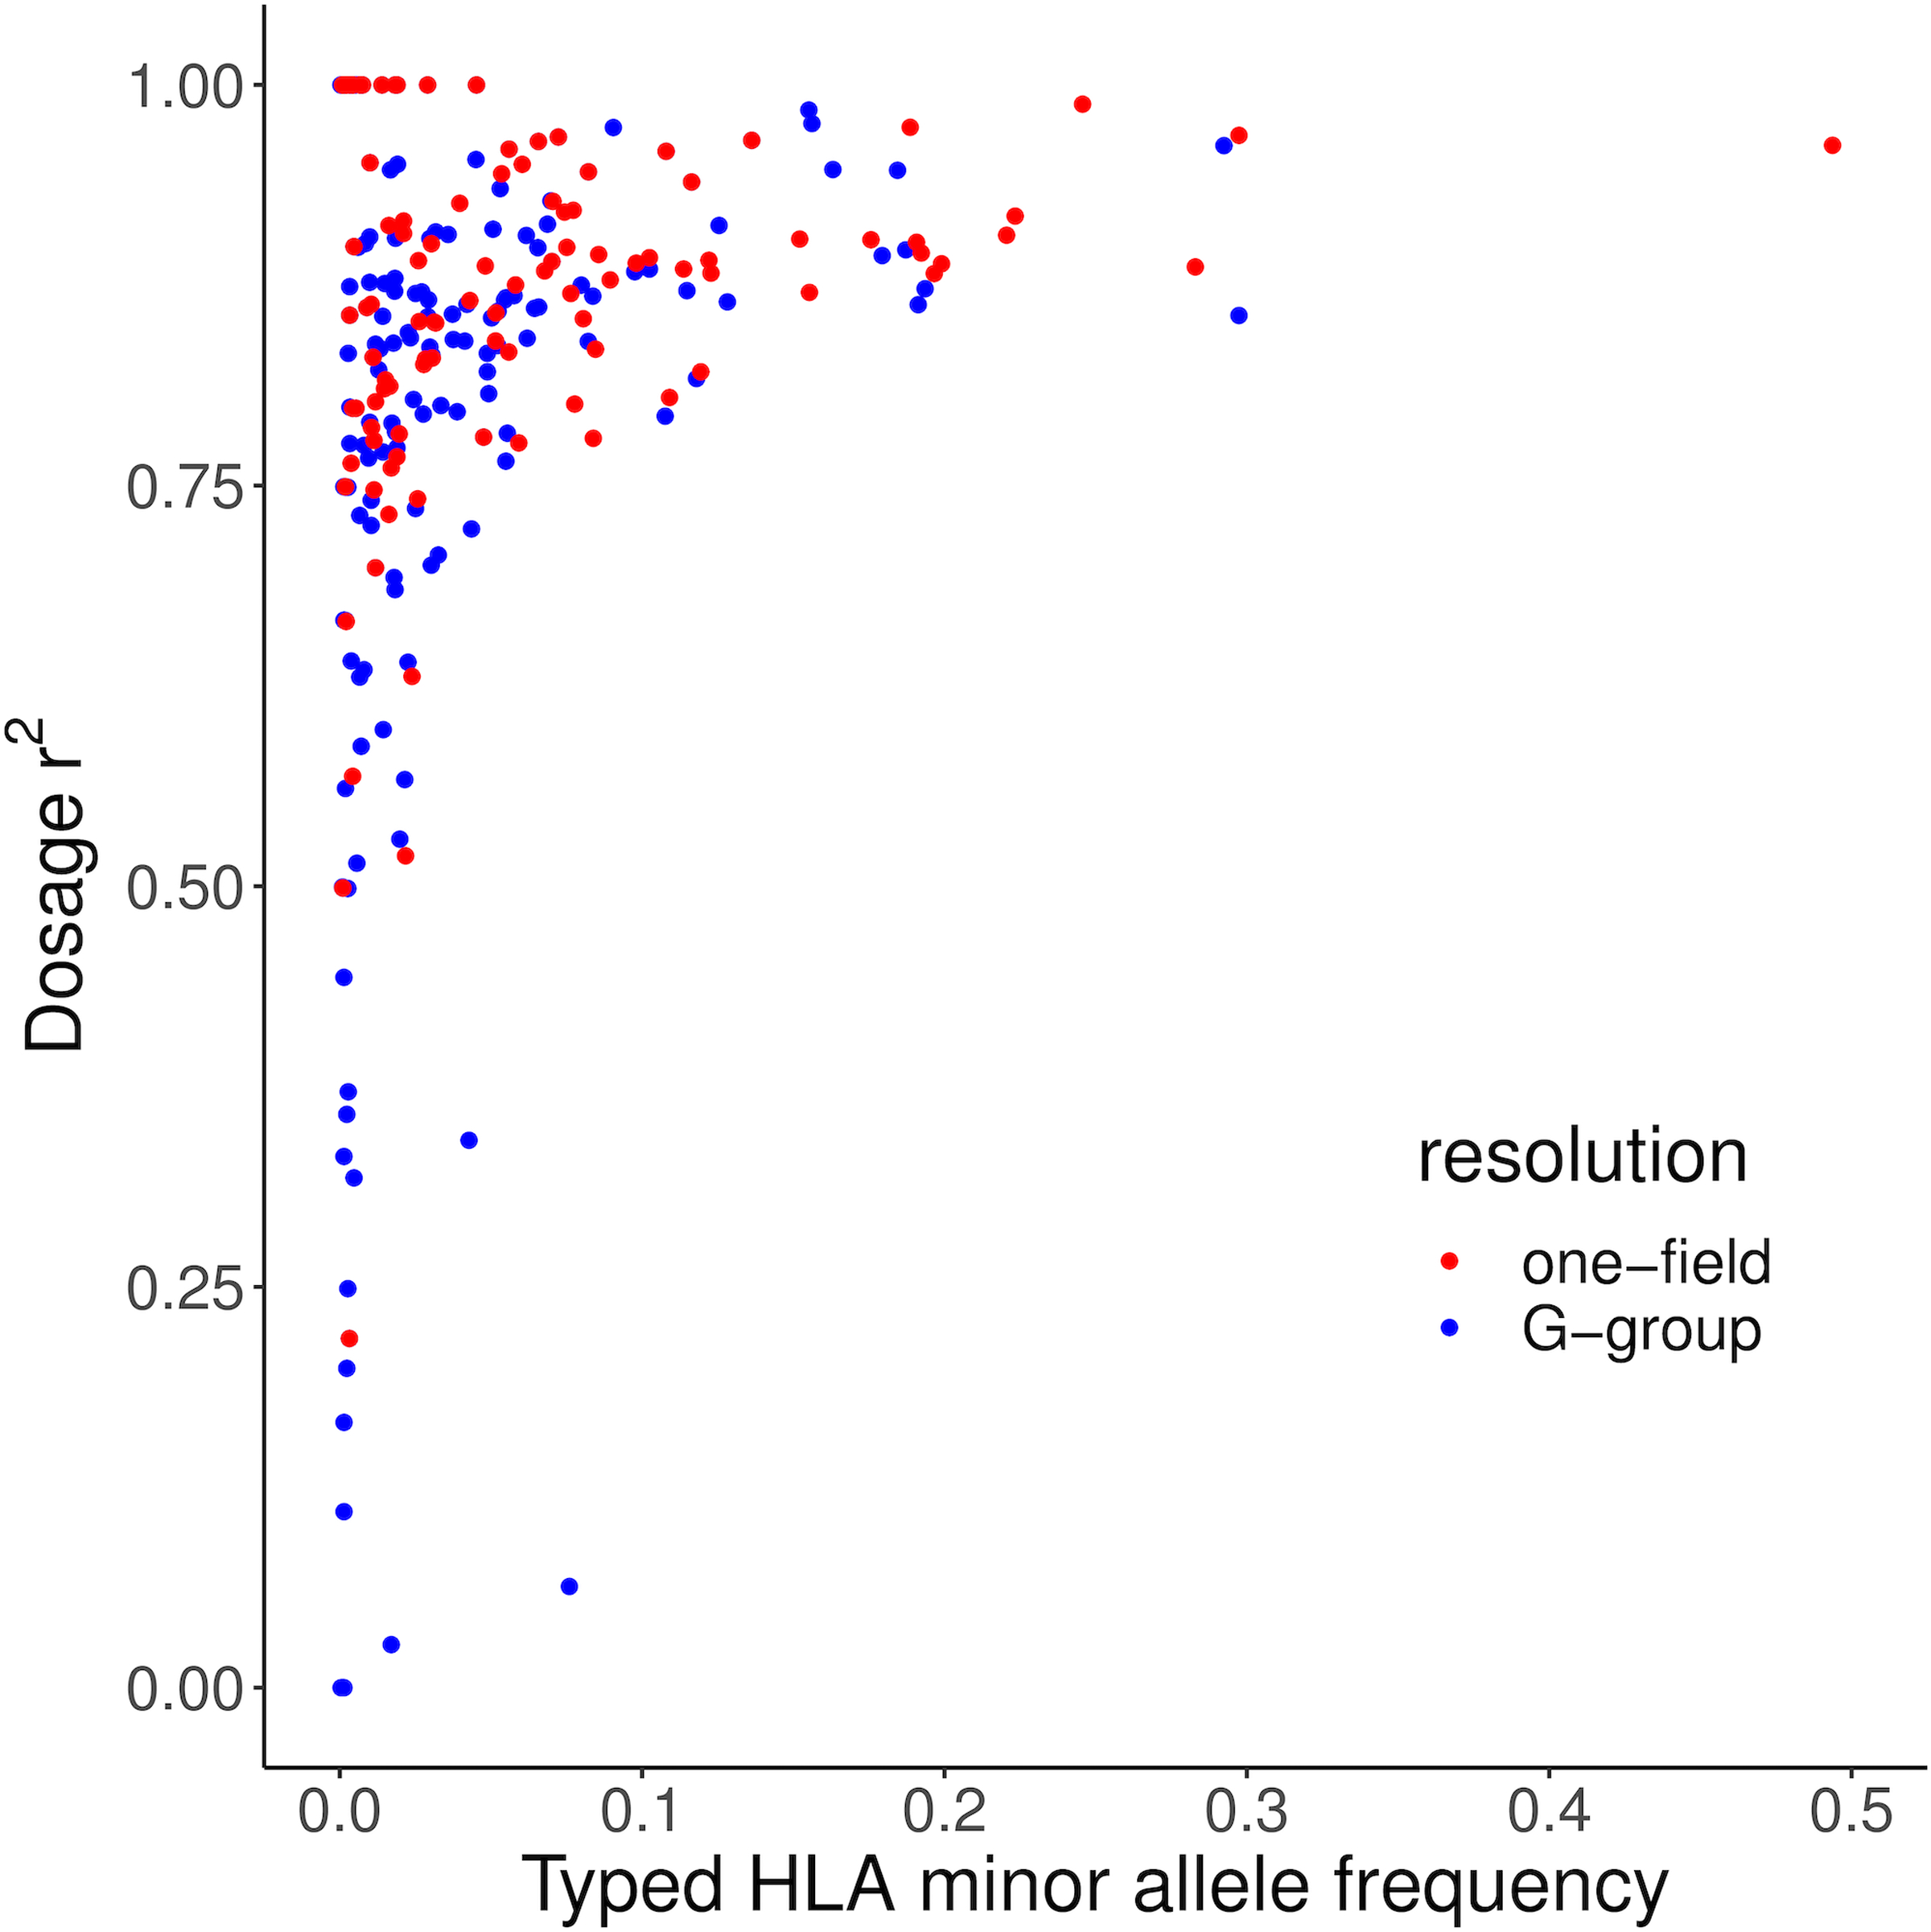
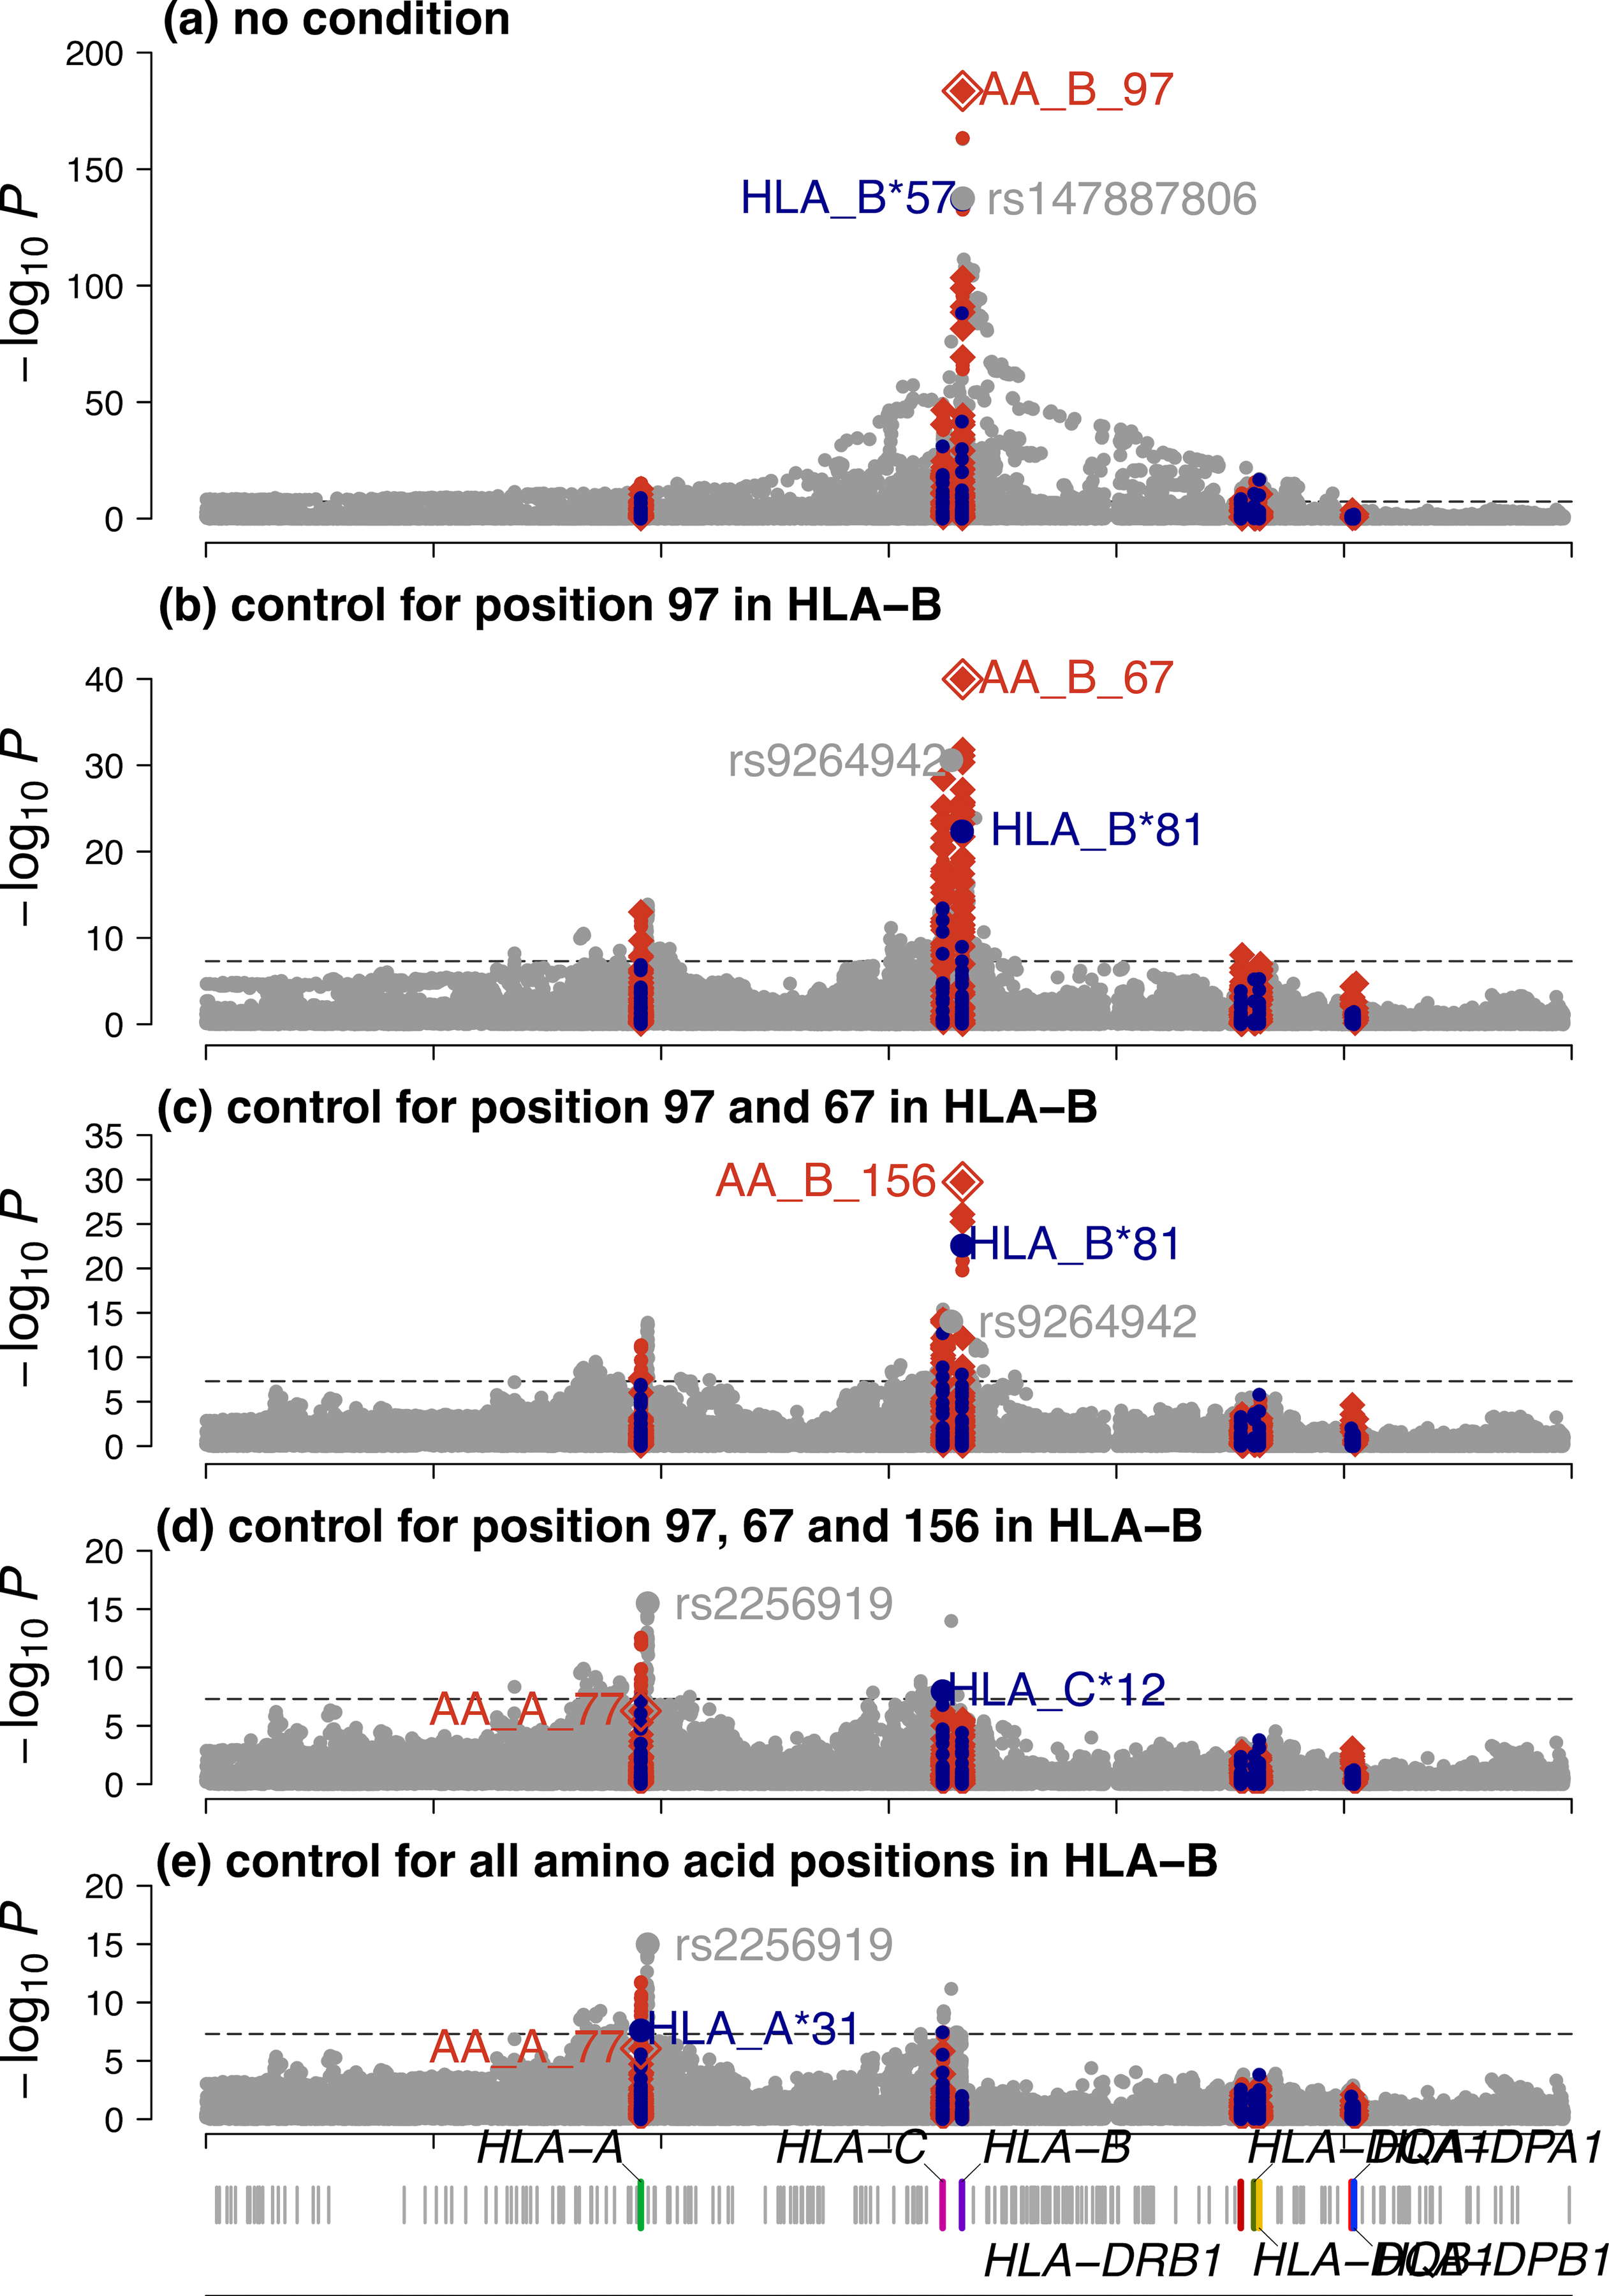
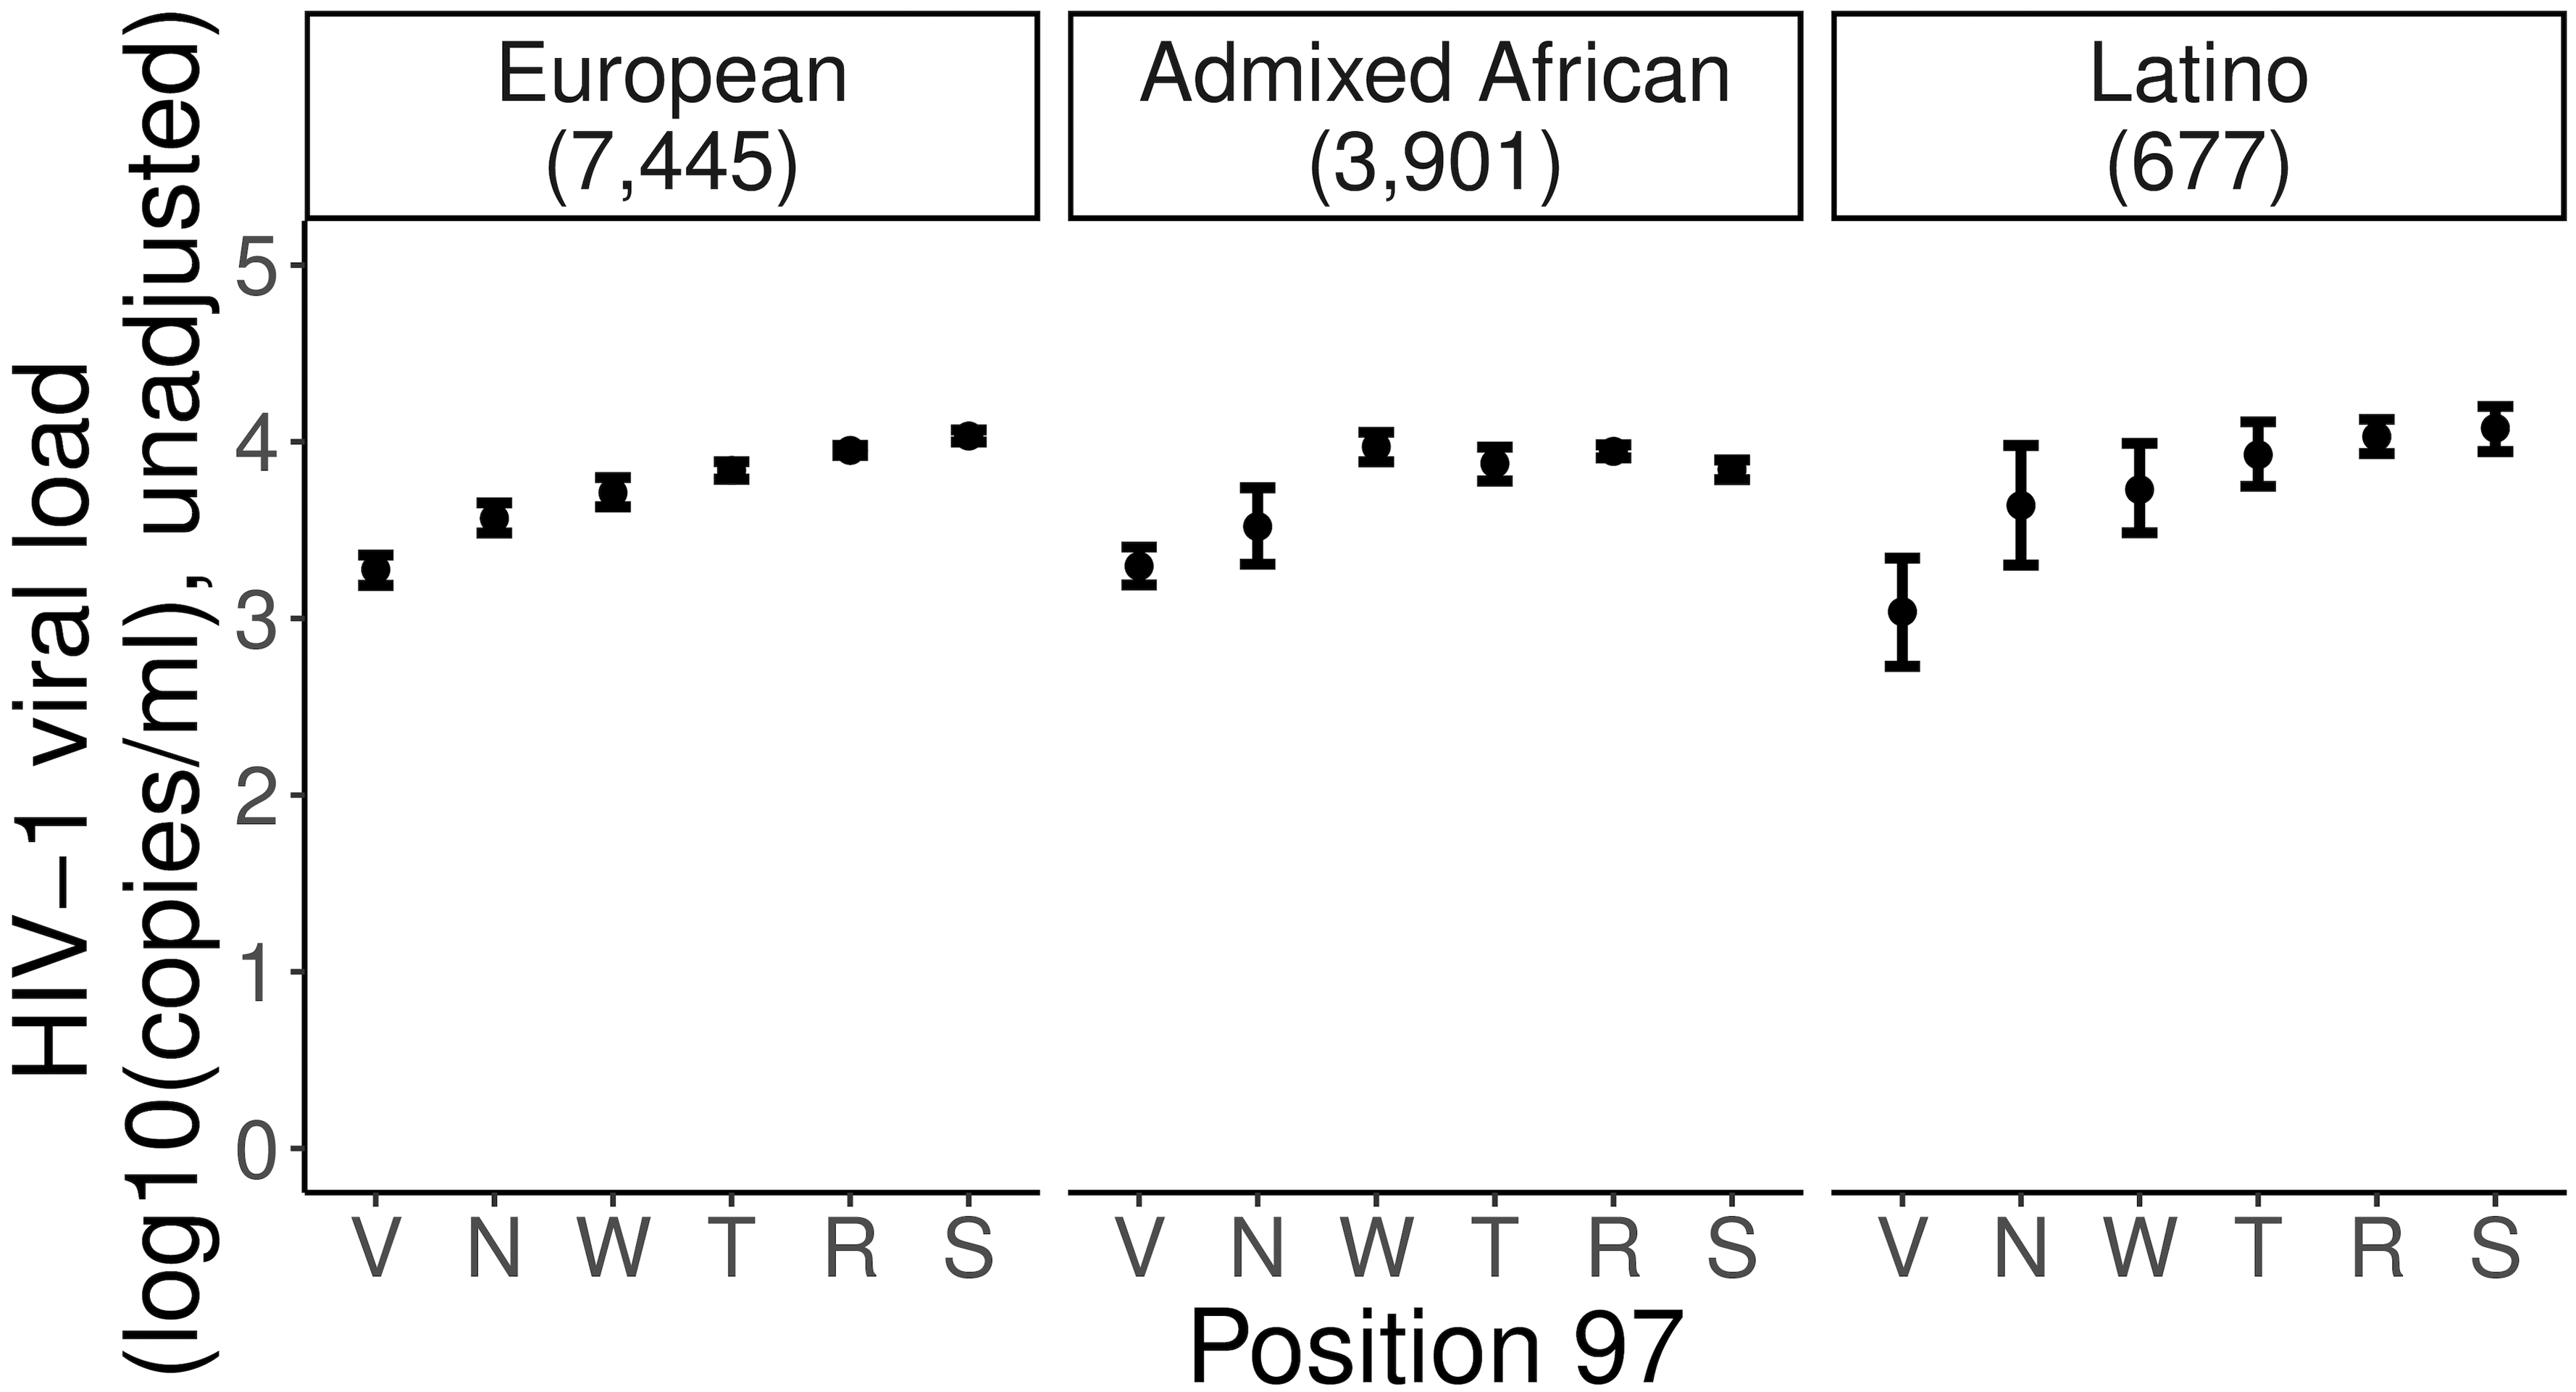
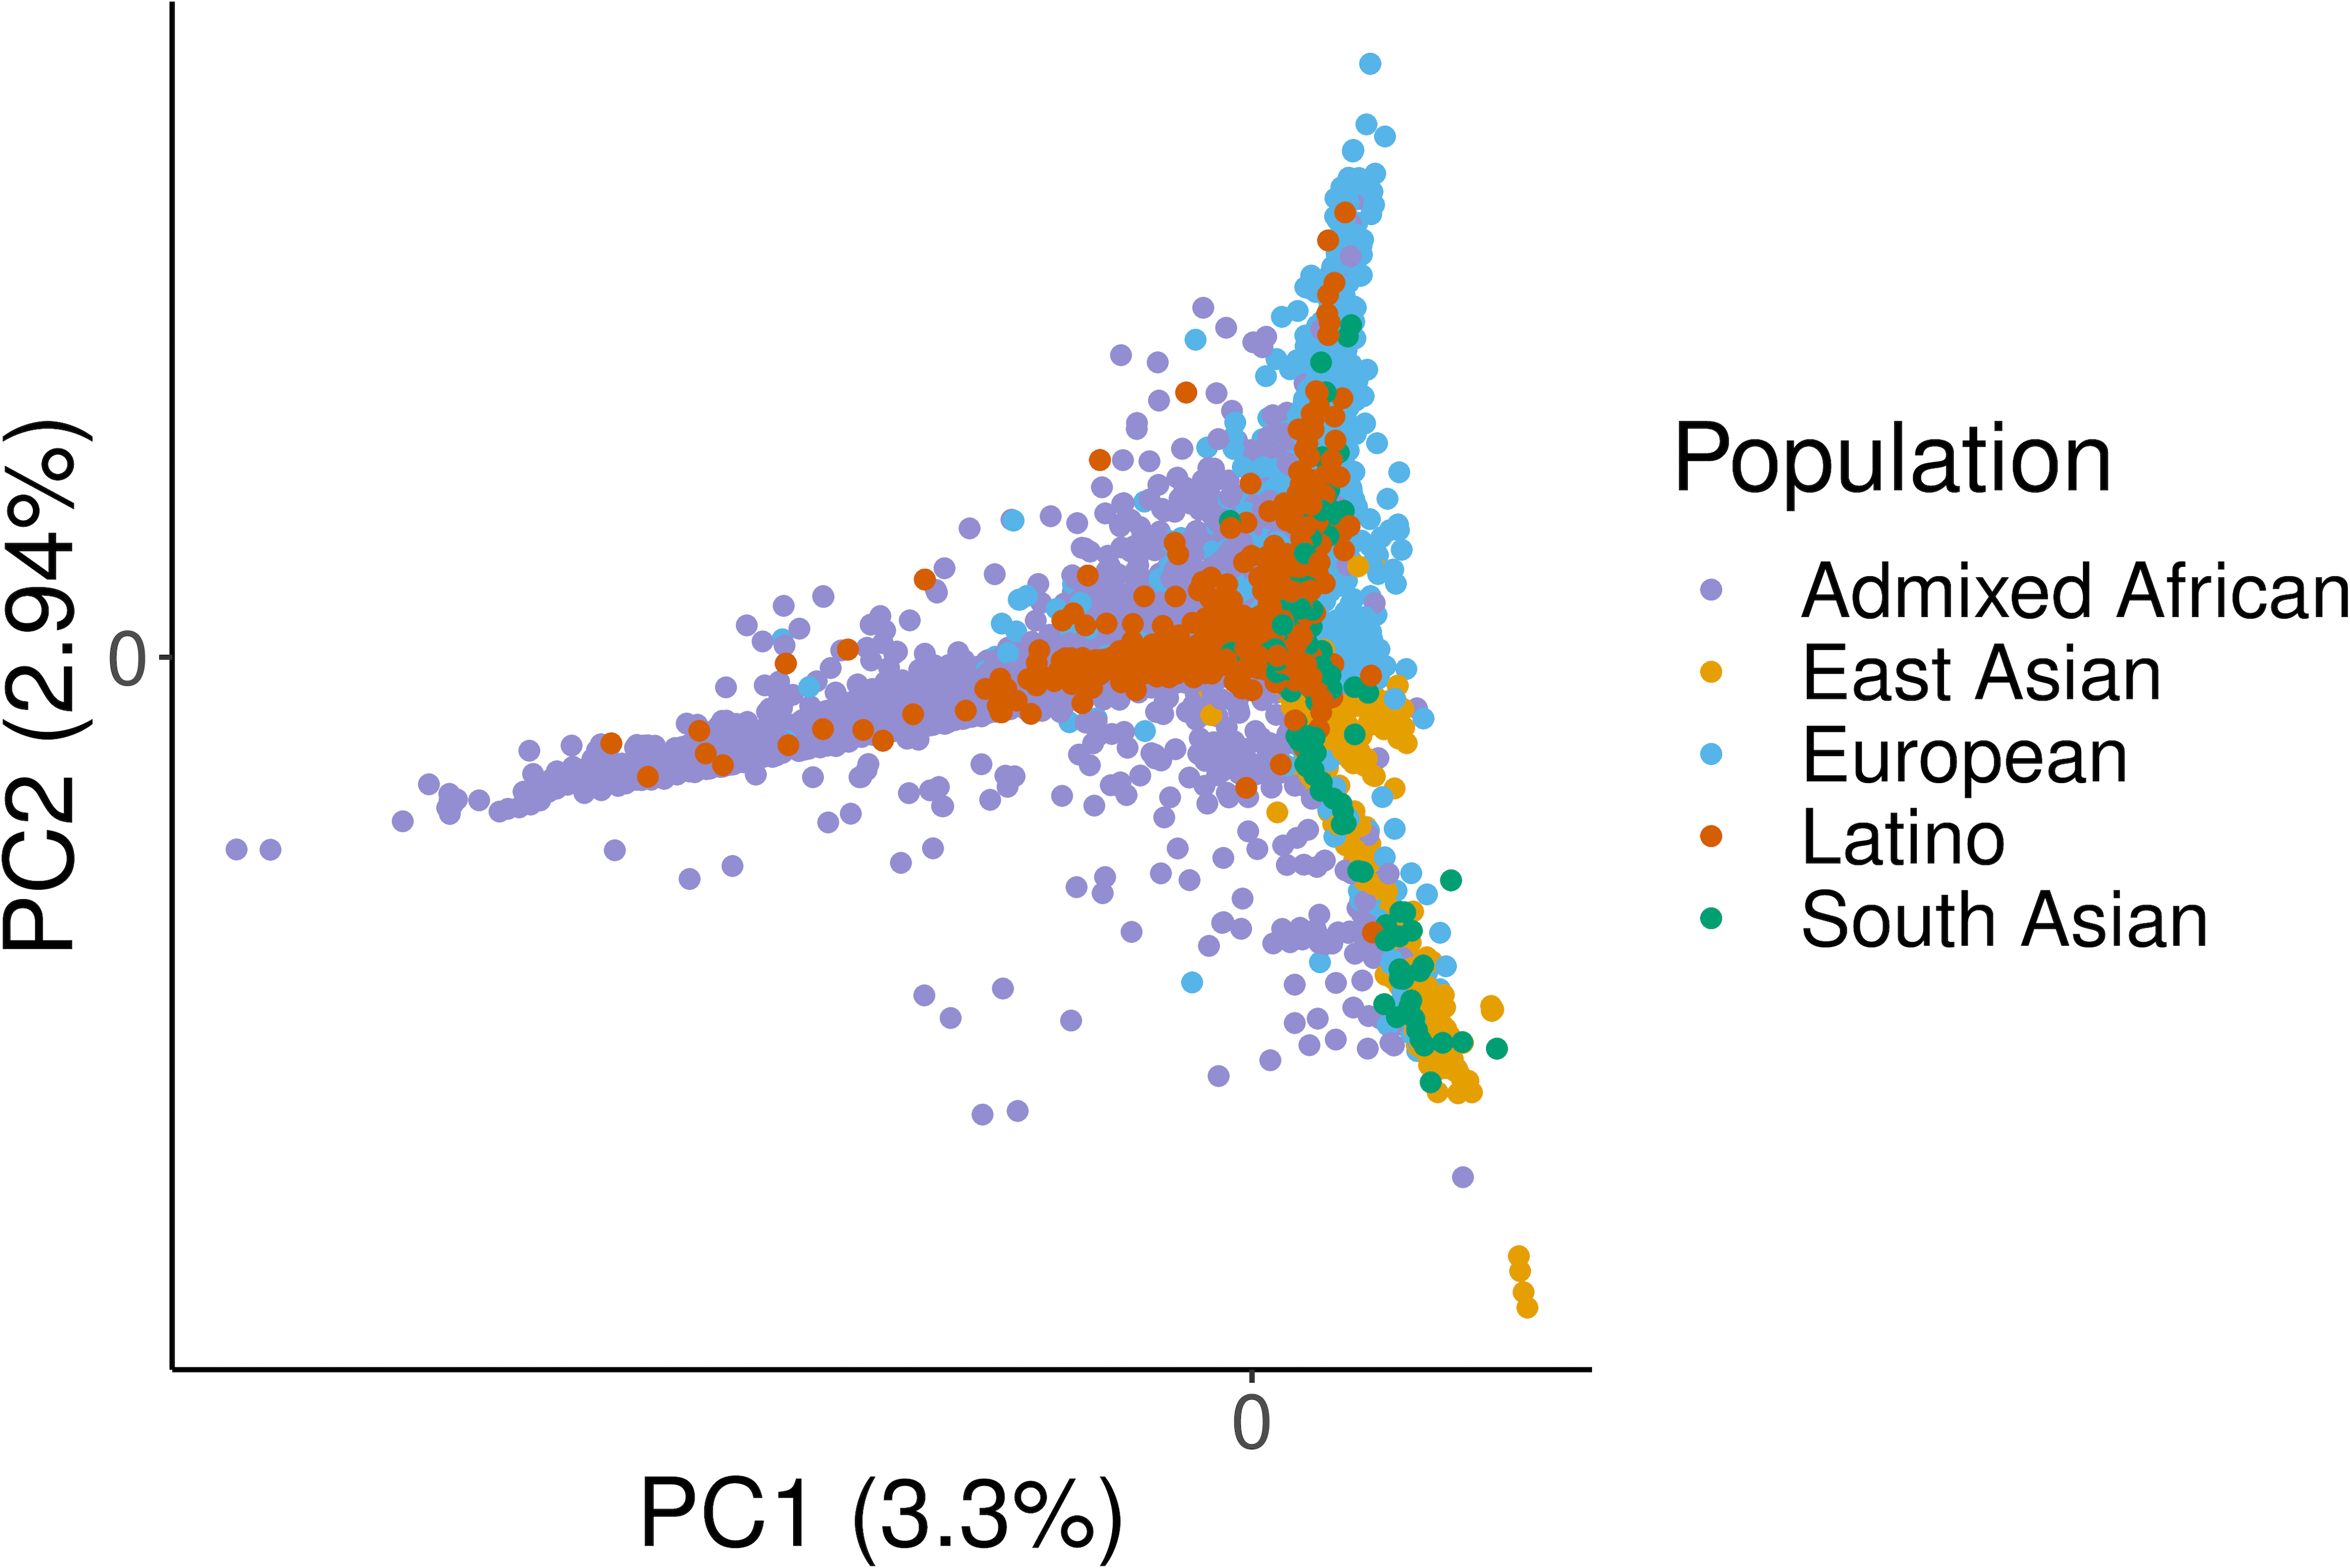
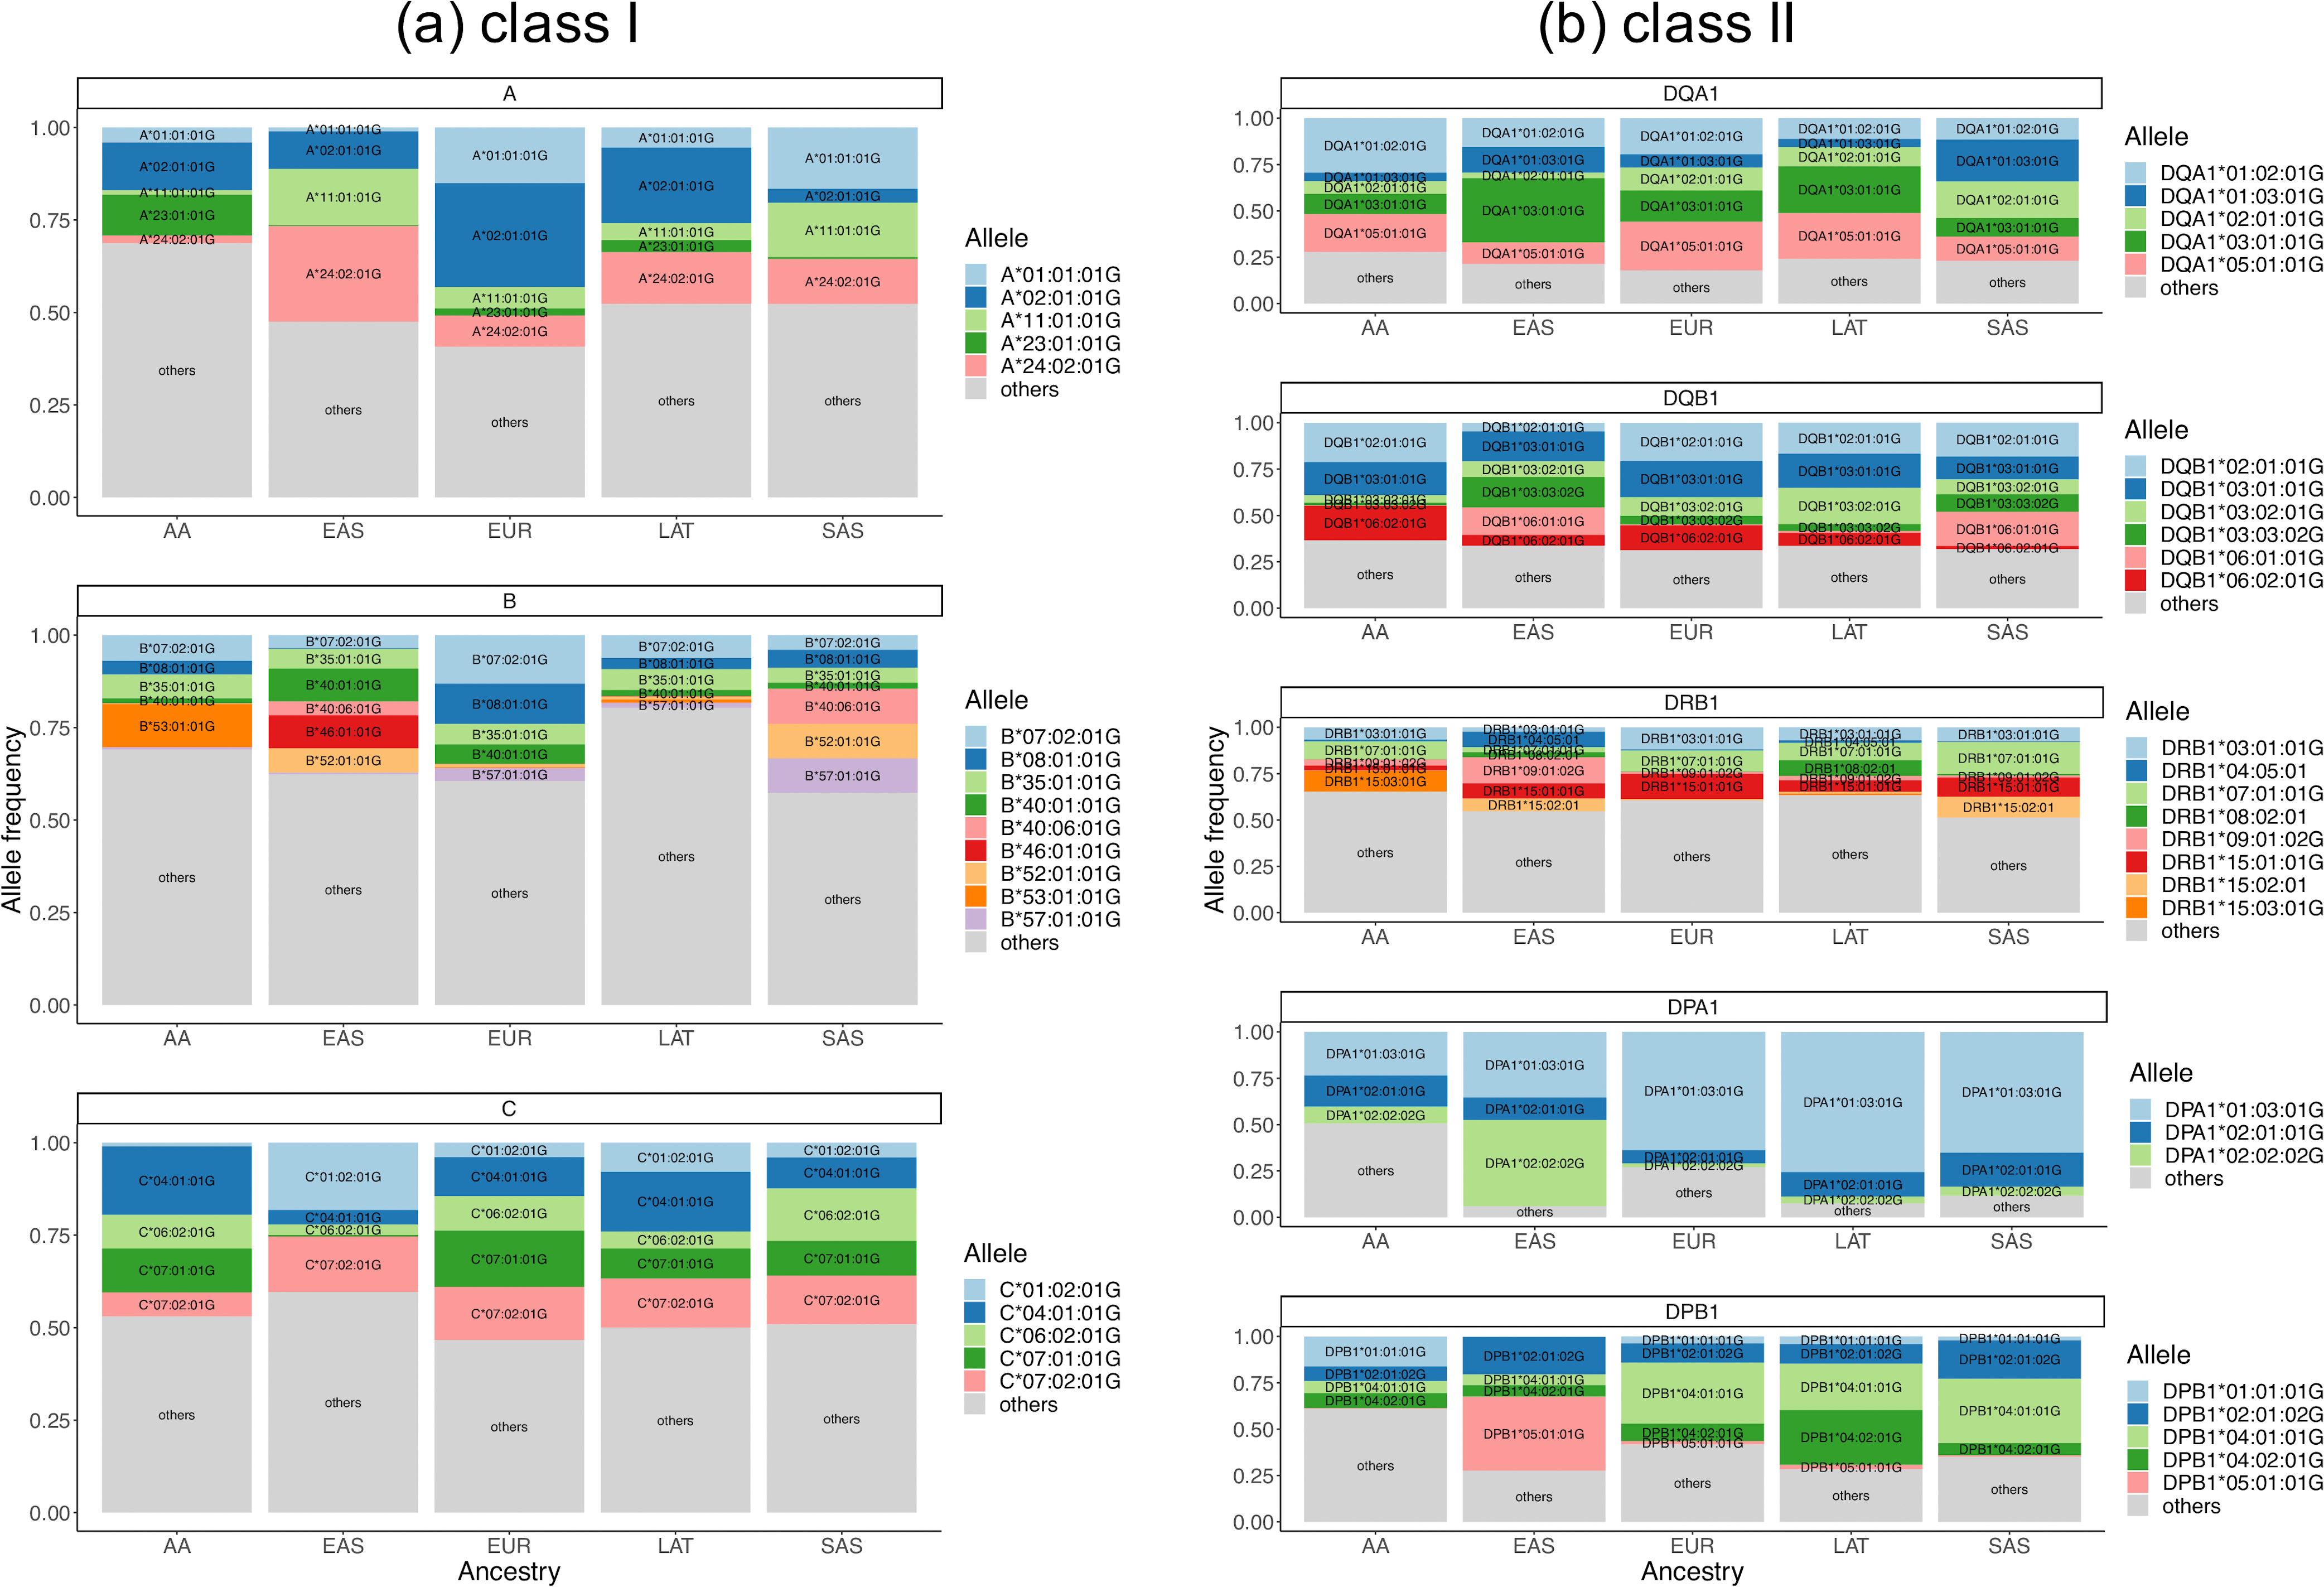
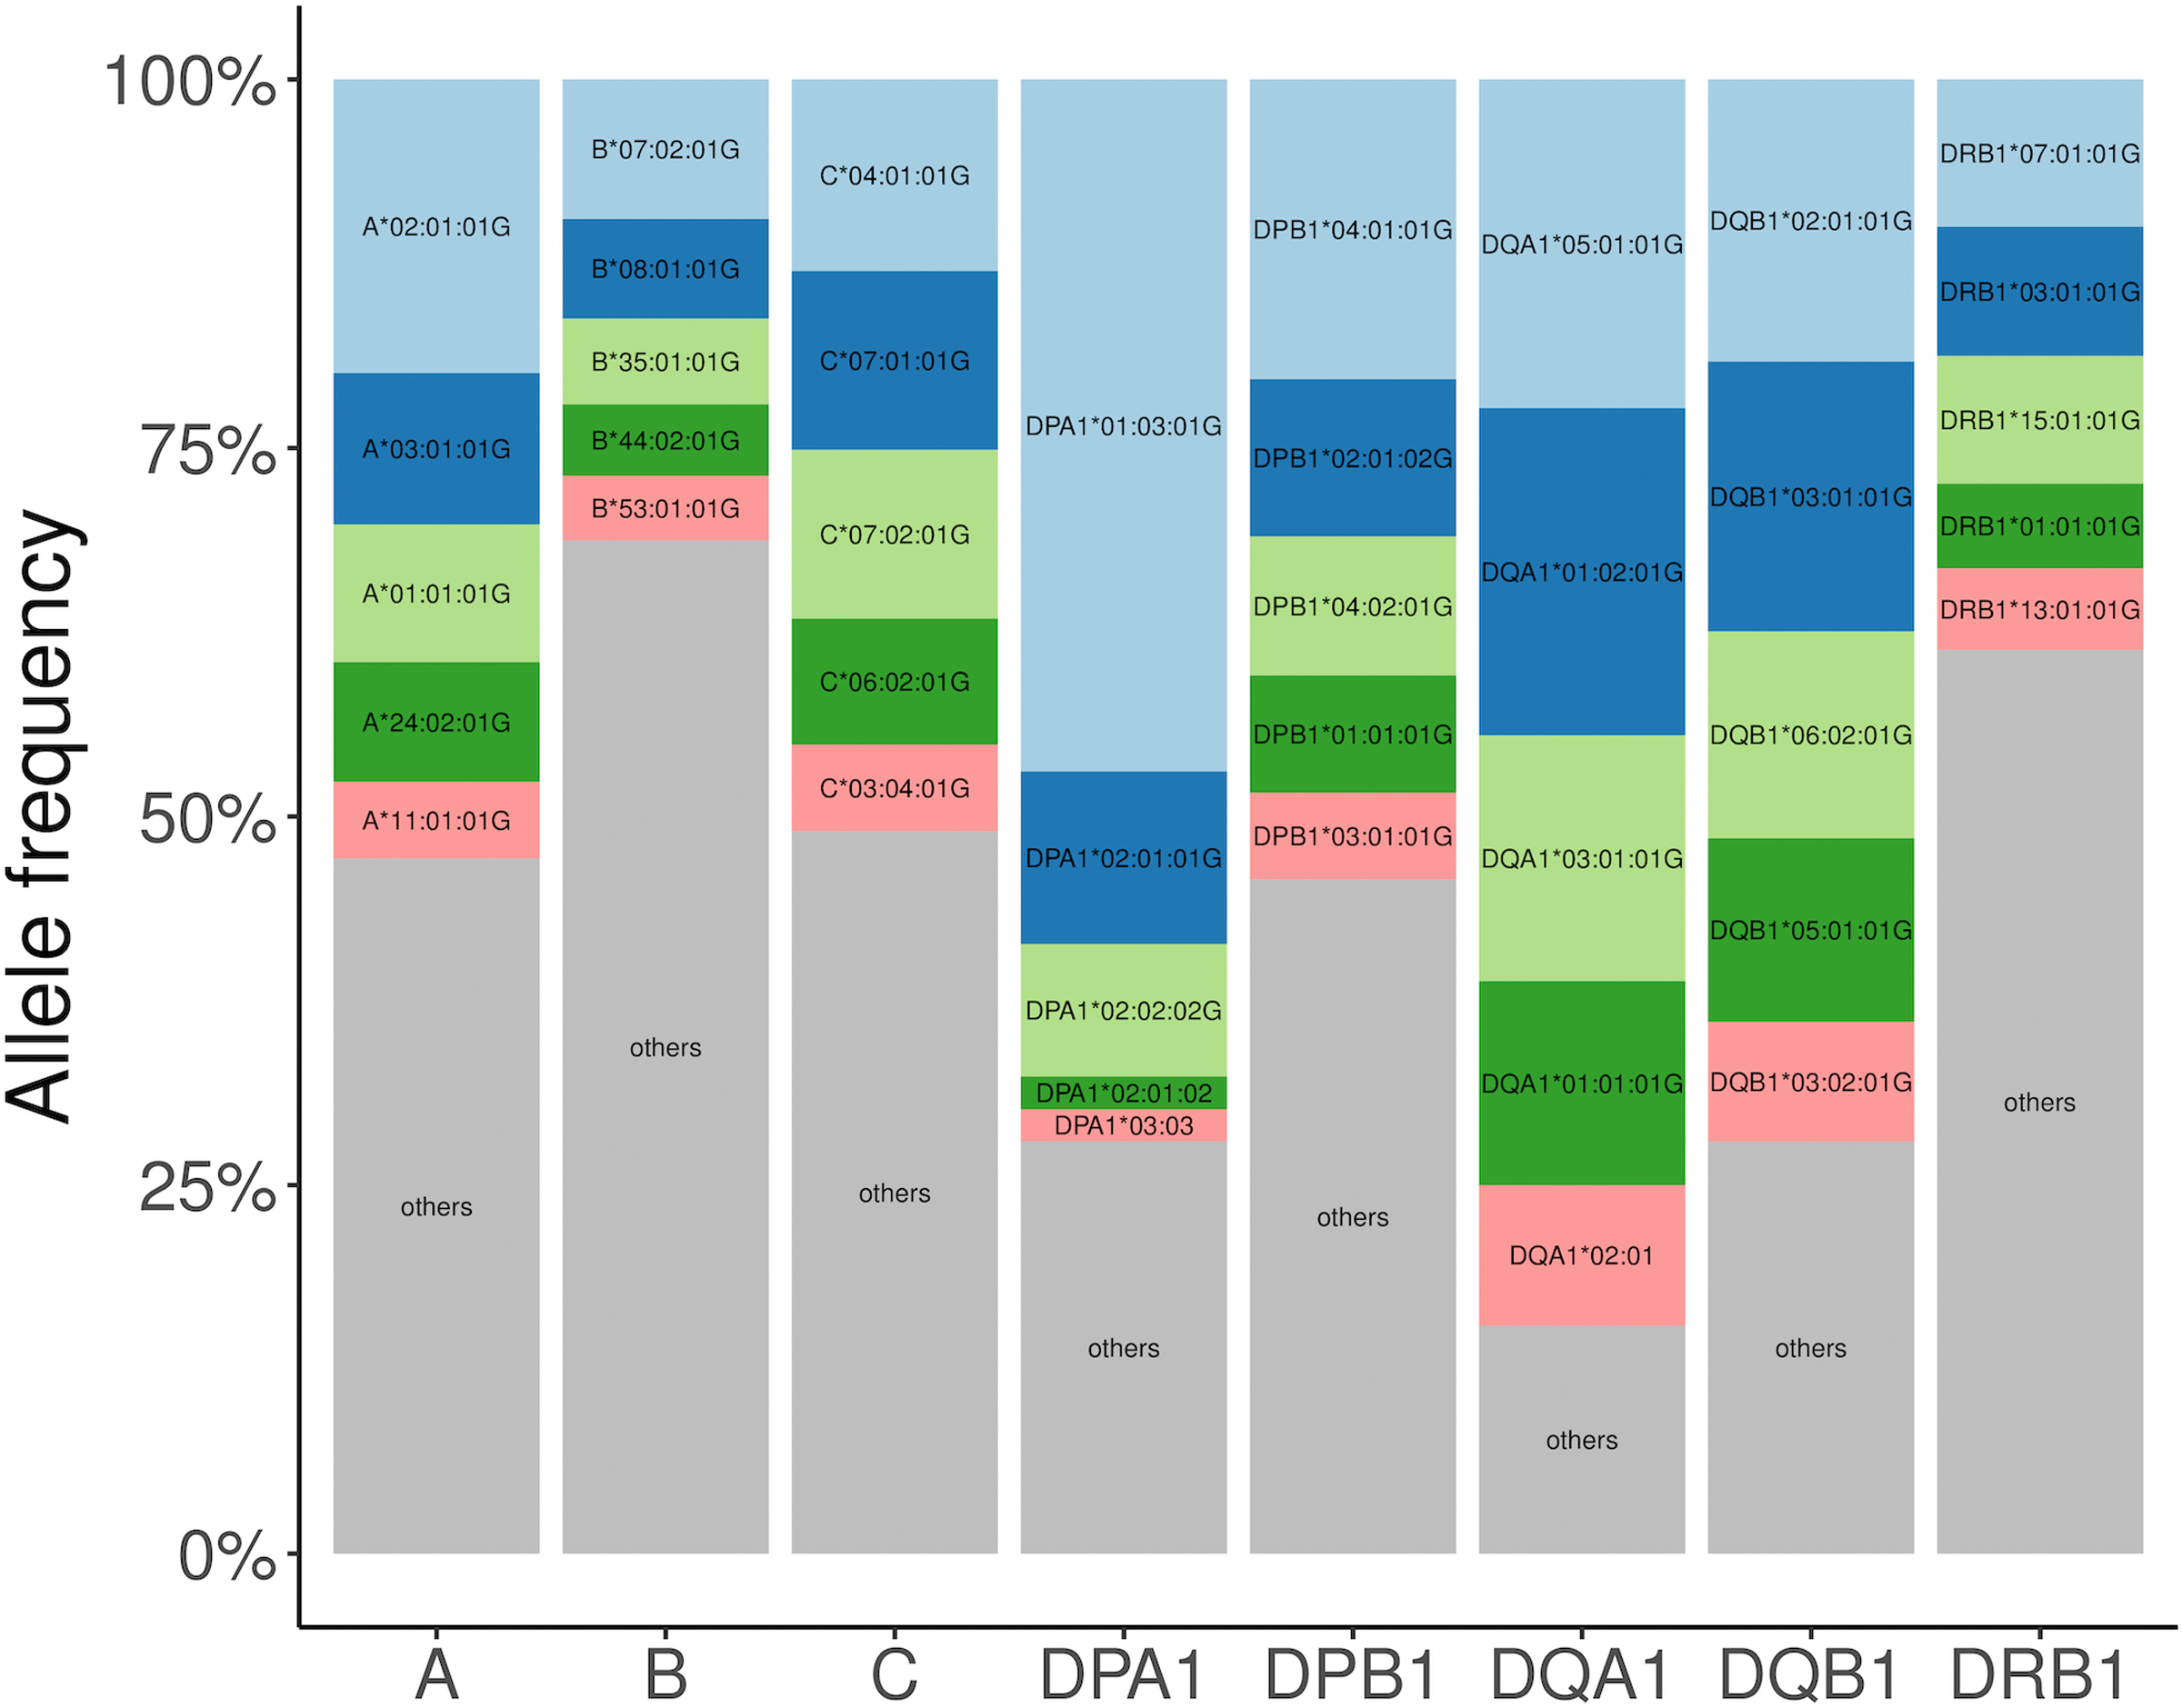
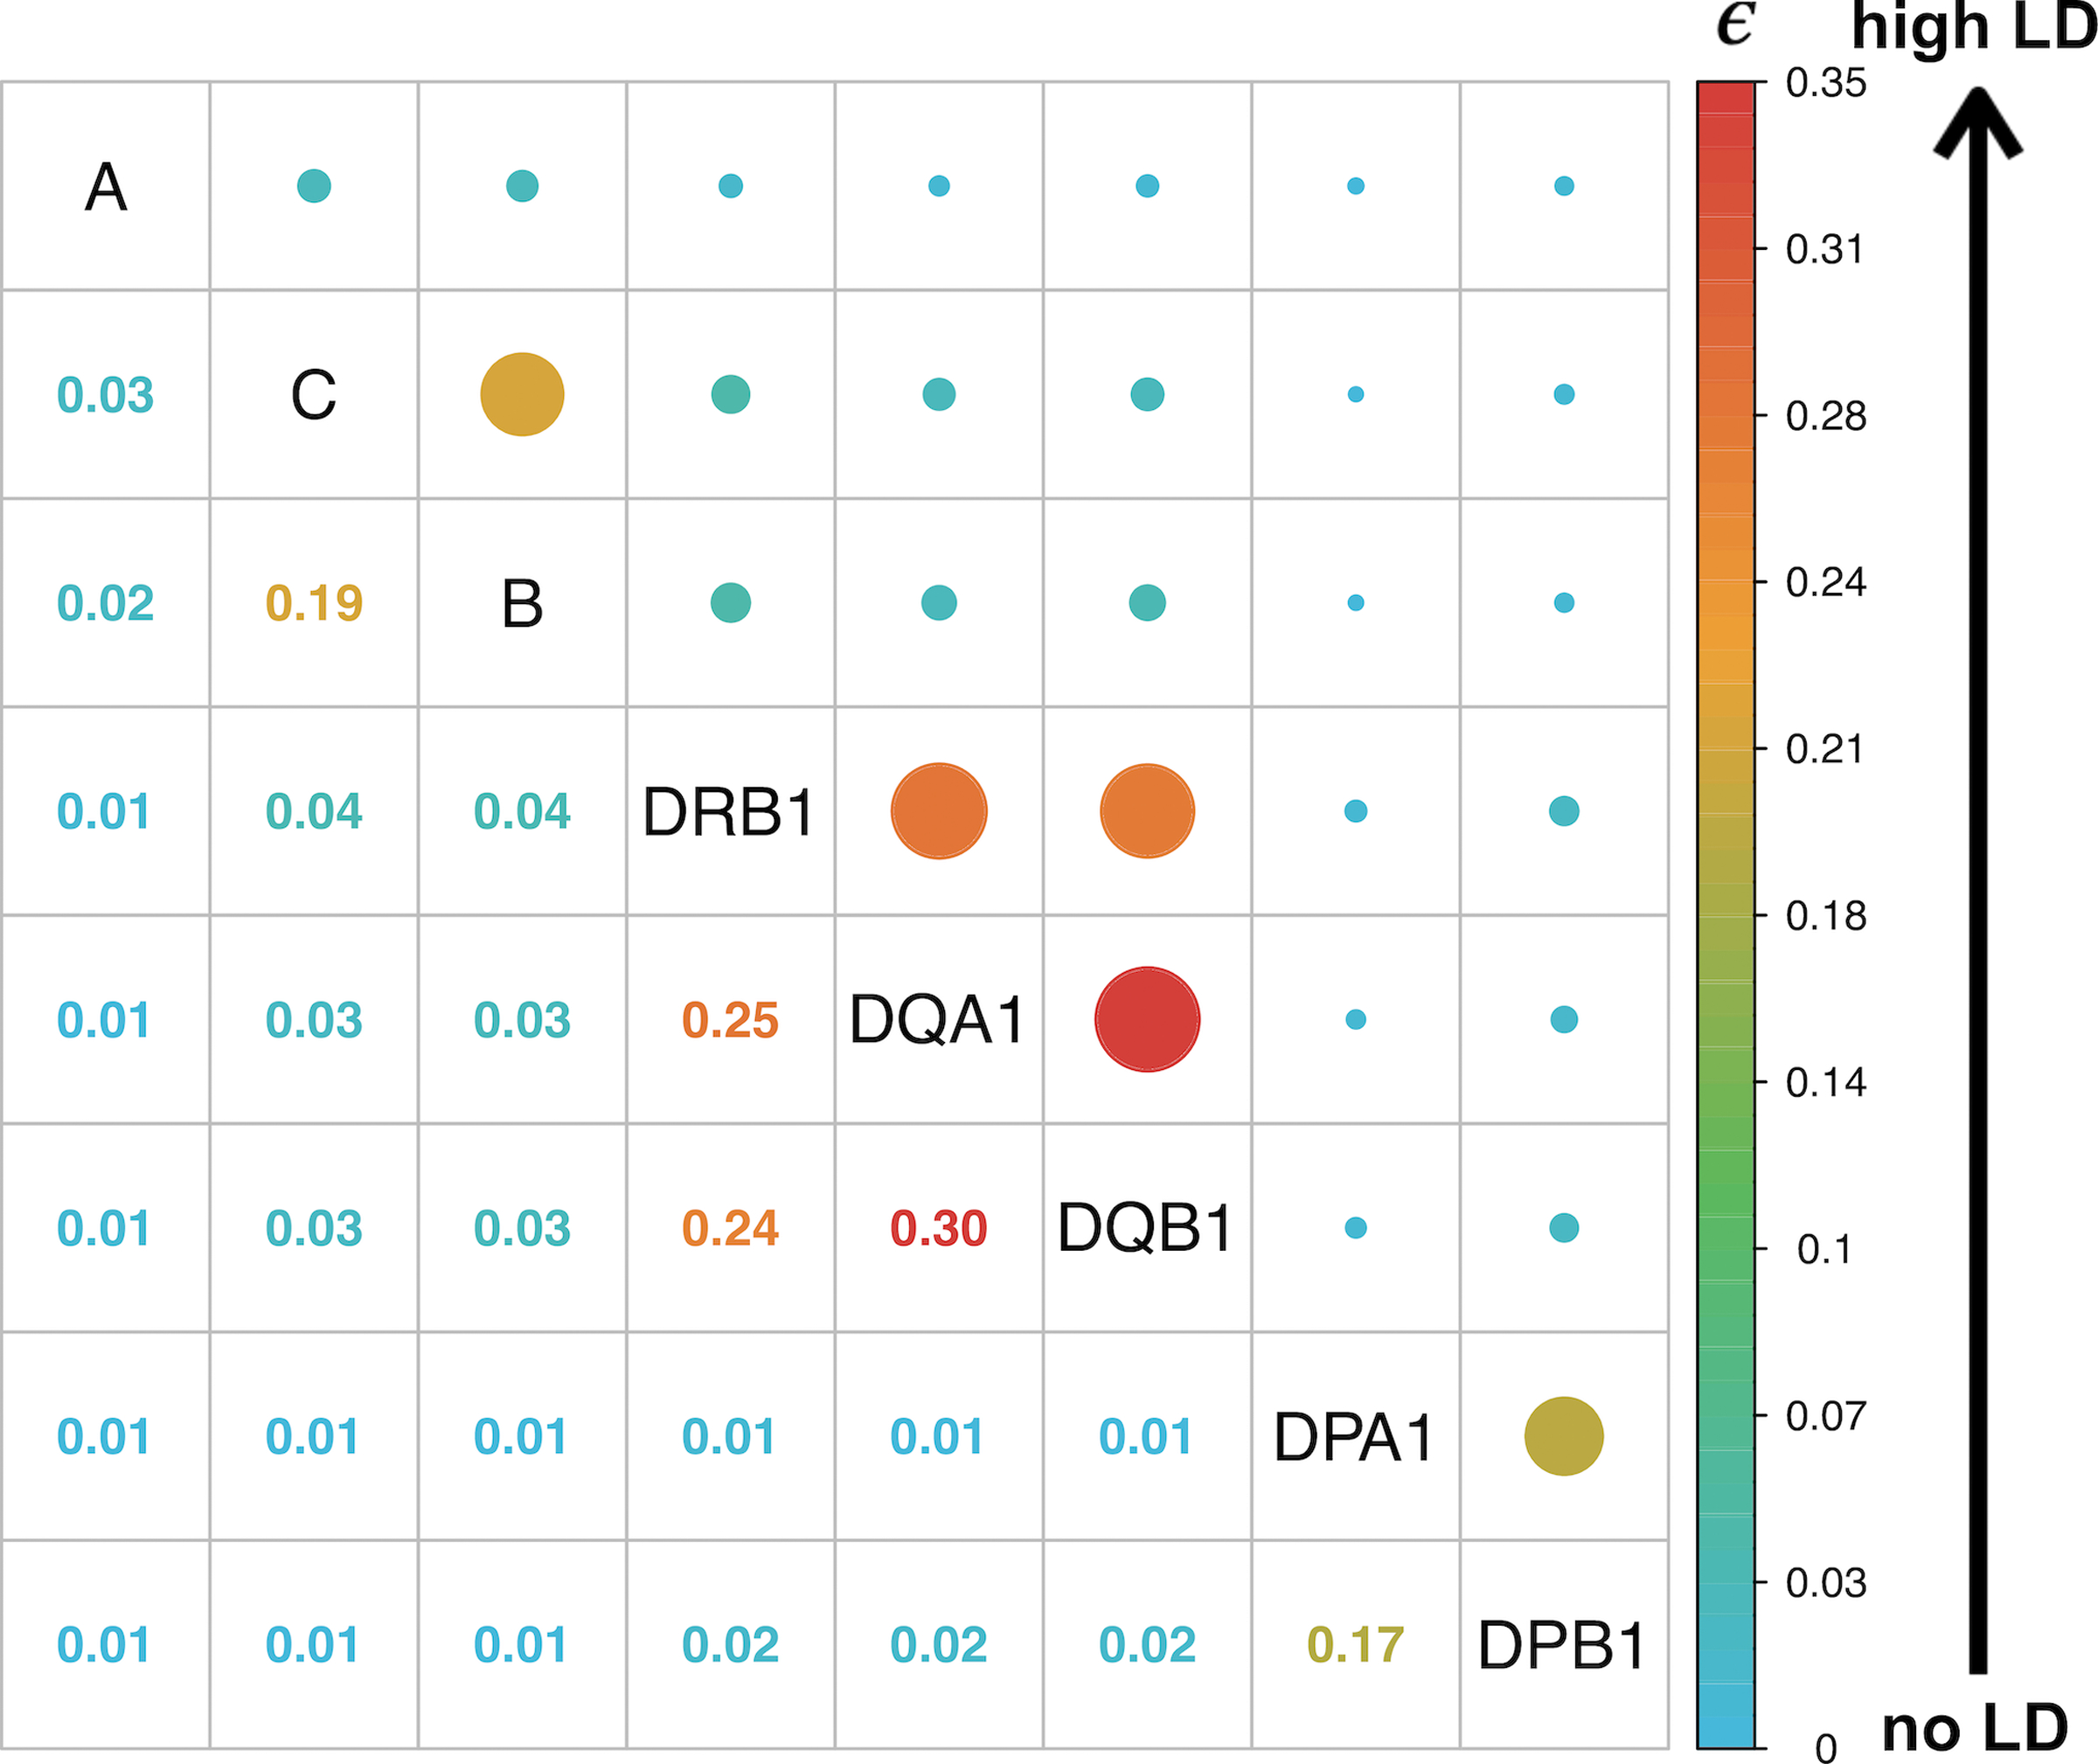
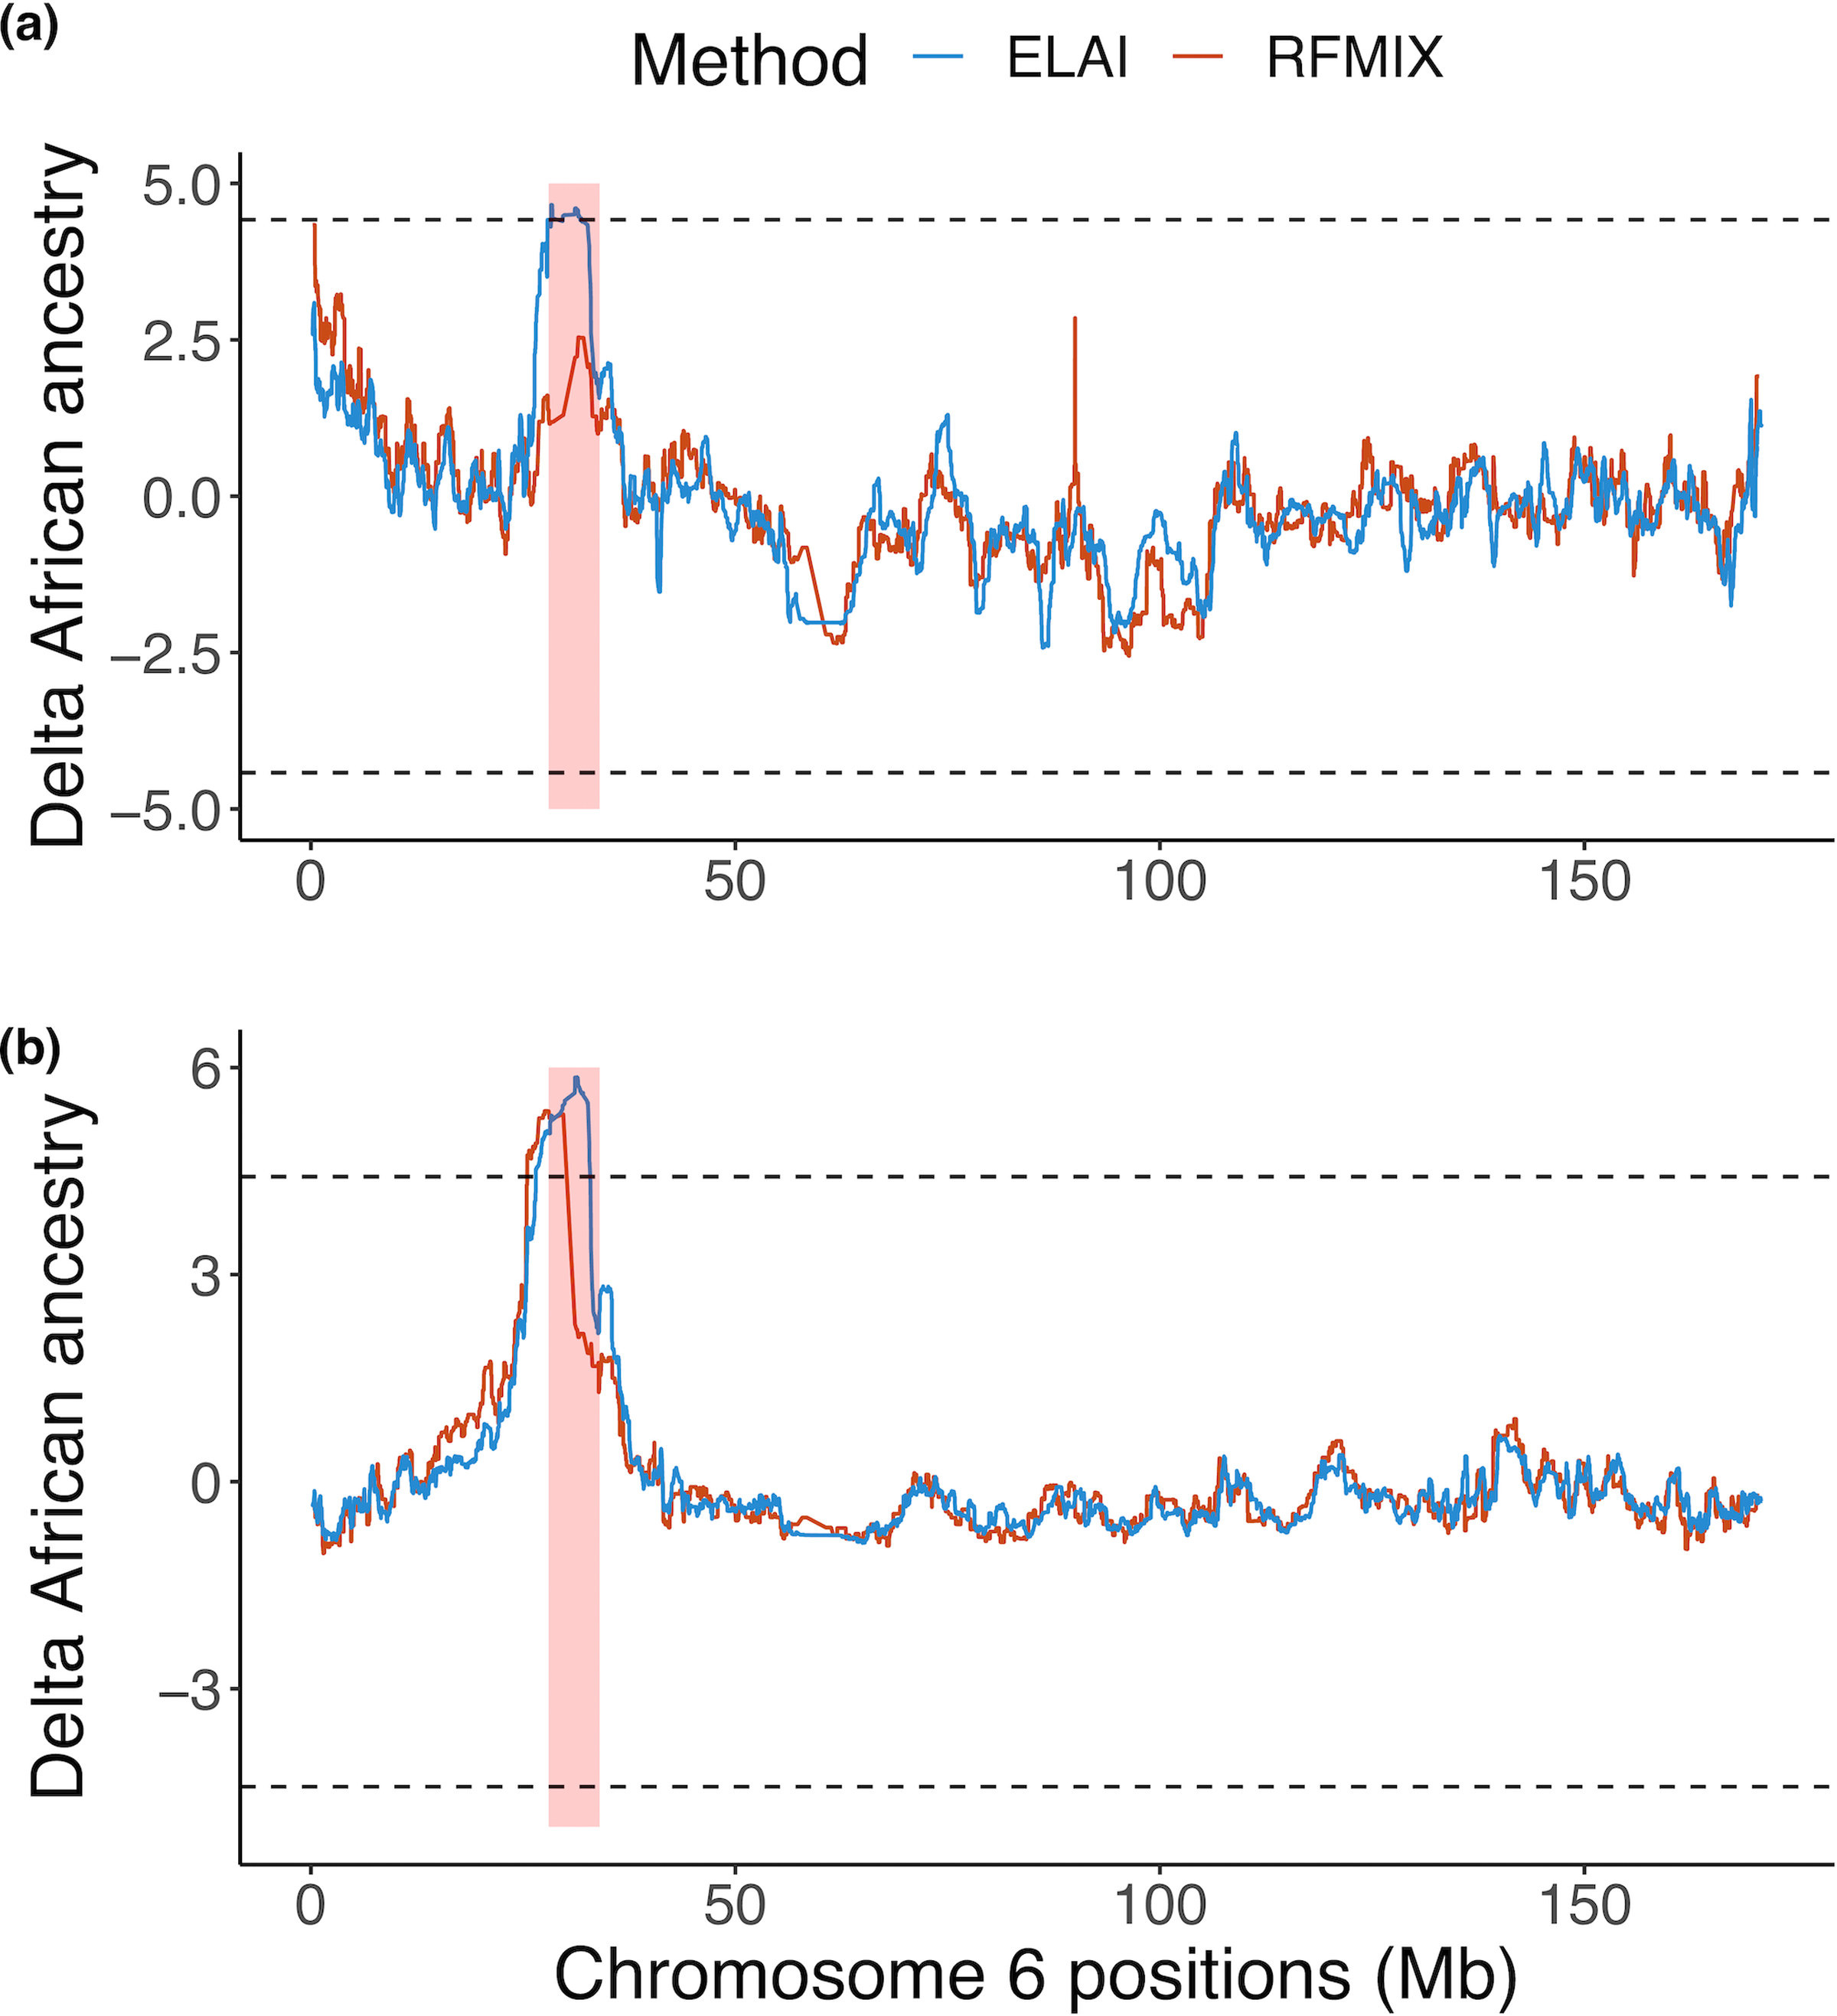
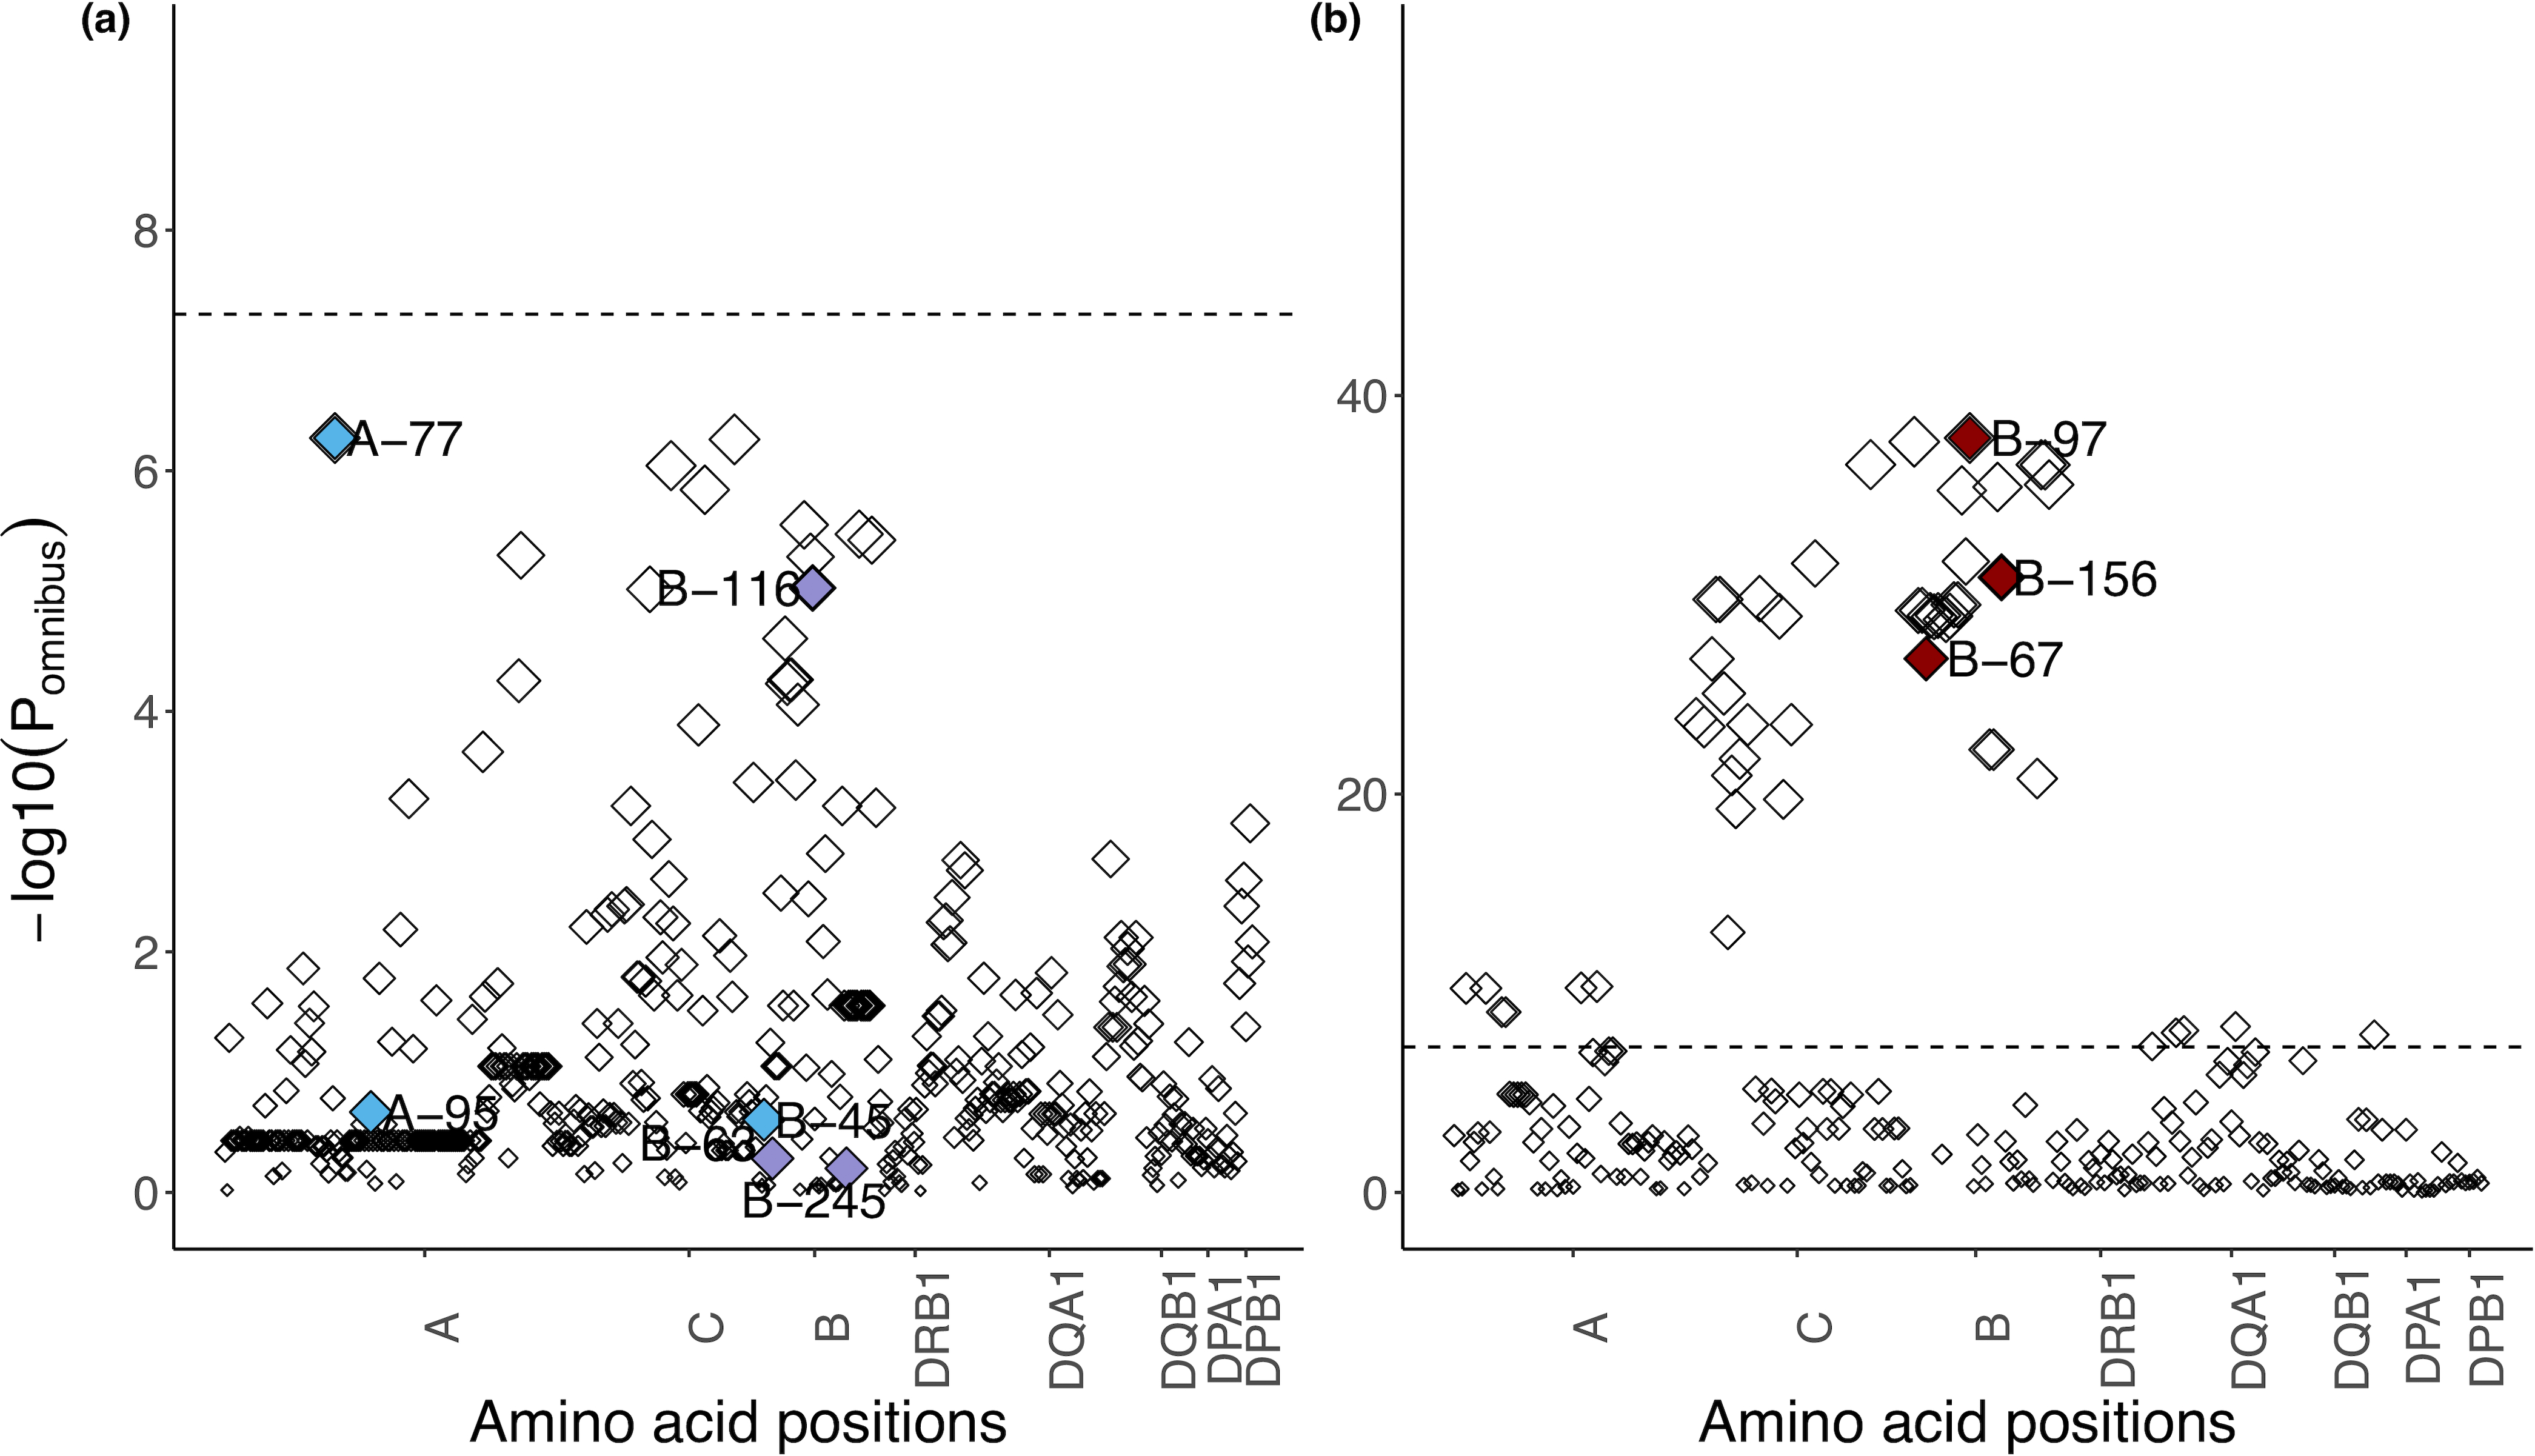
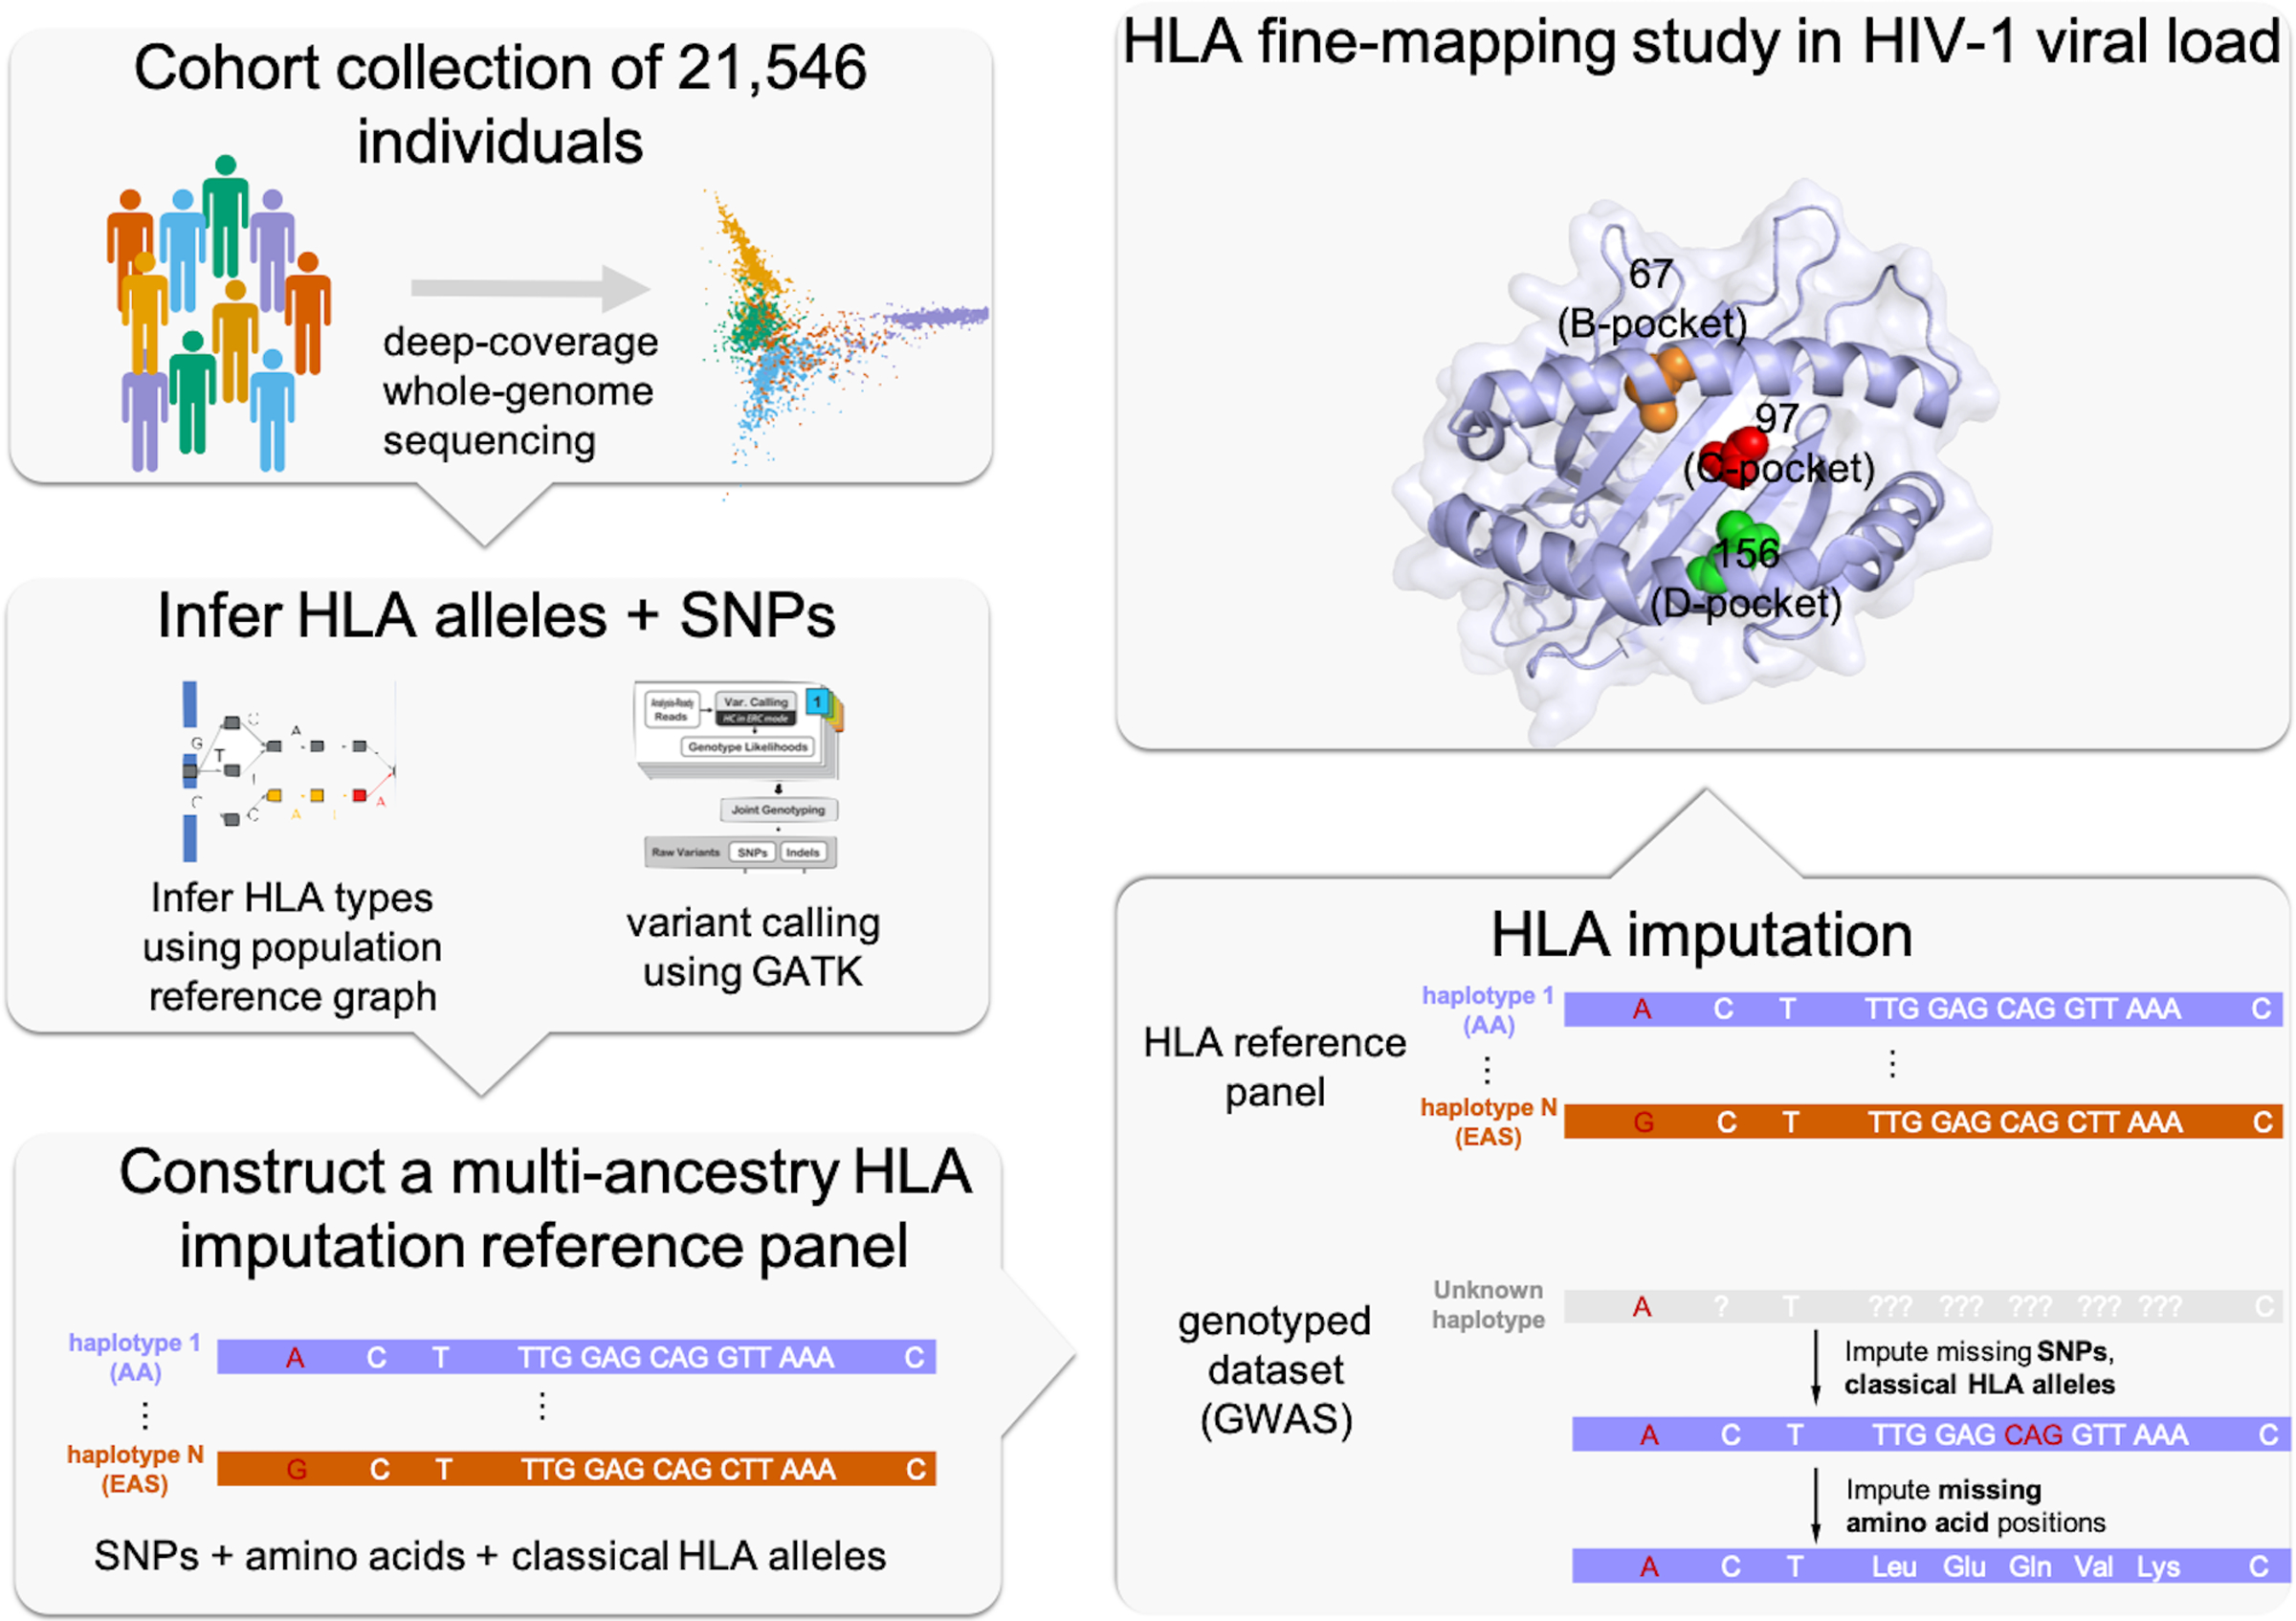
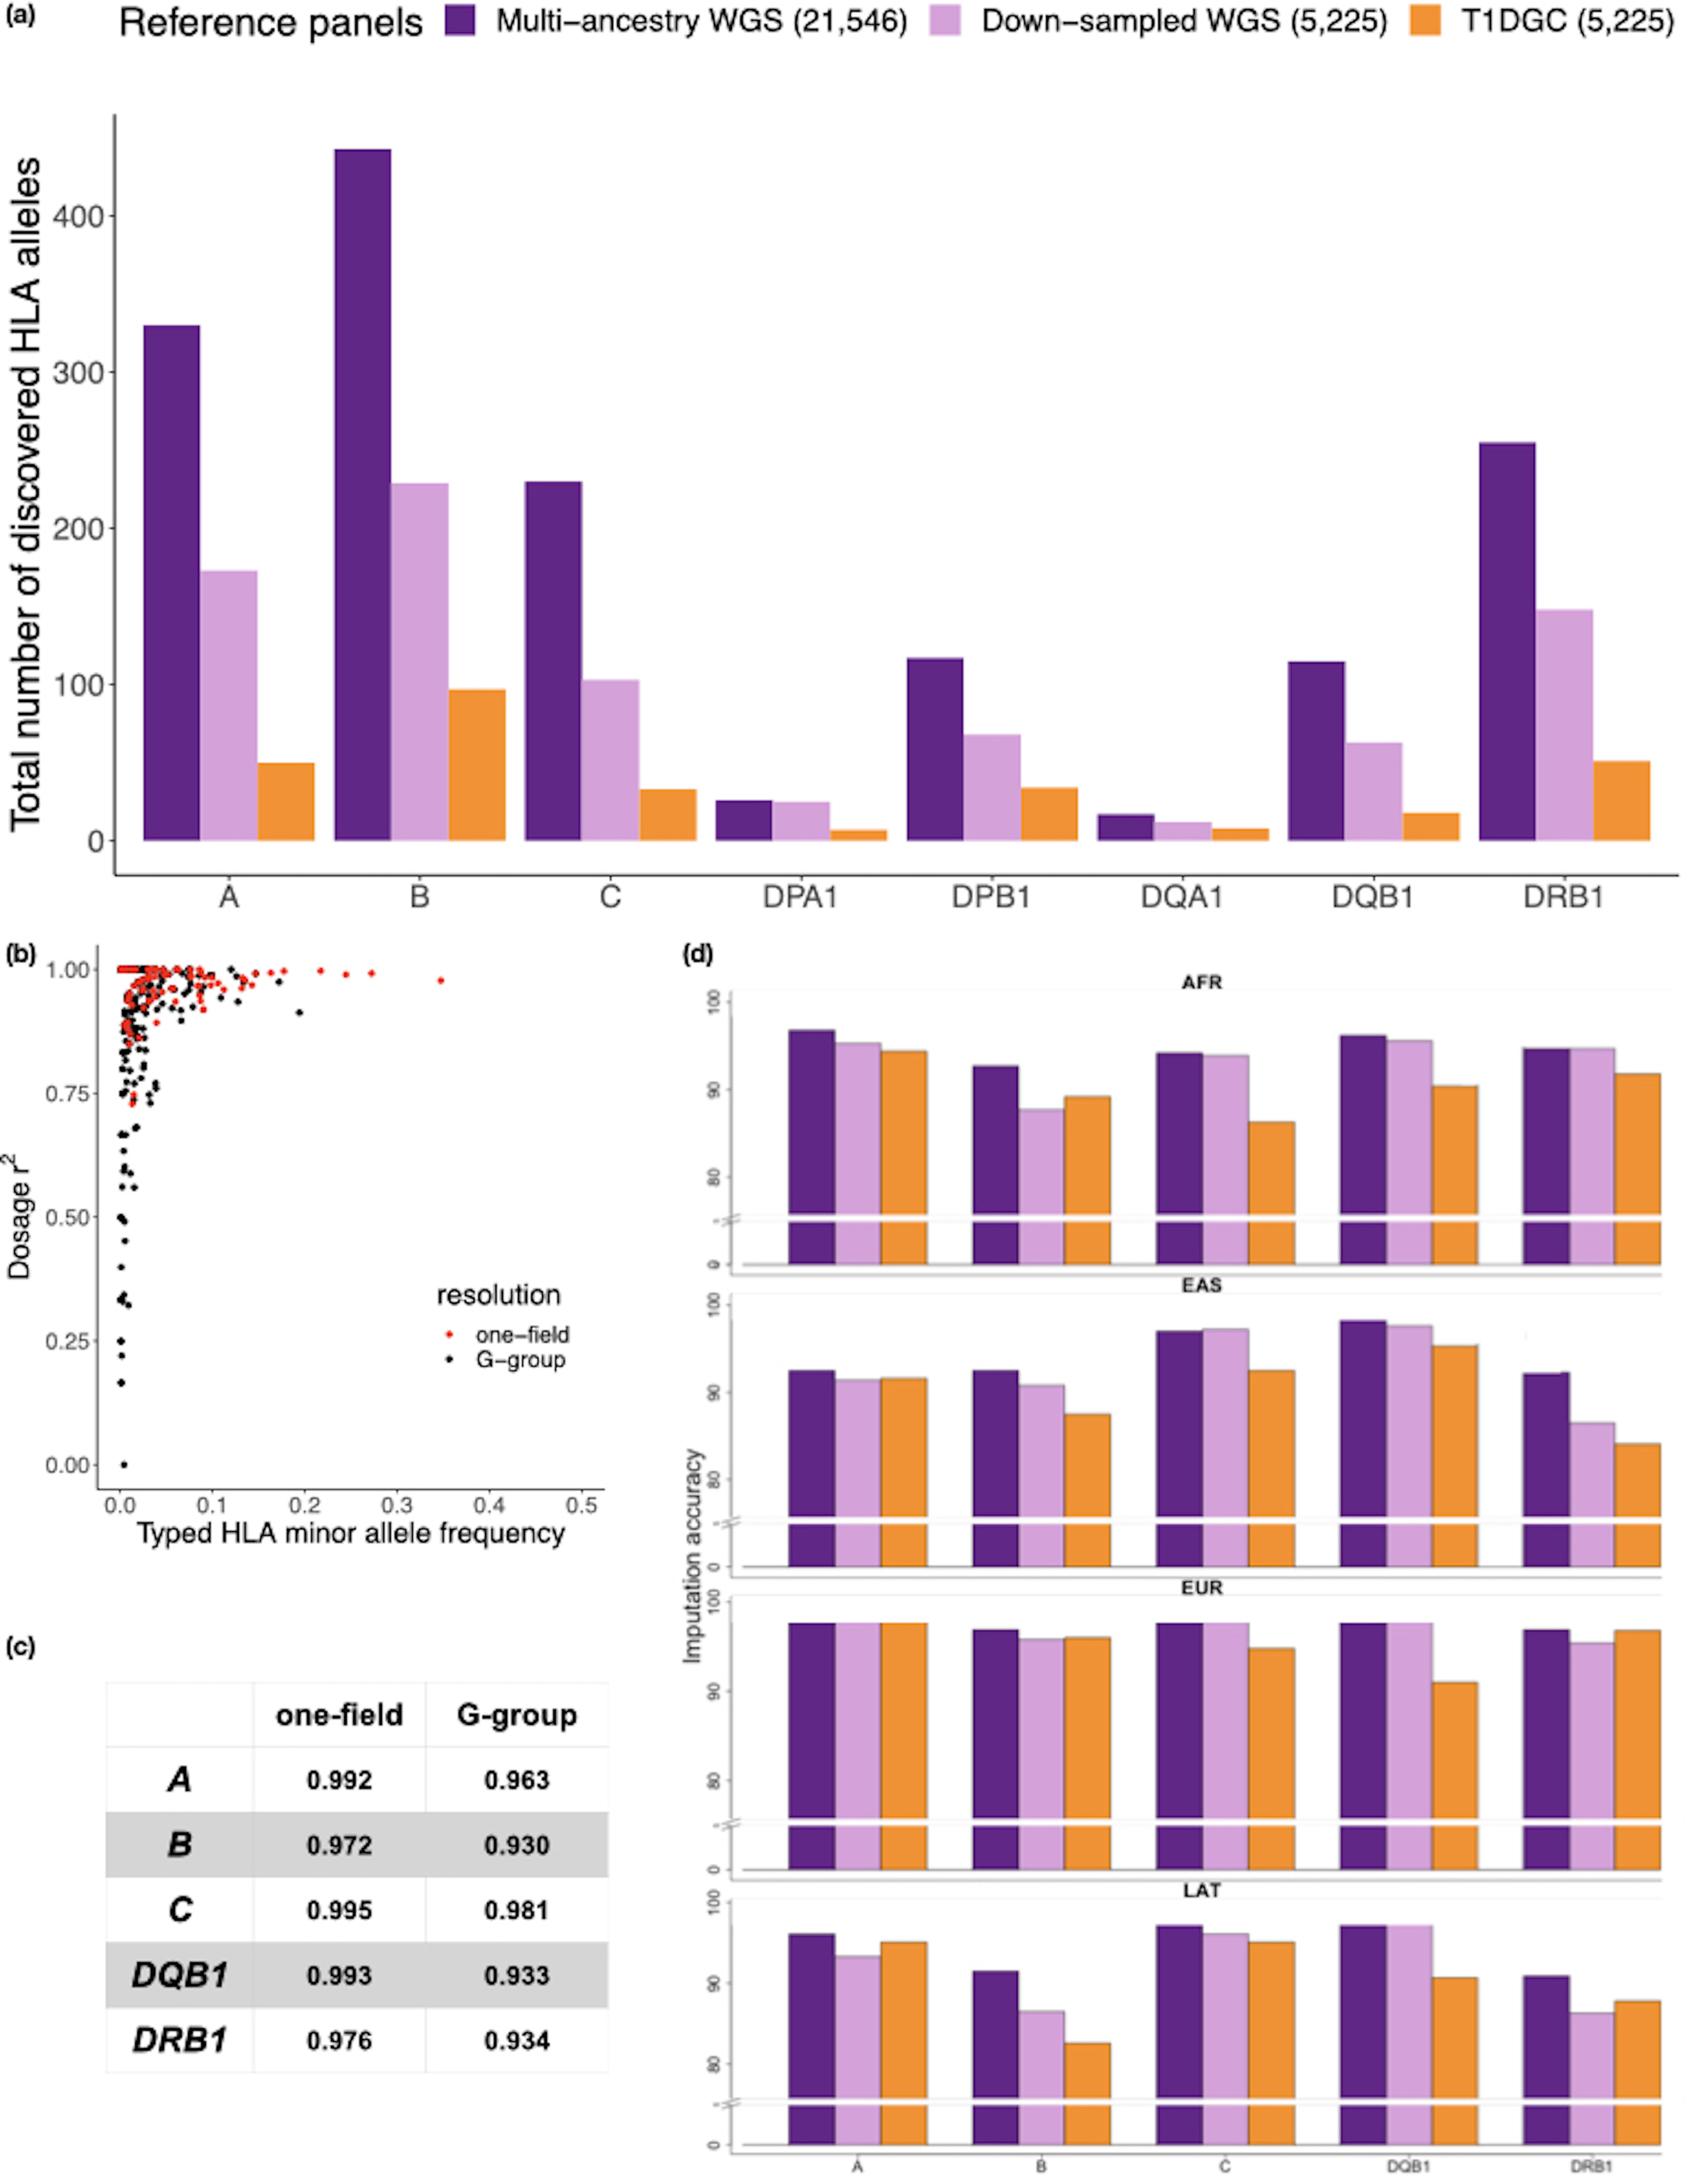
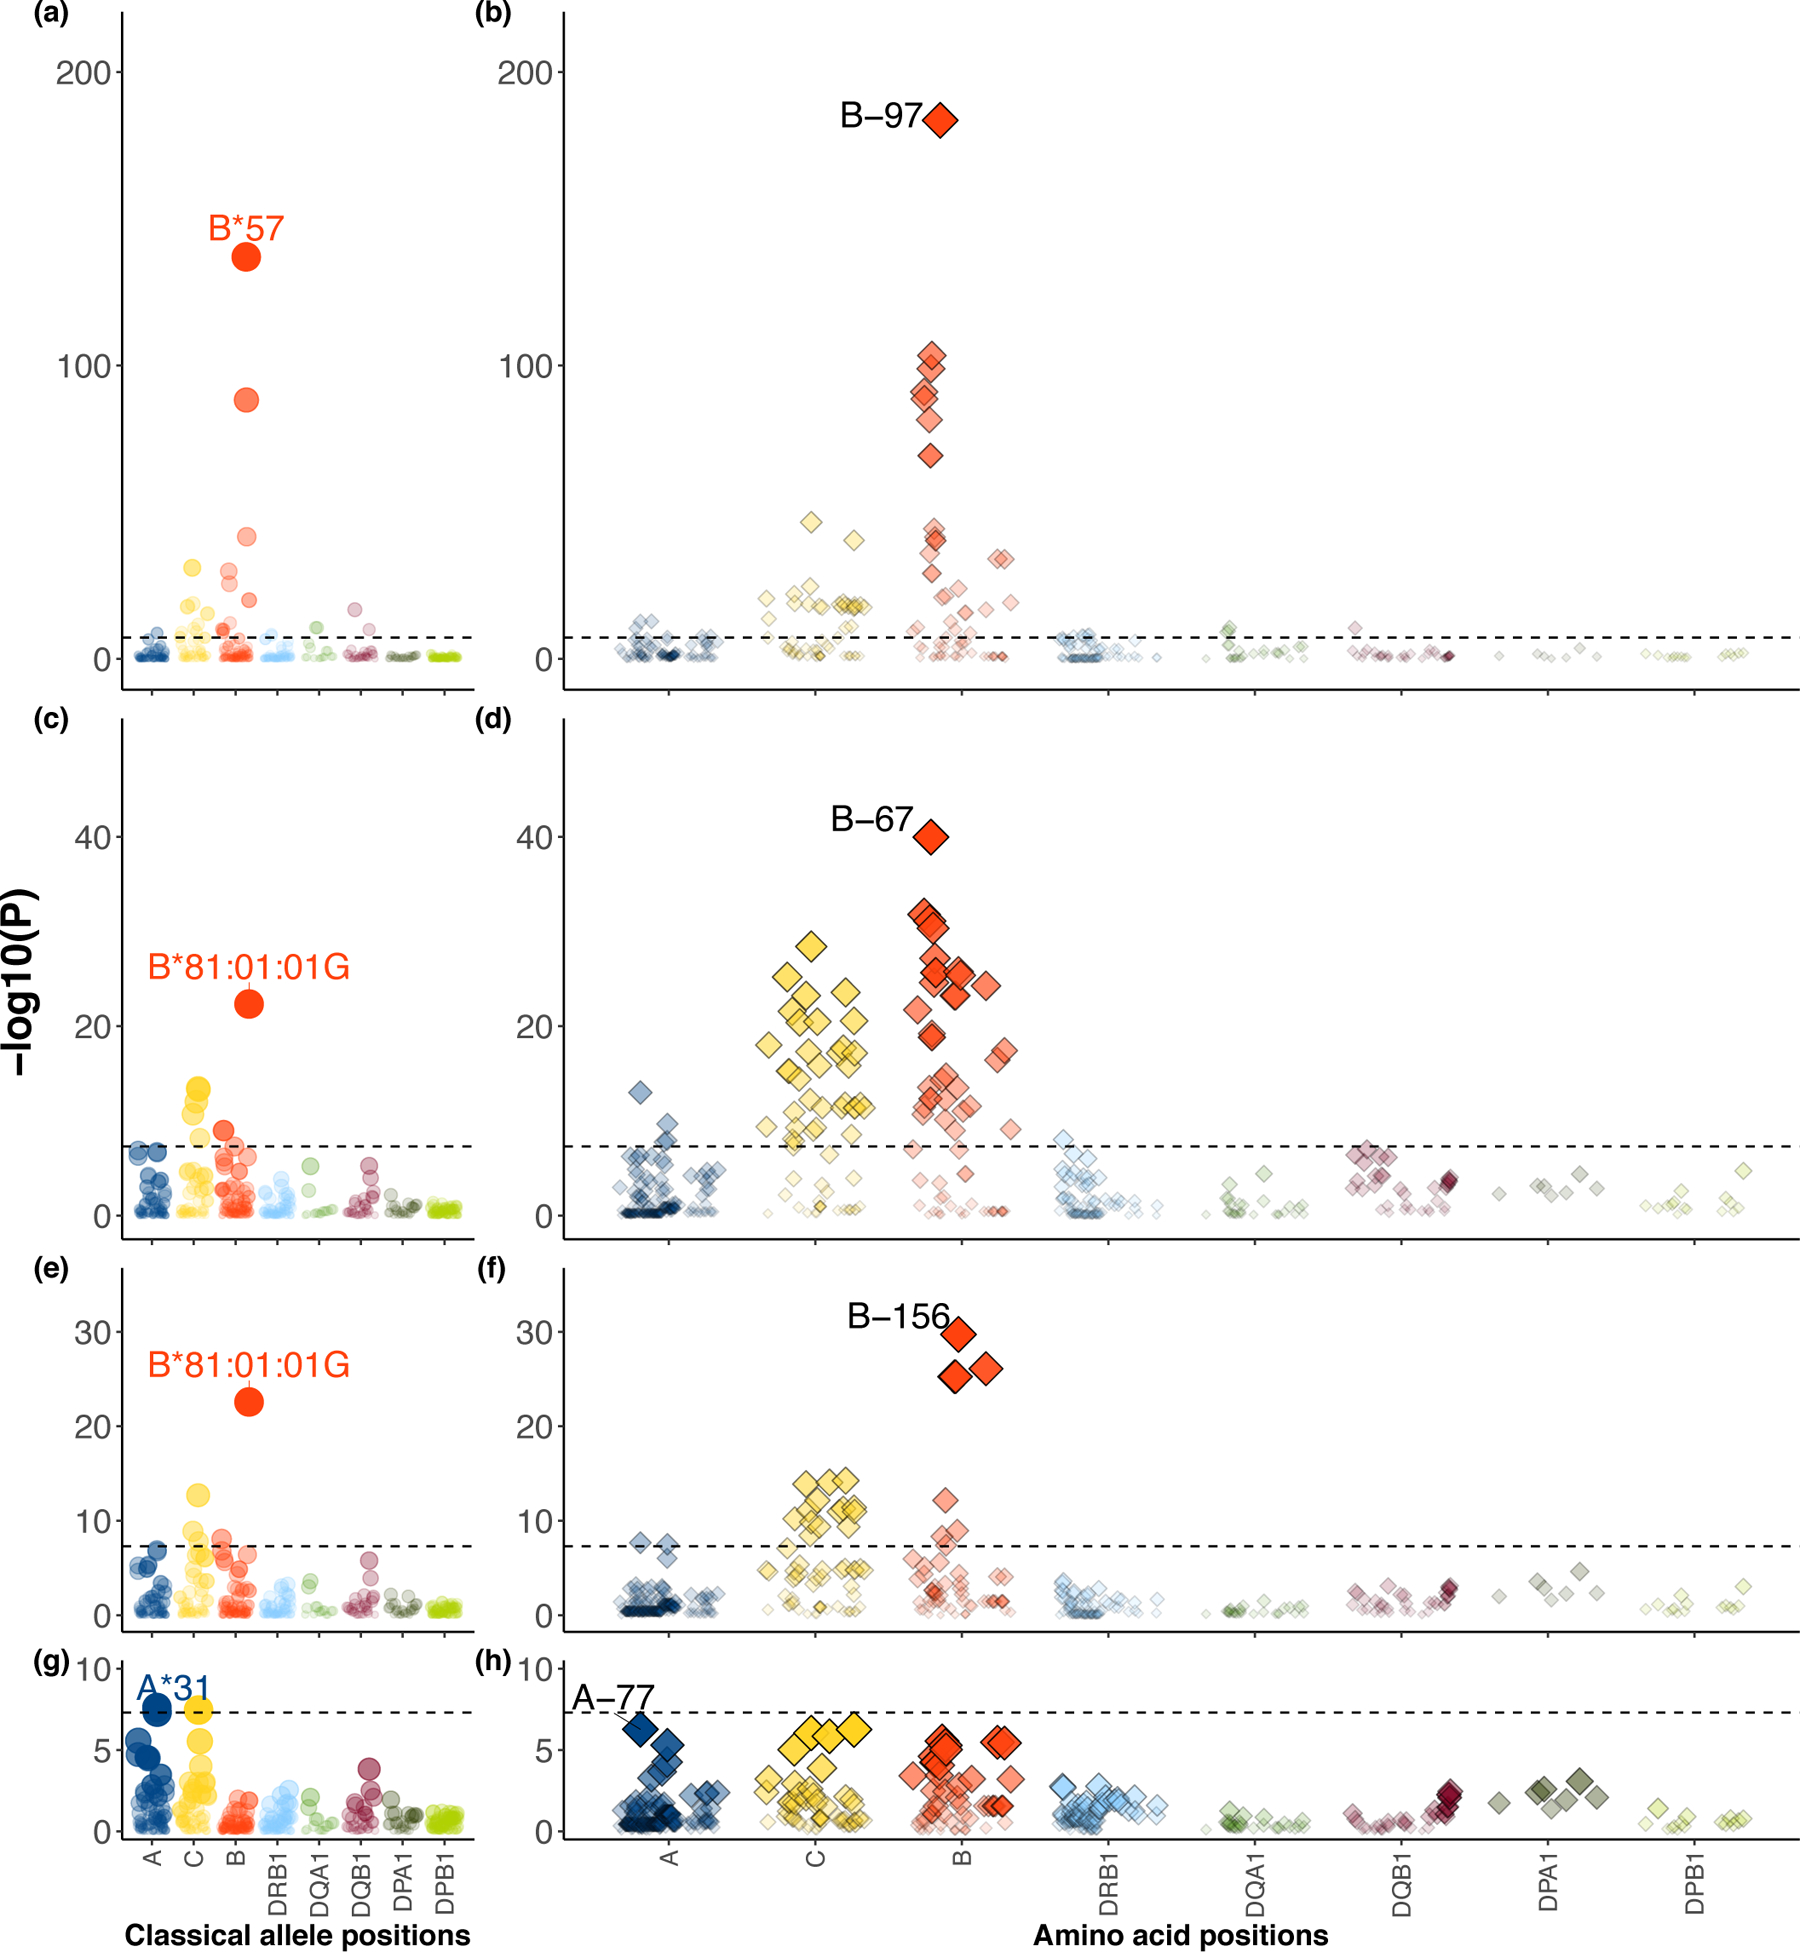
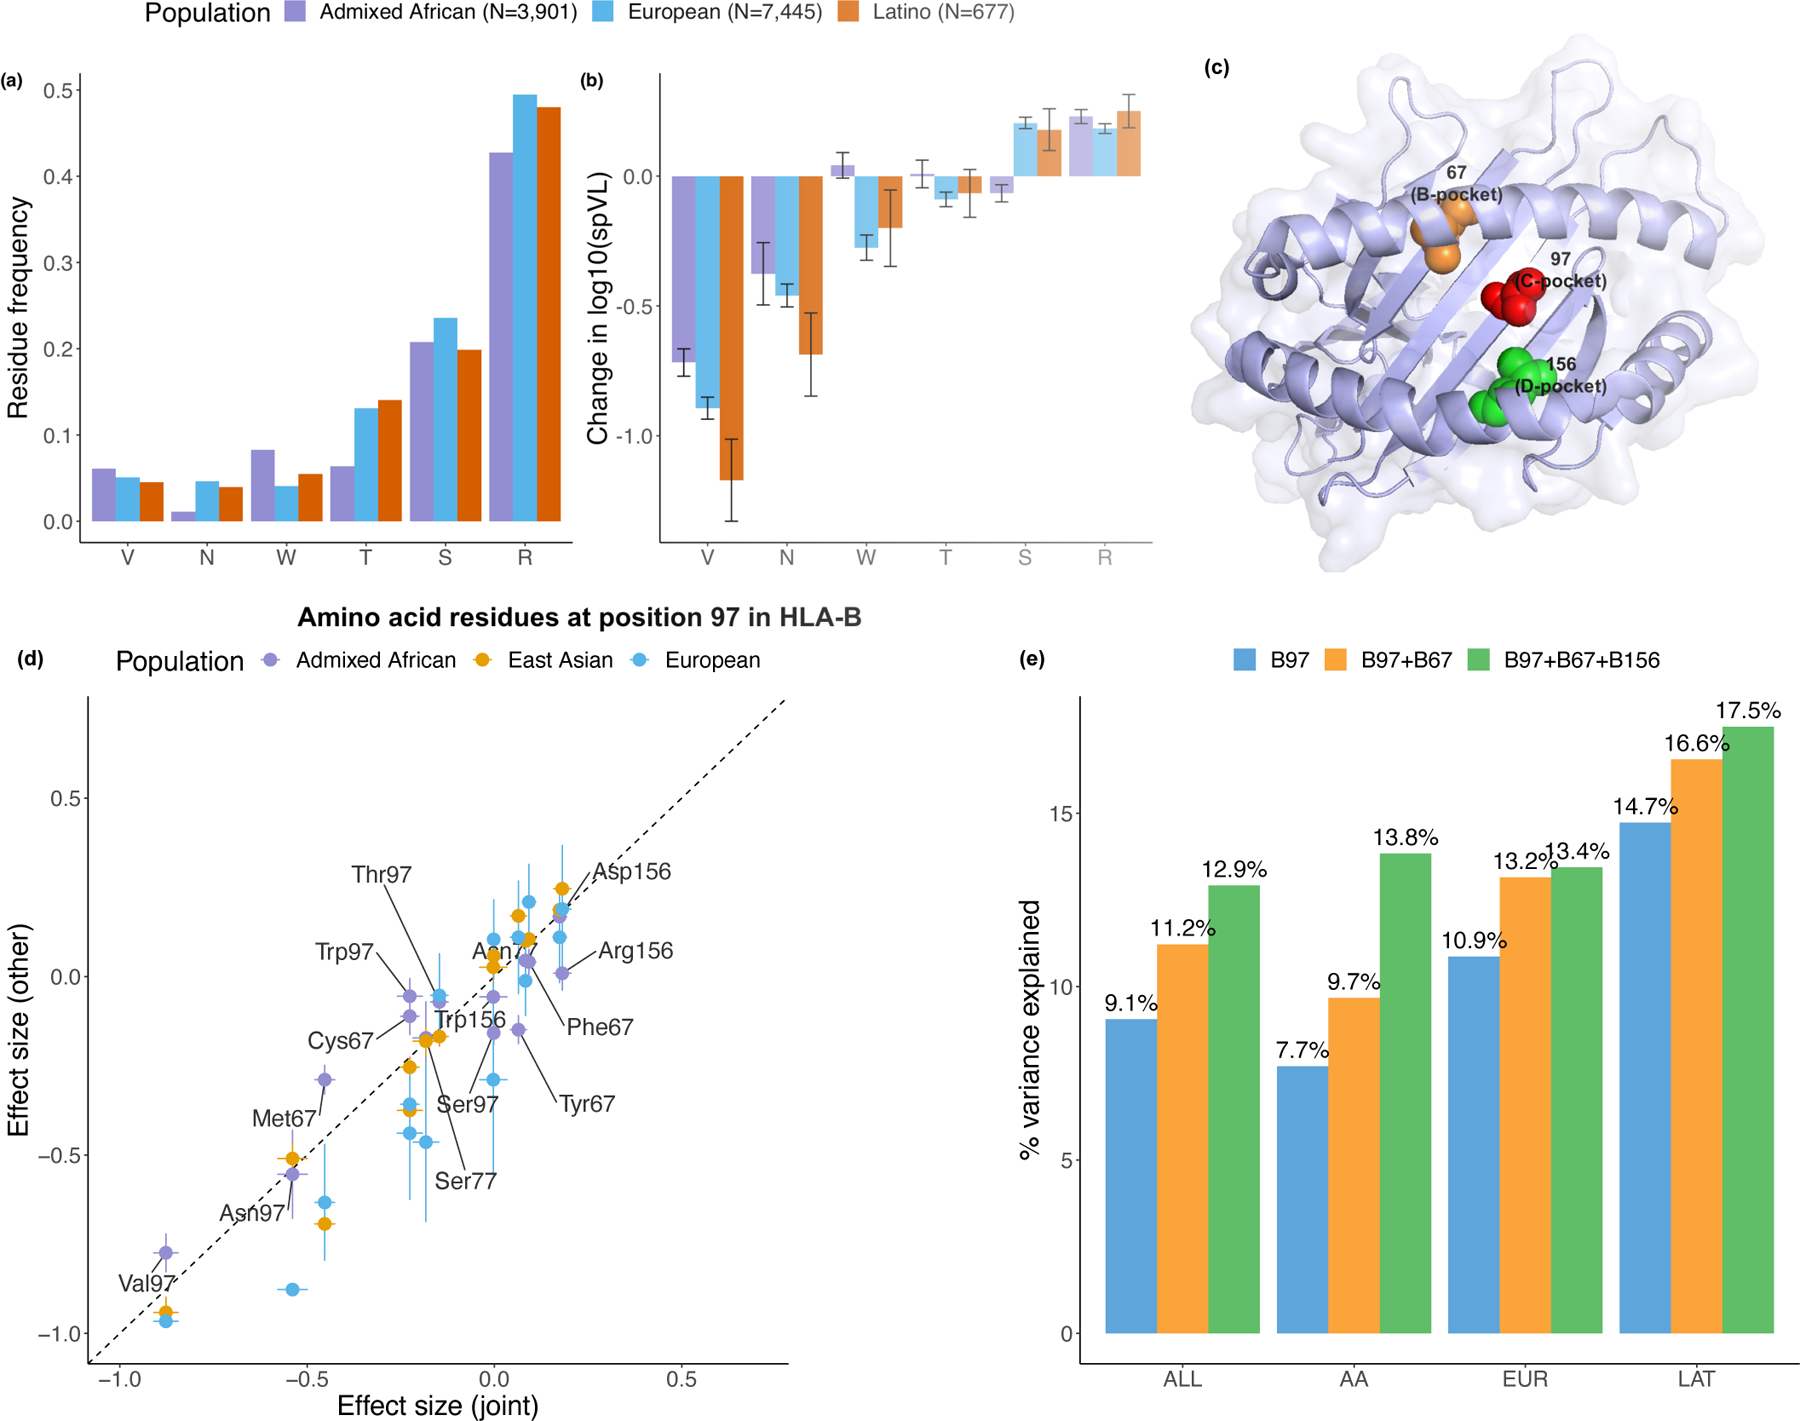
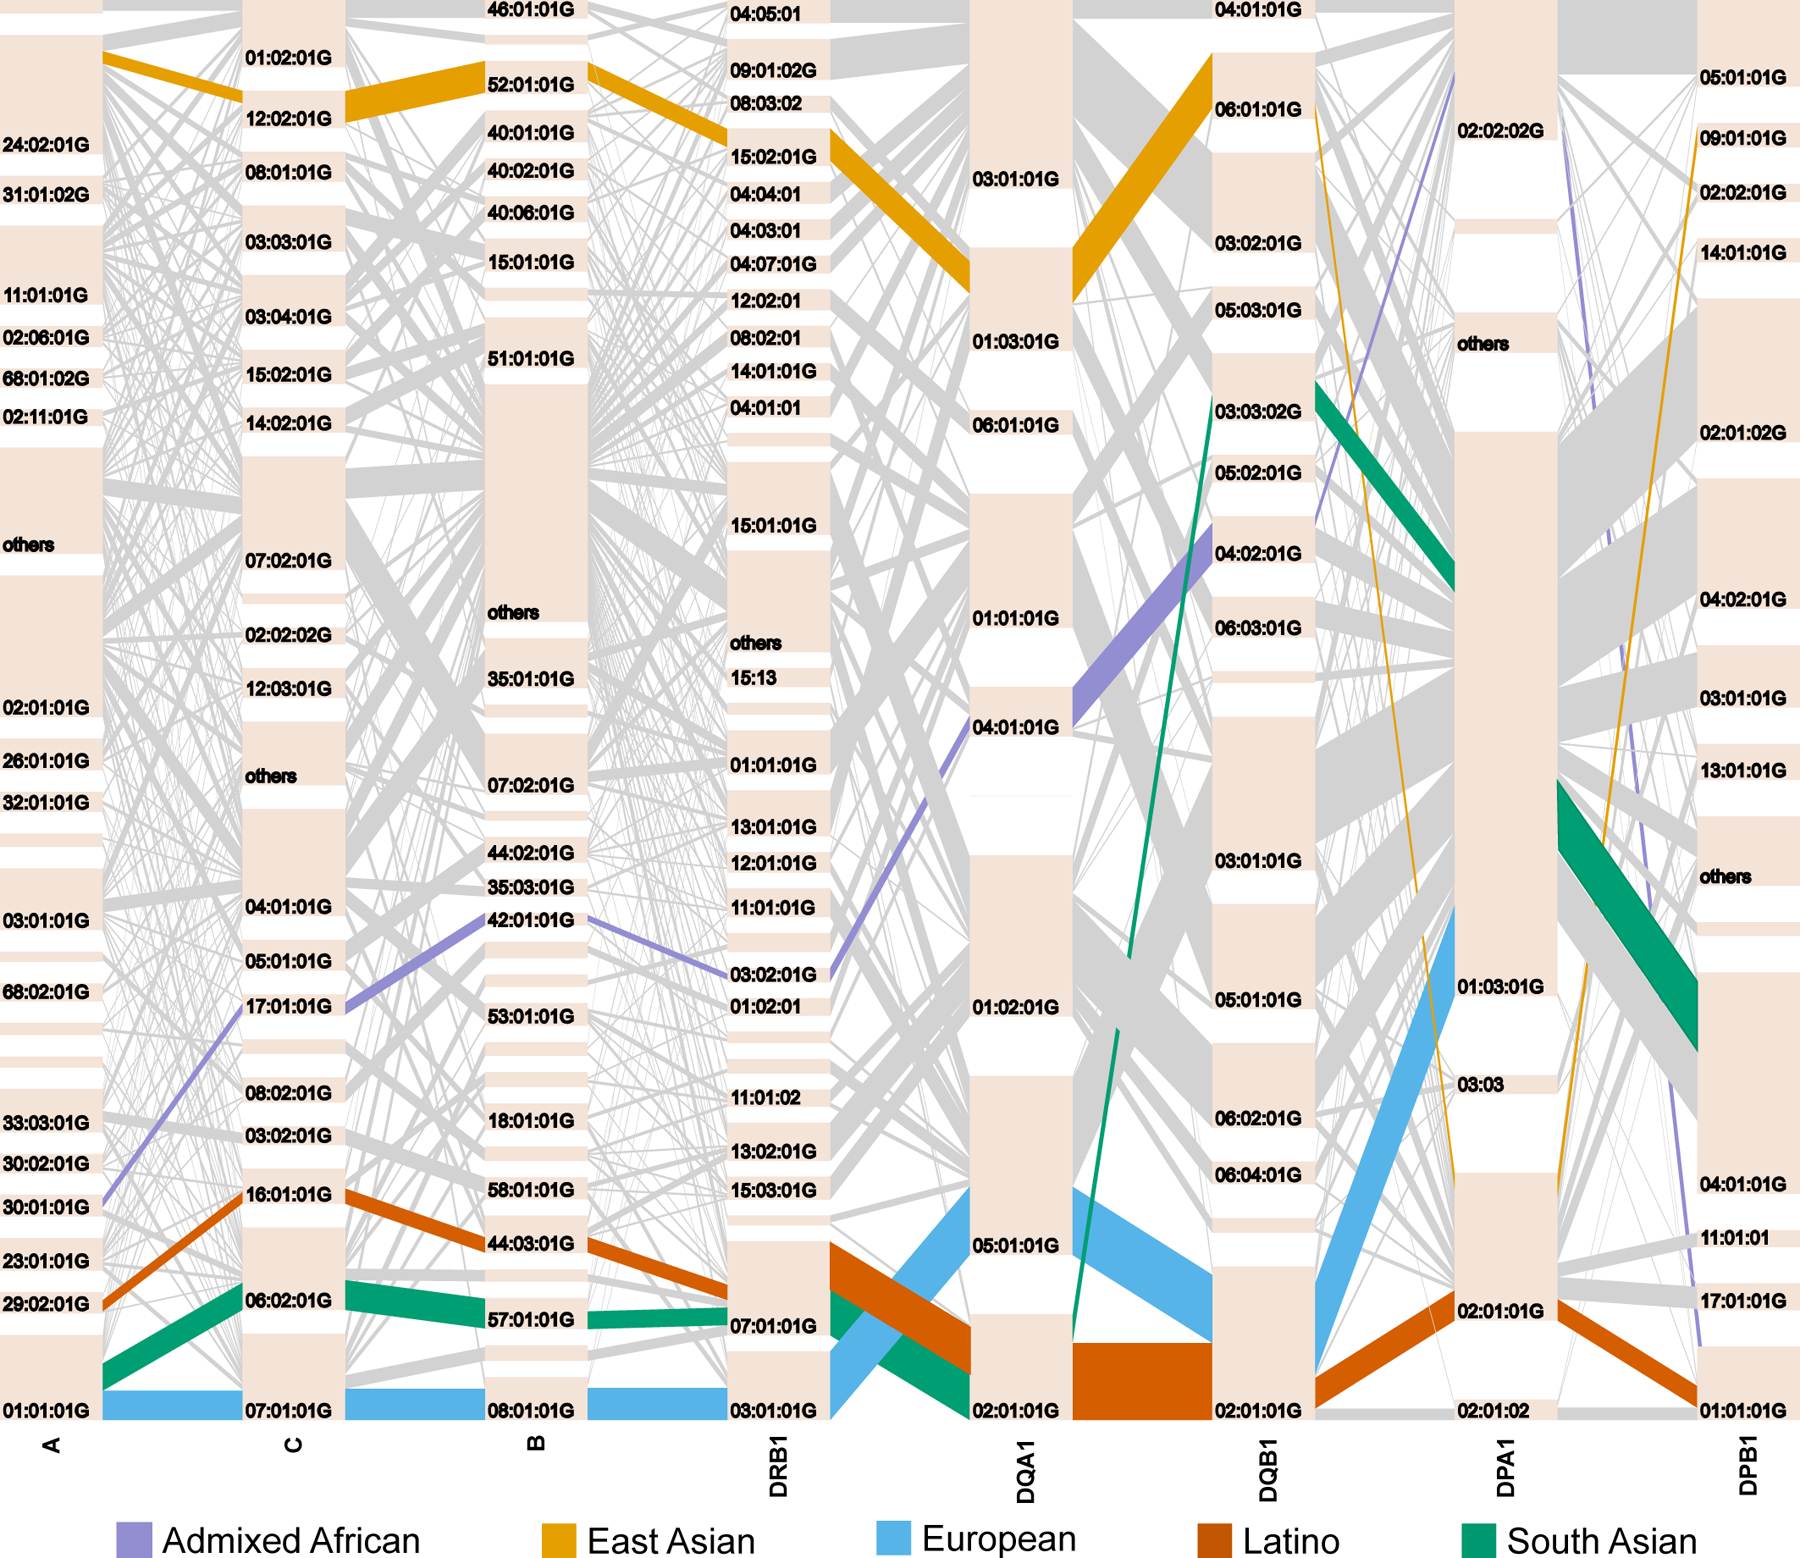
Fine-mapping to plausible causal variation may be more effective in multi-ancestry cohorts, particularly in the MHC, which has population-specific structure. To enable such studies, we constructed a large (n = 21,546) HLA reference panel spanning five global populations based on whole-genome sequences. Despite population-specific long-range haplotypes, we demonstrated accurate imputation at G-group resolution (94.2%, 93.7%, 97.8% and 93.7% in admixed African (AA), East Asian (EAS), European (EUR) and Latino (LAT) populations). Applying HLA imputation to genome-wide association study data for HIV-1 viral load in three populations (EUR, AA and LAT), we obviated effects of previously reported associations from population-specific HIV studies and discovered a novel association at position 156 in HLA-B. We pinpointed the MHC association to three amino acid positions (97, 67 and 156) marking three consecutive pockets (C, B and D) within the HLA-B peptide-binding groove, explaining 12.9% of trait variance.
© 2021. The Author(s), under exclusive licence to Springer Nature America, Inc.
Figures

References
Publication types
MeSH terms
Substances
Grants and funding
- R01 HL071259/HL/NHLBI NIH HHS/United States
- U01 AI069502/AI/NIAID NIH HHS/United States
- U01 AI069513/AI/NIAID NIH HHS/United States
- UM1 AI069494/AI/NIAID NIH HHS/United States
- UM1 AI069423/AI/NIAID NIH HHS/United States
- UM1 AI069503/AI/NIAID NIH HHS/United States
- UL1 RR033176/RR/NCRR NIH HHS/United States
- HHSN268201100011I/HL/NHLBI NIH HHS/United States
- 75N92020D00002/HL/NHLBI NIH HHS/United States
- U01 AI069474/AI/NIAID NIH HHS/United States
- HHSN268201500003C/HL/NHLBI NIH HHS/United States
- UL1 TR000445/TR/NCATS NIH HHS/United States
- U01 AI069434/AI/NIAID NIH HHS/United States
- U01 AI069447/AI/NIAID NIH HHS/United States
- UM1 AI069501/AI/NIAID NIH HHS/United States
- UM1 AI069472/AI/NIAID NIH HHS/United States
- U01 AI069467/AI/NIAID NIH HHS/United States
- P30 AI050409/AI/NIAID NIH HHS/United States
- U01 AI069423/AI/NIAID NIH HHS/United States
- UM1 AI069513/AI/NIAID NIH HHS/United States
- HHSN268201800012I/HB/NHLBI NIH HHS/United States
- UL1 TR001111/TR/NCATS NIH HHS/United States
- U01 AI069412/AI/NIAID NIH HHS/United States
- N01 HC095161/HL/NHLBI NIH HHS/United States
- 75N92020D00005/HL/NHLBI NIH HHS/United States
- P30 ES010126/ES/NIEHS NIH HHS/United States
- HHSN268201800012C/HL/NHLBI NIH HHS/United States
- U01 AI069496/AI/NIAID NIH HHS/United States
- M01 RR000046/RR/NCRR NIH HHS/United States
- N01 HC095168/HL/NHLBI NIH HHS/United States
- R01 HL071251/HL/NHLBI NIH HHS/United States
- U01 AI027661/AI/NIAID NIH HHS/United States
- R01 HL120393/HL/NHLBI NIH HHS/United States
- UM1 AI069424/AI/NIAID NIH HHS/United States
- U01 DK062413/DK/NIDDK NIH HHS/United States
- R01 AI077505/AI/NIAID NIH HHS/United States
- K01 AG059898/AG/NIA NIH HHS/United States
- UL1 TR001079/TR/NCATS NIH HHS/United States
- U01 AI069465/AI/NIAID NIH HHS/United States
- N01 HC095169/HL/NHLBI NIH HHS/United States
- UM1 AI069434/AI/NIAID NIH HHS/United States
- UL1 RR024996/RR/NCRR NIH HHS/United States
- HHSN268201800014I/HB/NHLBI NIH HHS/United States
- UM1 AI069432/AI/NIAID NIH HHS/United States
- UL1 RR025780/RR/NCRR NIH HHS/United States
- R01 AR048797/AR/NIAMS NIH HHS/United States
- R01 AR042742/AR/NIAMS NIH HHS/United States
- U01 AI069481/AI/NIAID NIH HHS/United States
- 75N92020D00001/HL/NHLBI NIH HHS/United States
- U01 AI069470/AI/NIAID NIH HHS/United States
- UM1 AI069495/AI/NIAID NIH HHS/United States
- U01 HL120393/HL/NHLBI NIH HHS/United States
- UM1 AI069471/AI/NIAID NIH HHS/United States
- R01 AG058921/AG/NIA NIH HHS/United States
- U01 AI069484/AI/NIAID NIH HHS/United States
- U01 HL089897/HL/NHLBI NIH HHS/United States
- U01 AI069439/AI/NIAID NIH HHS/United States
- U01 AI069556/AI/NIAID NIH HHS/United States
- UM1 AI069428/AI/NIAID NIH HHS/United States
- U01 AI069418/AI/NIAID NIH HHS/United States
- U19 AI111224/AI/NIAID NIH HHS/United States
- U01 AI069534/AI/NIAID NIH HHS/United States
- R01 HL071250/HL/NHLBI NIH HHS/United States
- UM1 AI069534/AI/NIAID NIH HHS/United States
- UL1 RR024156/RR/NCRR NIH HHS/United States
- R01 NS058700/NS/NINDS NIH HHS/United States
- U01 AI069428/AI/NIAID NIH HHS/United States
- N01 HC095167/HL/NHLBI NIH HHS/United States
- U01 AI069532/AI/NIAID NIH HHS/United States
- UM1 AI069439/AI/NIAID NIH HHS/United States
- HHSN261201800010I/CA/NCI NIH HHS/United States
- UL1 TR000124/TR/NCATS NIH HHS/United States
- UM1 AI069415/AI/NIAID NIH HHS/United States
- F32 HL085989/HL/NHLBI NIH HHS/United States
- HHSN261201800012I/CA/NCI NIH HHS/United States
- HHSN268201800014C/HL/NHLBI NIH HHS/United States
- N01 HC095159/HL/NHLBI NIH HHS/United States
- R01 AR050511/AR/NIAMS NIH HHS/United States
- UL1 TR000058/TR/NCATS NIH HHS/United States
- 75N92020D00003/HL/NHLBI NIH HHS/United States
- P30 AI045008/AI/NIAID NIH HHS/United States
- UM1 AI069484/AI/NIAID NIH HHS/United States
- UM1 AI068634/AI/NIAID NIH HHS/United States
- U01 AI069501/AI/NIAID NIH HHS/United States
- UM1 AI069412/AI/NIAID NIH HHS/United States
- U01 HL089856/HL/NHLBI NIH HHS/United States
- UM1 AI069470/AI/NIAID NIH HHS/United States
- R01 HL067348/HL/NHLBI NIH HHS/United States
- U01 AI046376/AI/NIAID NIH HHS/United States
- UM1 AI069481/AI/NIAID NIH HHS/United States
- R01 AI058740/AI/NIAID NIH HHS/United States
- UM1 AI069477/AI/NIAID NIH HHS/United States
- U01 AI069432/AI/NIAID NIH HHS/United States
- P30 DK063491/DK/NIDDK NIH HHS/United States
- R01 HL071051/HL/NHLBI NIH HHS/United States
- HHSN268201800001C/HL/NHLBI NIH HHS/United States
- HHSN268201800013I/MD/NIMHD NIH HHS/United States
- U01 AI069450/AI/NIAID NIH HHS/United States
- U01 AI038858/AI/NIAID NIH HHS/United States
- U01 AI046370/AI/NIAID NIH HHS/United States
- U01 AI068636/AI/NIAID NIH HHS/United States
- P30 AI073961/AI/NIAID NIH HHS/United States
- UM1 AI069474/AI/NIAID NIH HHS/United States
- UL1 TR000439/TR/NCATS NIH HHS/United States
- UL1 RR025777/RR/NCRR NIH HHS/United States
- U01 AI034853/AI/NIAID NIH HHS/United States
- UL1 TR001420/TR/NCATS NIH HHS/United States
- 75N92020D00004/HL/NHLBI NIH HHS/United States
- UM1 AI069452/AI/NIAID NIH HHS/United States
- UM1 AI069496/AI/NIAID NIH HHS/United States
- U01 AI069415/AI/NIAID NIH HHS/United States
- U01 AI027666/AI/NIAID NIH HHS/United States
- U01 AI027658/AI/NIAID NIH HHS/United States
- U01 AI069495/AI/NIAID NIH HHS/United States
- N01 HC095163/HL/NHLBI NIH HHS/United States
- HHSN268201800011C/HL/NHLBI NIH HHS/United States
- 75N92020D00007/HL/NHLBI NIH HHS/United States
- UL1 RR024160/RR/NCRR NIH HHS/United States
- UM1 AI069556/AI/NIAID NIH HHS/United States
- U01 AI027675/AI/NIAID NIH HHS/United States
- P30 AI110527/AI/NIAID NIH HHS/United States
- R01 AR063759/AR/NIAMS NIH HHS/United States
- M01 RR007122/RR/NCRR NIH HHS/United States
- HHSN268201500003I/HL/NHLBI NIH HHS/United States
- M01 RR000425/RR/NCRR NIH HHS/United States
- U01 AI069511/AI/NIAID NIH HHS/United States
- U01 HG009379/HG/NHGRI NIH HHS/United States
- U01 AI069503/AI/NIAID NIH HHS/United States
- R01 DK071891/DK/NIDDK NIH HHS/United States
- UH2 AR067677/AR/NIAMS NIH HHS/United States
- UL1 TR000170/TR/NCATS NIH HHS/United States
- UM1 AI069502/AI/NIAID NIH HHS/United States
- U01 AI025859/AI/NIAID NIH HHS/United States
- UL1 TR001082/TR/NCATS NIH HHS/United States
- R01 HL071205/HL/NHLBI NIH HHS/United States
- UL1 RR025747/RR/NCRR NIH HHS/United States
- UM1 AI069450/AI/NIAID NIH HHS/United States
- R01 AR063611/AR/NIAMS NIH HHS/United States
- HHSN268201800015I/HB/NHLBI NIH HHS/United States
- UM1 AI106701/AI/NIAID NIH HHS/United States
- UM1 AI069532/AI/NIAID NIH HHS/United States
- UM1 AI069465/AI/NIAID NIH HHS/United States
- U01 AI069424/AI/NIAID NIH HHS/United States
- UL1 TR000040/TR/NCATS NIH HHS/United States
- U01 AI032782/AI/NIAID NIH HHS/United States
- N01 HC095166/HL/NHLBI NIH HHS/United States
- HHSN268201800010I/HB/NHLBI NIH HHS/United States
- T32 CA154274/CA/NCI NIH HHS/United States
- 75N92020D00006/HL/NHLBI NIH HHS/United States
- HHSN261200800001C/RC/CCR NIH HHS/United States
- UM1 AI069419/AI/NIAID NIH HHS/United States
- UL1 RR025008/RR/NCRR NIH HHS/United States
- R01 HL117626/HL/NHLBI NIH HHS/United States
- N01 HC095162/HL/NHLBI NIH HHS/United States
- UL1 TR001881/TR/NCATS NIH HHS/United States
- HHSN268201800011I/HB/NHLBI NIH HHS/United States
- U01 AI069477/AI/NIAID NIH HHS/United States
- N01 HC095164/HL/NHLBI NIH HHS/United States
- N01 HC095165/HL/NHLBI NIH HHS/United States
- UL1 TR000004/TR/NCATS NIH HHS/United States
- P01 HL132825/HL/NHLBI NIH HHS/United States
- R01 HL071258/HL/NHLBI NIH HHS/United States
- P30 AI060354/AI/NIAID NIH HHS/United States
- U01 AI069419/AI/NIAID NIH HHS/United States
- UL1 TR000457/TR/NCATS NIH HHS/United States
- UM1 AI069511/AI/NIAID NIH HHS/United States
- U01 AI069494/AI/NIAID NIH HHS/United States
- UM1 AI069447/AI/NIAID NIH HHS/United States
- HHSN261200800001E/CA/NCI NIH HHS/United States
- U01 AI069452/AI/NIAID NIH HHS/United States
- UM1 AI069467/AI/NIAID NIH HHS/United States
- R01 HL092301/HL/NHLBI NIH HHS/United States
- HHSN261201800014I/CA/NCI NIH HHS/United States
- HHSN268201000001I/HL/NHLBI NIH HHS/United States
- U01 AI069471/AI/NIAID NIH HHS/United States
- U01 AI069472/AI/NIAID NIH HHS/United States
- UM1 AI068636/AI/NIAID NIH HHS/United States
- U01 AI025868/AI/NIAID NIH HHS/United States
- N01 HC095160/HL/NHLBI NIH HHS/United States
- P30 AI050410/AI/NIAID NIH HHS/United States
- UM1 AI069418/AI/NIAID NIH HHS/United States
LinkOut - more resources
Full Text Sources
Medical
Research Materials
