. 2021 Jul 2;4(3):e1166.
doi: 10.1002/jsp2.1166. eCollection 2021 Sep.

Evaluation of lumbar spinal fusion utilizing recombinant human platelet derived growth factor-B chain homodimer (rhPDGF-BB) combined with a bovine collagen/β-tricalcium phosphate (β-TCP) matrix in an ovine model

Affiliations

Evaluation of lumbar spinal fusion utilizing recombinant human platelet derived growth factor-B chain homodimer (rhPDGF-BB) combined with a bovine collagen/β-tricalcium phosphate (β-TCP) matrix in an ovine model

Benjamin C Gadomski et al. JOR Spine. .

Abstract

Background context: While the clinical effectiveness of recombinant human Platelet Derived Growth Factor-B chain homodimer combined with collagen and β-tricalcium phosphate (rhPDGF-BB + collagen/β-TCP) treatment for indications involving hindfoot and ankle is well-established, it is not approved for use in spinal interbody fusion, and the use of autograft remains the gold standard.

Purpose: The purpose of this study was to compare the effects of rhPDGF-BB + collagen/β-TCP treatment on lumbar spine interbody fusion in an ovine model to those of autograft bone and collagen/β-TCP treatments using biomechanical, radiographic, and histological assessment techniques.

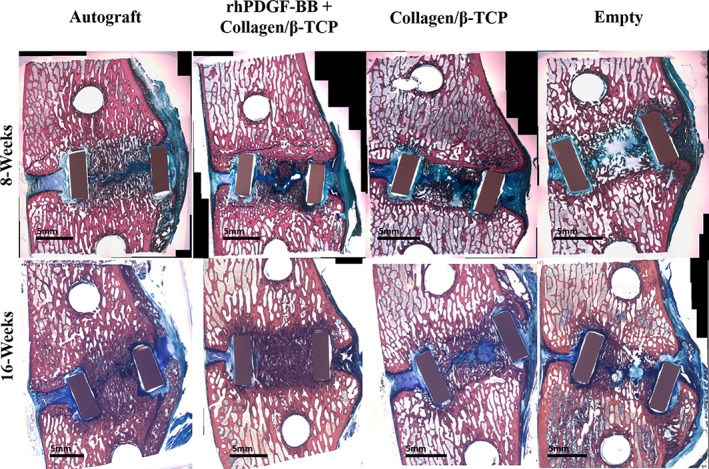
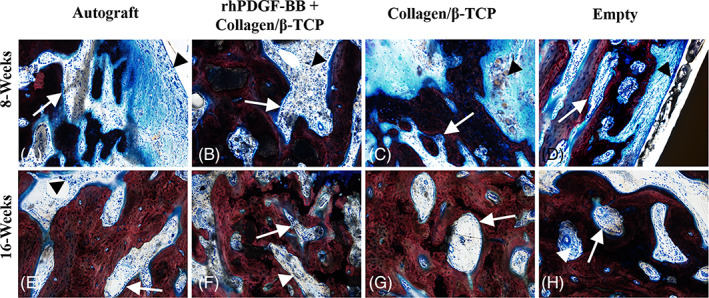
Study design: Thirty-two skeletally mature Columbian Rambouillet sheep were used to evaluate the safety and effectiveness of rhPDGF-BB + collagen/β-TCP matrix in a lumbar spinal fusion model. Interbody polyetheretherketone (PEEK) cages contained either autograft, rhPDGF-BB + collagen/β-TCP, collagen/β-TCP matrix, or left empty.

Methods: Animals were sacrificed 8- or 16-weeks post-surgery. Spinal fusion was evaluated via post-sacrifice biomechanical, micro-computed tomography (μCT), and histological analysis. Outcomes were statistically compared using a two-way analysis of variance (ANOVA) with an alpha value of 0.05 and a Tukey post-hoc test.

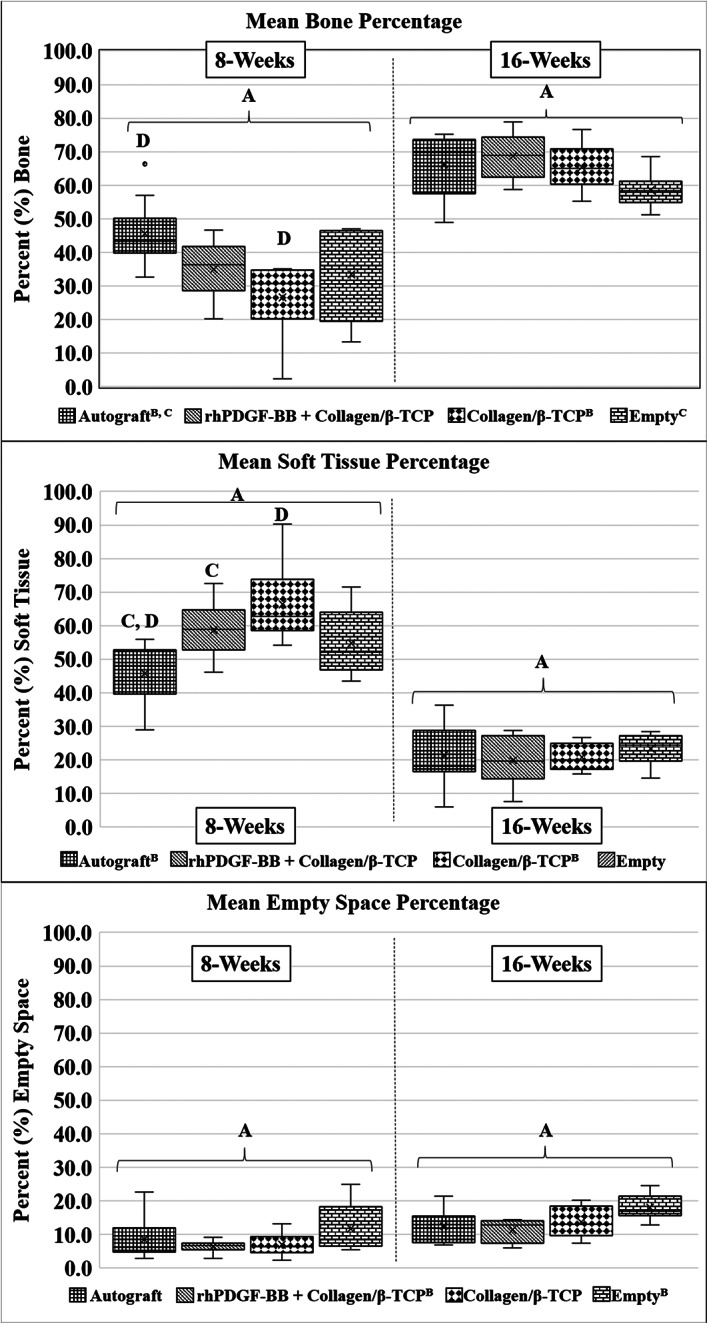
Results: There were no statistically significant differences between groups within treatment timepoints for flexion-extension, lateral bending, or axial rotation range of motion, neutral zone, neutral zone stiffness, or elastic zone stiffness. μCT bone volume fraction was significantly greater between treatment groups independent of timepoint where Autograft and rhPDGF-BB + collagen/β-TCP treatments demonstrated significantly greater bone volume fraction as compared to collagen/β-TCP (P = .026 and P = .038, respectively) and Empty cage treatments (P = .002 and P = .003, respectively). μCT mean bone density fraction was most improved in rhPDGF-BB + collagen/β-TCP specimens at the 8 week and 16-week timepoints as compared to all other treatment groups. There were no statistically significant differences in histomorphometric measurements of bone, soft tissue, or empty space between rhPDGF-BB + collagen/β-TCP and autograft treatments.

Conclusions: The results of this study indicate that the use of rhPDGF-BB combined with collagen/β-TCP promotes spinal fusion comparable to that of autograft bone.

Clinical significance: The data indicate that rhPDGF-BB combined with collagen/β-TCP promotes spinal fusion comparably to autograft bone treatment and may offer a viable alternative in large animal spinal fusion. Future prospective clinical studies are necessary to fully understand the role of rhPDGF-BB combined with collagen/β-TCP in human spinal fusion healing.

Keywords: autograft; collagen; fusion; growth factor; ovine; rhPDGF‐BB; spine; β‐TCP.


Conflict of interest statement

The authors declare no potential conflict of interest.

Figures

FIGURE 1
FIGURE 1
Representative μCT cross‐sectional sagittal plane reconstructions of bone formation within the interbody cage for each group at 8‐week and 16‐week timepoints. Analyzed regions of interest are bounded by dashed lines. Note that specimens displayed match histology specimens displayed in Figure 3
FIGURE 2
FIGURE 2
Quantitative three‐dimensional μCT analysis was performed within the volume encapsulated by the PEEK interbody implant. Like roman numerals presented in the figure or figure legend indicate statistical differences. (Top) Bone volume fraction (BV/TV) was not significantly different between treatments groups within the 8‐week or 16‐week timepoints. Statistically significant overall main effects were observed between timepoints (16‐week BV/TV was significantly greater than 8‐week BV/TV, A: P < .001) and between treatment groups independent of timepoint where Autograft and rhPDGF‐BB + collagen/β‐TCP treatments demonstrated significantly greater BV/TV as compared to collagen/β‐TCP (B: P = .026 and C: P = .038, respectively) and Empty cage treatments (D: P = .002 and E: P = .003, respectively). (Bottom) As bone density fraction (MDBV/MDTV) approaches unity, then the region of interest is considered to have a more solid architecture and is used to quantify the solidity of bone within the graft window. MDBV/MDTV was not significantly different between treatments at the 8‐week timepoint. At the 16‐week timepoint, rhPDGF‐BB + collagen/β‐TCP treatment demonstrated significantly improved MDBV/MDTV as compared to collagen/β‐TCP and Empty cage treatments while Autograft treatment resulted in significantly improved MDBV/MDTV as compared to Empty cage treatment. Statistically significant overall main effects were observed between timepoint (16‐week MDBV/MDTV was significantly lower than that at 8‐weeks, A: P < .001) and between treatments independent of timepoint where MDBV/MDTV was significantly reduced in Autograft specimens as compared to collagen/β‐TCP specimens (B: P = .002) and significantly reduced in rhPDGF + collagen/β‐TCP as compared to collagen/β‐TCP specimens (C: P = .001) and Empty cage specimens (D: P < .001). Data are presented in box and whisker plot format. The “box” is bounded by the first and third quartiles and were generated exclusive of median values in the event there was an odd number of data points (Microsoft Excel 2016, Redmond, Washington). The “whiskers” represent the maximum/minimum values within the data set; the horizontal line represents the data median, and mean data are represented by “x.” Outlier data are represented by “•” and were calculated as the first quartile minus 1.5 times the interquartile range or the third quartile plus 1.5 times the interquartile range, are highlighted
FIGURE 3
FIGURE 3
Representative sagittal plane histological images of bone formation within the interbody cage for each group at 8‐week and 16‐week timepoints. Note that specimens displayed match μCT specimens displayed in Figure 1. Pink/red stain = bone tissues, blue stained regions = soft fibrous/cartilage tissues
FIGURE 4
FIGURE 4
Quantitative two‐dimensional histomorphometry analysis was performed within the area encompassed by the PEEK interbody cage. Like roman numerals presented in the figure or figure legend indicate statistical differences. (Top) Autograft treatment demonstrated significantly increased bone area as compared to collagen/β‐TCP treatment at 8 weeks. No other statistically significant differences were observed between treatment groups within the 8‐week or 16‐week timepoints. Statistically significant overall main effects were observed between timepoints (greater bone area at 16‐weeks as compared to 8‐weeks, A: P < .001) and between treatment groups independent of timepoint where Autograft treatment resulted in increased bone area as compared to collagen/β‐TCP (B: P = .026) and Empty cage (C: P = .026) treatments. (Middle) Soft tissue area was significant greater in rhPDGF‐BB + collagen/β‐TCP and collagen/β‐TCP specimens as compared to Autograft specimens at 8‐weeks (C: P = .022 and D: P < .001, respectively). No further statistical differences were observed between treatment groups within the 8‐week or 16‐week timepoints. Again, statistically significant overall main effects were observed between timepoints (greater soft tissue area at 8‐weeks as compared to 16‐weeks, A: P < .001) and between treatment groups independent of timepoint where Autograft treatment resulted in decreased soft tissue area as compared to collagen/β‐TCP treatment (B: P = .009). (Bottom) No statistically significant differences were observed in the amount of empty space within the interbody cage between treatment groups within either timepoint. Statistically significant overall main effects were observed between timepoints (greater empty area at 16‐weeks as compared to 8‐weeks, A: P < .001) and between treatment groups independent of timepoint where rhPDGF‐BB + collagen/β‐TCP treatment resulted in decreased empty area as compared to Empty cage treatment (B: P = .004). Data are presented in box and whisker plot format. The “box” is bounded by the first and third quartiles and were generated exclusive of median values in the event there was an odd number of data points (Microsoft Excel 2016, Redmond, Washington). The “whiskers” represent the maximum/minimum values within the data set; the horizontal line represents the data median, and mean data are represented by “x.” Outlier data are represented by “•” and were calculated as the first quartile minus 1.5 times the interquartile range or the third quartile plus 1.5 times the interquartile range, are highlighted
FIGURE 5
FIGURE 5
Histopathological assessment of host cell type and response. A‐D, Representative photomicrographs of osteoblast activity and inflammation observed at the 8‐week timepoint captured from the newly produced bone and associated soft tissue centrally present in the intervertebral defect space between the dorsal and ventrally visible aspects of the interbody cage. Images demonstrate numerous plump osteoblasts lining endosteal surfaces of new bone (white arrows). Inflammation in these animals was typically confined to the reactive fibrous tissue filling intertrabecular spaces of new bone and surrounding the implant and was composed of low to moderate numbers of macrophages, lymphocytes, and plasma cells (arrowheads). The degree of inflammation was greatest in the rhPDGF‐BB + collagen/β‐TCP, collagen/β‐TCP, and empty specimens. E‐H, Representative photomicrographs of osteoblast activity and inflammation observed in animals at the 16‐week timepoint. Osteoblast activity (white arrows) was similar across all groups at this timepoint and was mildly decreased as compared to the 8‐week timepoint. Similarly, while the cellular composition of the inflammatory infiltrate was similar, the degree of severity was similar across all groups at the 16‐week timepoint, and uniformly decreased as compared to 8‐week animals. All images 10× magnification

References

    1. Fiedler J, Etzel N, Brenner RE. To go or not to go: migration of human mesenchymal progenitor cells stimulated by isoforms of PDGF. J Cell Biochem. 2004;93(5):990‐998. - PubMed
    1. Mehrotra M, Krane SM, Walters K, Pilbeam C. Differential regulation of platelet‐derived growth factor stimulated migration and proliferation in osteoblastic cells. J Cell Biochem. 2004;93(4):741‐752. - PubMed
    1. Ozaki Y, Nishimura M, Sekiya K, et al. Comprehensive analysis of chemotactic factors for bone marrow mesenchymal stem cells. Stem Cells Dev. 2007;16(1):119‐129. - PubMed
    1. Caplan AI, Correa D. PDGF in bone formation and regeneration: new insights into a novel mechanism involving MSCs. J Orthop Res. 2011;29(12):1795‐1803. - PubMed
    1. Peng Y, Wu S, Li Y, Crane JL. Type H blood vessels in bone modeling and remodeling. Theranostics. 2020;10(1):426‐436. - PMC - PubMed