. 2021 Sep 14;24(10):103128.
doi: 10.1016/j.isci.2021.103128. eCollection 2021 Oct 22.

Sleeping ribosomes: Bacterial signaling triggers RaiA mediated persistence to aminoglycosides

Affiliations

Sleeping ribosomes: Bacterial signaling triggers RaiA mediated persistence to aminoglycosides

Manon Lang et al. iScience. .

Abstract

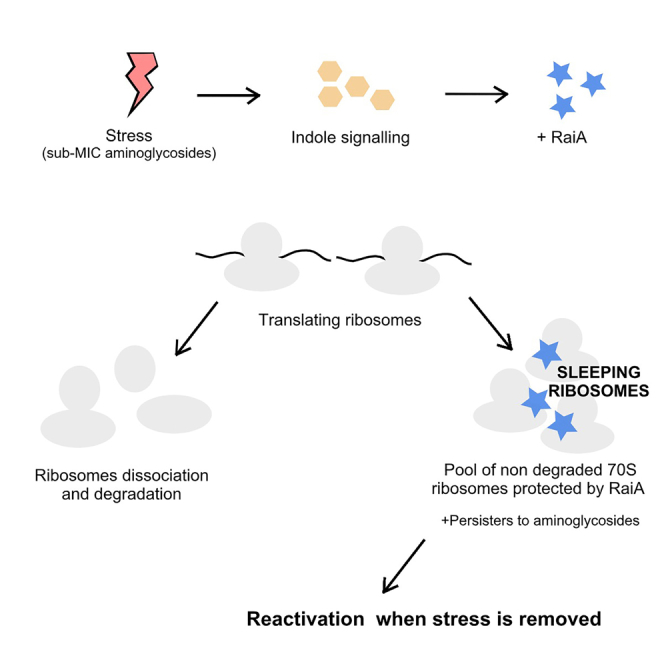
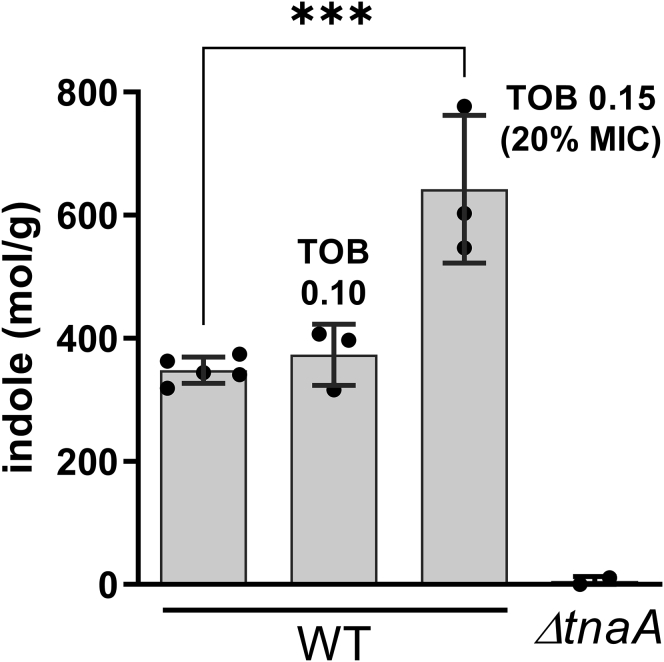
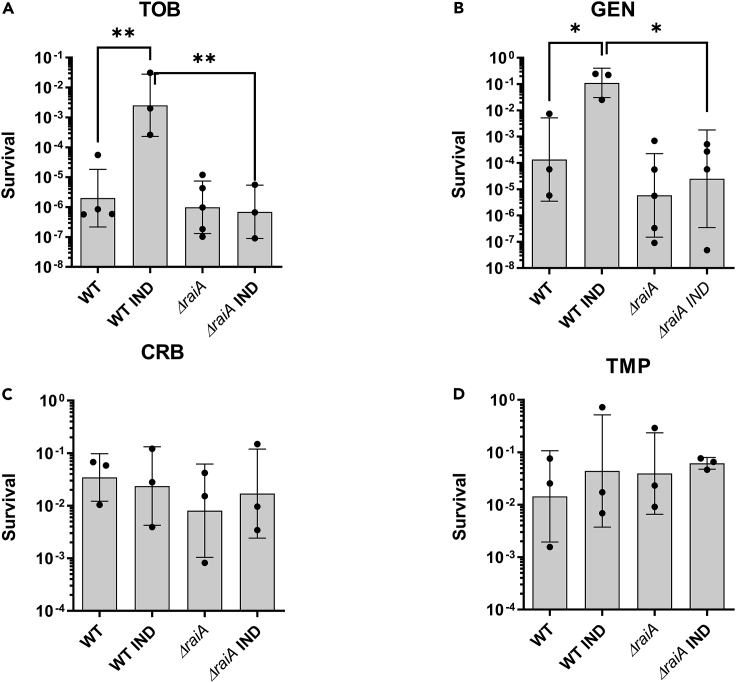
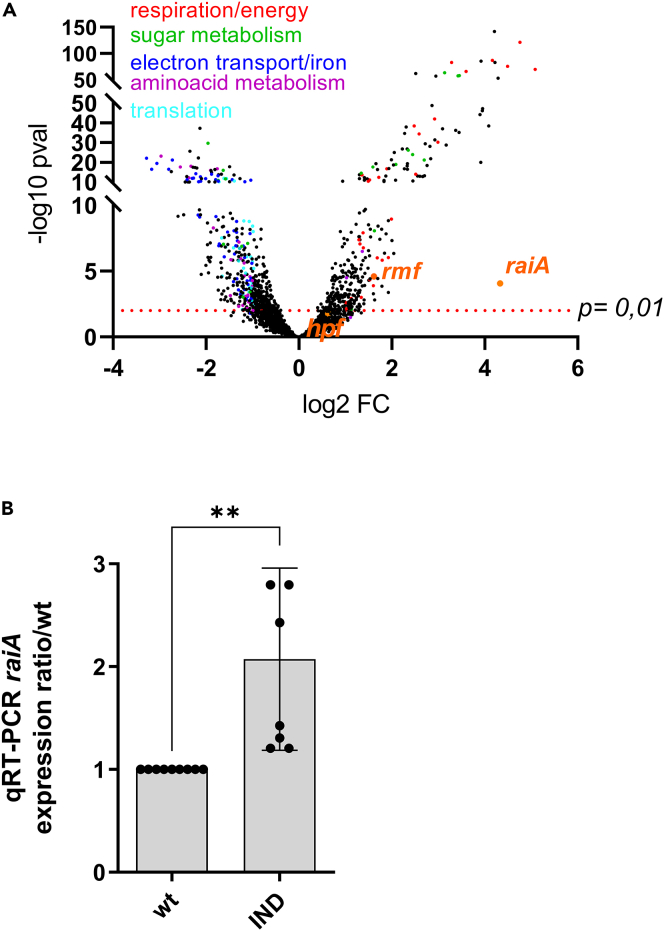
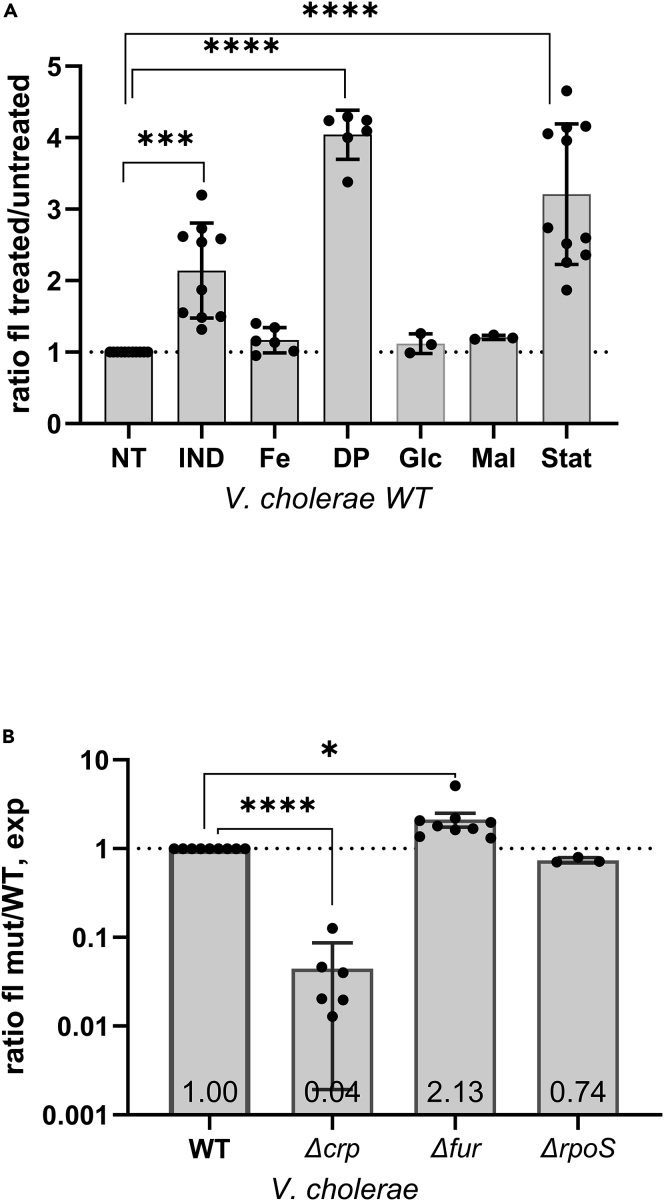
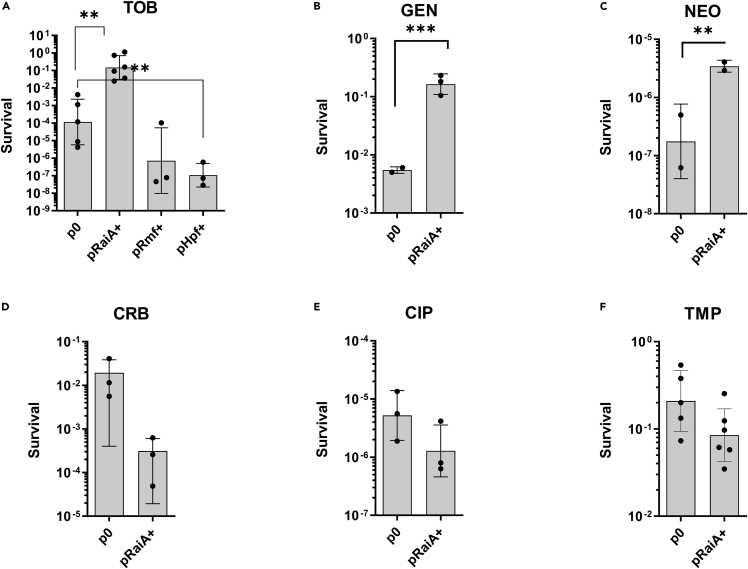
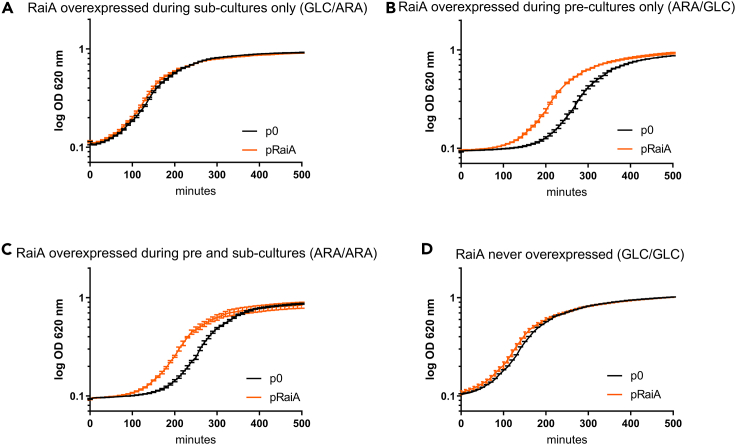
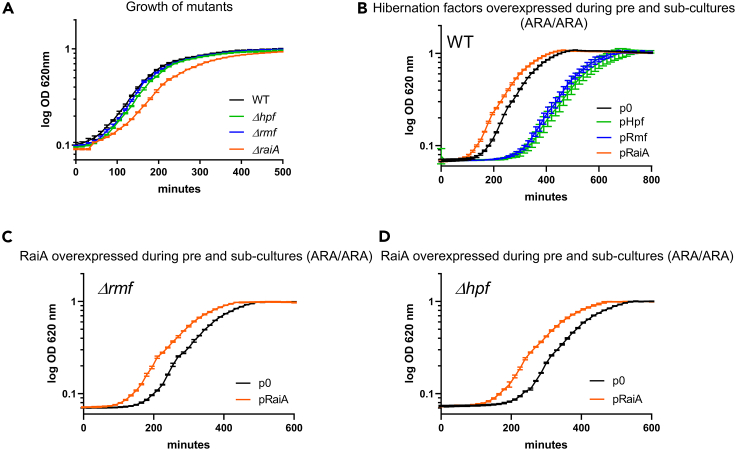
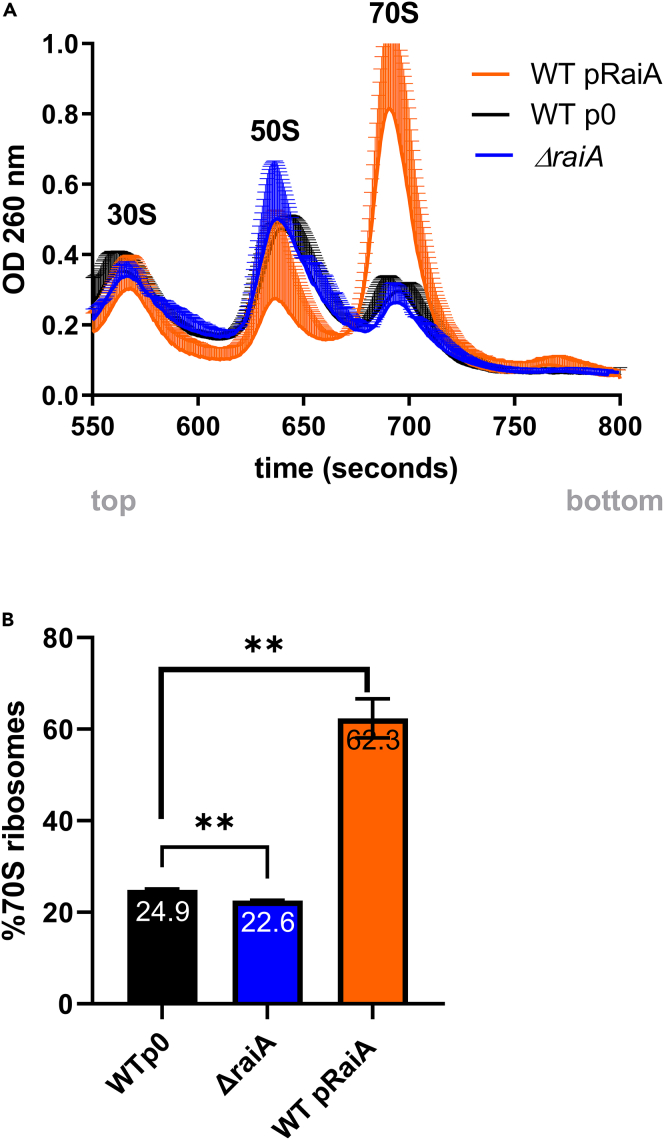
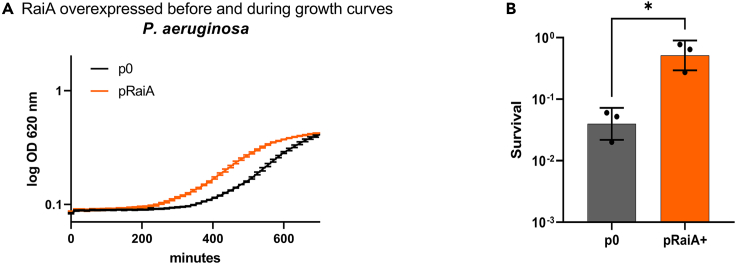
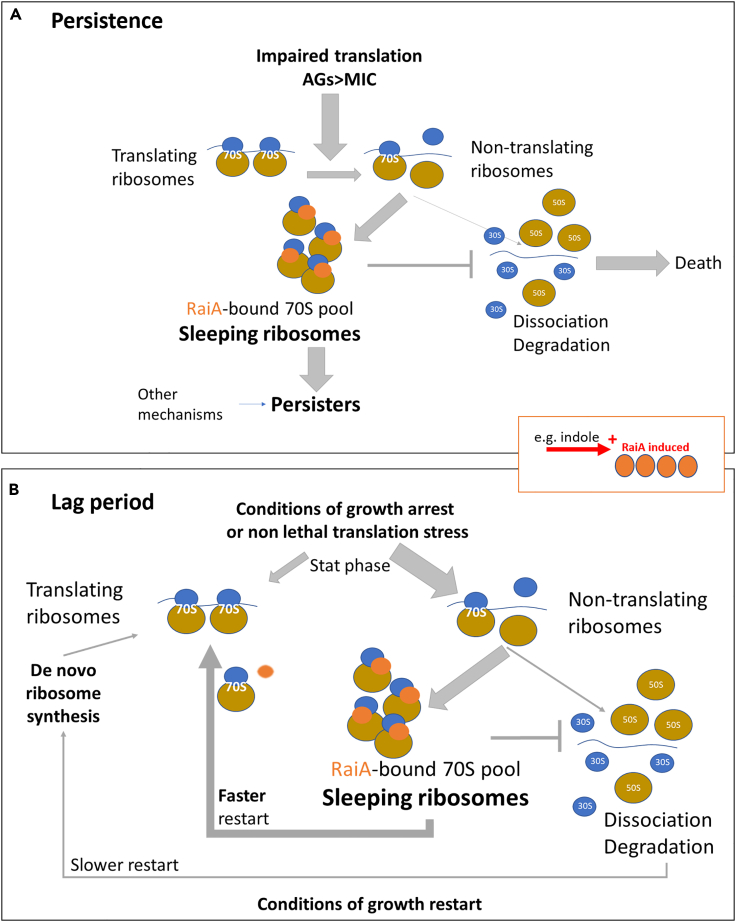
Indole is a molecule proposed to be involved in bacterial signaling. We find that indole secretion is induced by sublethal tobramycin concentrations and increases persistence to aminoglycosides in V. cholerae. Indole transcriptomics showed increased expression of raiA, a ribosome associated factor. Deletion of raiA abolishes the appearance of indole dependent persisters to aminoglycosides, although its overexpression leads to 100-fold increase of persisters, and a reduction in lag phase, evocative of increased active 70S ribosome content, confirmed by sucrose gradient analysis. We propose that, under stress conditions, RaiA-bound inactive 70S ribosomes are stored as "sleeping ribosomes", and are rapidly reactivated upon stress relief. Our results point to an active process of persister formation through ribosome protection during translational stress (e.g., aminoglycoside treatment) and reactivation upon antibiotic removal. Translation is a universal process, and these results could help elucidate a mechanism of persistence formation in a controlled, thus inducible way.

Keywords: Bacteriology; Microbial genomics; Viral microbiology.


Conflict of interest statement

The authors declare no competing interests.

Figures

None
Graphical abstract
Figure 1
Figure 1
Indole is produced during growth in sub-MIC tobramycin and induces raiA Measure of extracellular indole concentrations of bacterial cultures grown overnight in rich medium MOPS (Teknova EZ rich defined medium) with and without tobramycin at 0.10 μg/mL (TOB 0.10) or 0.15 μg/mL (TOB 0.15) using the Kovacs reagent (Saint-Ruf et al., 2014). ΔtnaA strain was used as a negative control without tobramycin. Experiments were performed in triplicates, and statistical analysis was performed (∗∗∗: p < 0.001). Error bars represent standard deviation.
Figure 2
Figure 2
Modulation of persistence of exponential phase WT and ΔraiA V. cholerae by indole (A–D) Early exponential phase of wild-type (WT) and ΔraiA V. cholerae cultures were treated with lethal doses of the specified antibiotics for 20 h. The y axis represents survival, as the number of CFU growing after antibiotic treatment and removal divided by the total number of CFU at time zero (before antibiotic treatment). Bars represent geometric means and error bars represent geometric standard deviation. Tobramycin (TOB): 10 μg/mL, gentamicin (GEN): 5 μg/mL, carbenicillin (CRB): 100 μg/mL, indole (IND): 350 μM. Experiments were performed 3 to 6 times, and statistical analysis was performed (∗: p < 0.05; ∗∗: p < 0.01).
Figure 3
Figure 3
Indole production during growth in sub-MIC tobramycin induces raiA (A) Volcano plot showing differentially expressed genes upon indole treatment. X axis represents log 2-fold change, Y axis represents the negative log 10 of the p value. raiA, rmf, and hpf are indicated. The dashed line represents a p value of 0.01, all of the dots above thus show a p value < 0.01. Red dots indicate genes linked with respiration, green with sugar metabolism, dark blue with iron, purple with amino acid metabolism, and light blue with translation. RNA-seq was performed in triplicates for each condition. See also Table S1. (B) raiA mRNA levels measured by RT-qPCR on exponential phase V. cholerae cultures in presence or absence of indole. Statistical analysis was performed (∗∗: p < 0.01). Error bars represent standard deviation.
Figure 4
Figure 4
Environmental stress induce raiA expression in exponential phase V. cholerae Fluorescence quantification of GFP expression from the raiA promoter by flow cytometry in MH media in exponential phase (except for “Stat”). (A) in WT V. cholerae. NT: Non-treated, IND: indole (350 μM), Fe: iron (18 μM), DP: 2,2′-Dipyridyl (500 μM), Glc: Glucose (1%), Mal: Maltose (1%), Stat: stationary phase. The y axis represents the fluorescence ratio of the treated over non-treated (NT) strain. (B) in indicated V. cholerae deletion mutants. The y axis represents the fluorescence ratio of the mutant over wild type (WT) strain. Mean fold change values are indicated within histogram bars. Experiments were performed at least 3 times, and statistical analysis was performed (∗∗: p < 0.01; ∗∗∗∗: p < 0.0001). Error bars represent standard deviation. See also Figure S4.
Figure 5
Figure 5
Modulation of persistence of exponential phase V. cholerae by RaiA (A-F) Early exponential phases of wild-type (WT) V. cholerae carrying either the empty pBAD vector (p0) or with specified gene (pGene) cultures were treated with lethal doses of the specified antibiotics for 20 h. The y axis represents survival, as the number of CFU growing after antibiotic treatment and removal divided by the total number of CFU at time zero (before antibiotic treatment). (A) Tobramycin (TOB): 10 μg/mL. (B) Gentamicin (GEN): 5 μg/mL. (C) Neomycin (NEO): 30 μg/mL. (D) Carbenicillin (CRB): 100 μg/mL. (E) Ciprofloxacin (CIP): 0.025 μg/mL. (F) Trimethoprim (TMP): 50 μg/mL.. Experiments were performed 3 to 6 times, and statistical analysis was performed (∗: p < 0.05; ∗∗: p < 0.01). Error bars represent standard deviation.
Figure 6
Figure 6
RaiA influences lag phase upon growth restart after the stationary phase (A–D) Growth is measured on a TECAN plate reader. The curves of wild type V. cholerae with the empty plasmid are compared with plasmid carrying raiA under inducible promoter in MH media containing either glucose or arabinose. The promoter is repressed using glucose (GLC) and induced using arabinose (ARA). Growth was performed as specified, with RaiA expression repressed or induced in the overnight culture used for inoculum (overnight culture supplemented or not with ARA; indicated as “during pre-cultures”), or/and with RaiA expression induced or not during growth in the microplate reader (growth media supplemented or not with ARA in the microplate; indicated as “during sub-cultures”): (A) GLC/ARA, (B) ARA/GLC, (C) ARA/ARA, and (D) GLC/GLC. A scheme of the experimental setup is found on Figure S5A. Experiments were performed in triplicates and geometric means are represented. Error bars represent the geometric standard deviation. See also Figure S6B.
Figure 7
Figure 7
The effect of RaiA on lag phase is independent of ribosome hibernation factors Rmf/Hpf (A) Growth in MH media of WT and mutant strains. (B) Growth of V. cholerae overexpressing hibernation factors or empty plasmid in MH media containing arabinose (ARA/ARA). (C and D) Growth of hibernation factor mutants Δrmf and Δhpf overexpressing RaiA in MH media containing arabinose (ARA/ARA). Experiments were performed in triplicates and geometric means are represented. Error bars represent the geometric standard deviation. See also Figure S6C.
Figure 8
Figure 8
RaiA levels influence stationary phase 70S ribosome content relative to 50S + 30S subunits in V. cholerae (A) Cellular extracts of 24 h cultures (ΔraiA and WT V. cholerae carrying the p0/pBAD-RaiA vector, in MH media containing spectinomycin and arabinose) were separated on 10–50% sucrose density gradient. Ribosomal RNA content was measured at OD 260 nm using a spectrometer coupled to a pump and time on the X axis represents samples from less dense (upper fragments, smaller complexes) to denser (bottom of the tube, heavier complexes). Lysis was performed in the presence of 10 mM MgCl2. Cell debris eluting before 550 s are not shown. Graphs are normalized to total OD 260 nm = 1 for each sample. Mean values are indicated within histogram bars. Error bars represent standard deviation. (B) Percentage of 70S ribosomes over total ribosome subunits (70S)/(70S + 50S + 30S). Error bars represent standard deviation (∗∗: p < 0.01).
Figure 9
Figure 9
RaiA overexpression in Pseudomonas aeruginosa increases tolerance to tobramycin in exponential phase and promotes earlier exit from stationary phase (A) Growth is measured on a TECAN plate reader. The curves of WT P. aeruginosa with the empty plasmid (p0) are compared with the plasmid carrying raiA of V. cholerae under inducible promoter in MH media containing arabinose. See also Figure S6D. (B) Early exponential phases of WT P. aeruginosa cultures were treated with lethal doses of tobramycin (TOB: 10 μg/mL) for 20 h. The y axis represents survival, as the number of CFU growing after antibiotic treatment and removal divided by the total number of CFU at time zero (before antibiotic treatment) (∗: p < 0.05). Experiments were performed in triplicates. Error bars represent standard deviation.
Figure 10
Figure 10
Summary model: RaiA mediated ribosome protections increases persistence to aminoglycosides and decreases lag phase during growth restart Diagrams depict RaiA induced conditions. (A) Persistence. During exponential growth, treatment with lethal doses of aminoglycosides leads to disruption of translation and stalling of translating 70S ribosomes, and eventually to their dissociation into 50S + 30S subunits and degradation of these ribosomes, resulting in cell death. Upon induction of RaiA (e.g., by indole signaling), we propose that RaiA does not affect translating ribosomes, but binds non-translating 70S ribosomes to form sleeping ribosomes, and protects them from dissociation into subunits and degradation. This results in increased persistence. (B) Length of lag phase. In a stationary phase culture (e.g. overnight culture), translation is highly decreased, leading to dissociation from the mRNA ribosome degradation. Upon growth restart, a lag phase thus occurs where ribosomes are resynthesized. We propose that when RaiA production is increased before entering the stationary phase, an increased proportion of non-translating ribosomes are bound and are preserved as 70S by RaiA, rather than being degraded. The presence of such an increased pool of intact 70S ready-to-use sleeping ribosomes gives an advantage on translation reactivation, whereas degraded ribosomes have to be recycled or de novo synthetized, decreasing the lag phase necessary for the synthesis of a sufficient number of ribosomes.

References

    1. Agafonov D.E., Kolb V.A., Nazimov I.V., Spirin A.S. A protein residing at the subunit interface of the bacterial ribosome. Proc. Natl. Acad. Sci. U. S. A. 1999;96:12345–12349. - PMC - PubMed
    1. Agafonov D.E., Kolb V.A., Spirin A.S. Ribosome-associated protein that inhibits translation at the aminoacyl-tRNA binding stage. EMBO Rep. 2001;2:399–402. - PMC - PubMed
    1. Andersson D.I., Hughes D. Microbiological effects of sublethal levels of antibiotics. Nat. Rev. Microbiol. 2014;12:465–478. - PubMed
    1. Baharoglu Z., Babosan A., Mazel D. Identification of genes involved in low aminoglycoside-induced SOS response in Vibrio cholerae: a role for transcription stalling and Mfd helicase. Nucleic Acids Res. 2014;42:2366–2379. - PMC - PubMed
    1. Baharoglu Z., Bikard D., Mazel D. Conjugative DNA transfer induces the bacterial SOS response and promotes antibiotic resistance development through integron activation. Plos Genet. 2010;6:e1001165. - PMC - PubMed