. 2022 Jun;18(6):1256-1273.
doi: 10.1080/15548627.2021.1972403. Epub 2021 Oct 6.

Autophagy-dependent glutaminolysis drives superior IL21 production in HIV-1-specific CD4 T cells

Affiliations

Autophagy-dependent glutaminolysis drives superior IL21 production in HIV-1-specific CD4 T cells

Hamza Loucif et al. Autophagy. 2022 Jun.

Abstract

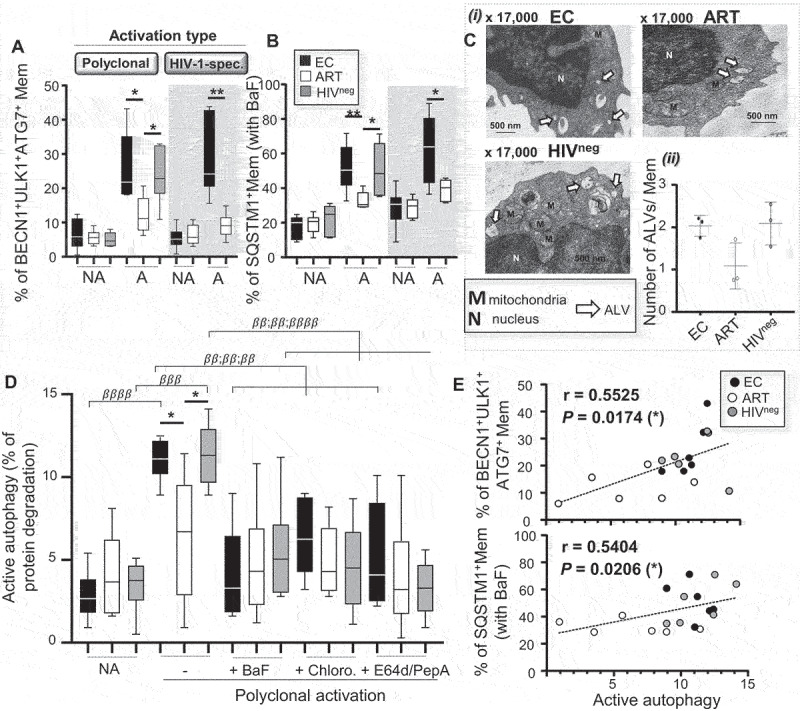
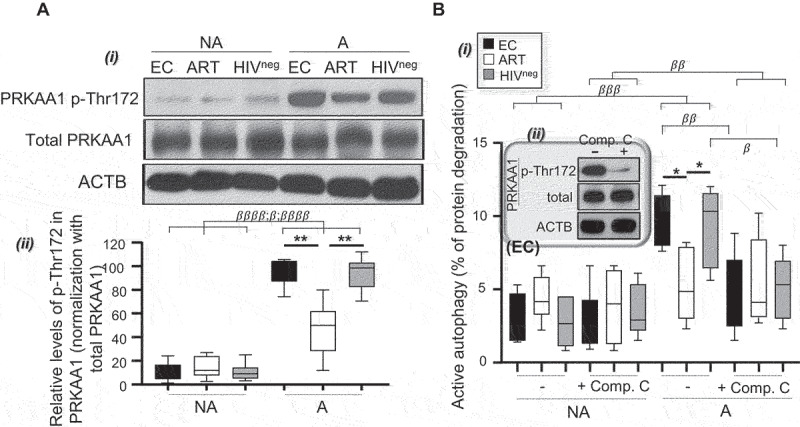
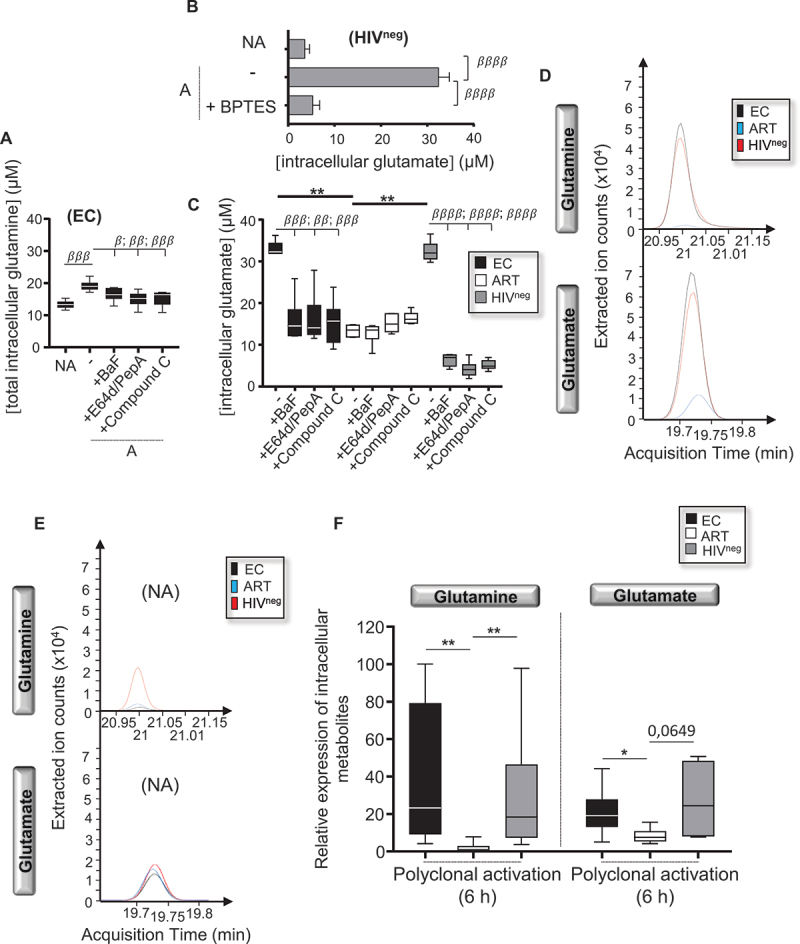
The maintenance of a strong IL21 production in memory CD4 T cells, especially in HIV-1-specific cells, represents a major correlate of natural immune protection against the virus. However, the molecular mechanisms underlying IL21 production during HIV-1 infection, which is only elevated among the naturally protected elite controllers (EC), are still unknown. We recently found out that lipophagy is a critical immune mediator that control an antiviral metabolic state following CD8A T cell receptor engagement, playing an important role in the natural control of HIV-1 infection. This led us to investigate whether the beneficial role of a strong macroautophagy/autophagy, could also be used to ensure effective IL21 production as well. Herein, we confirm that after both polyclonal and HIV-1-specific activation, memory CD4 T cells (Mem) from EC display enhanced activity of the autophagy-mediated proteolysis compared to ART. Our results indicate that the enhanced autophagy activity in EC was controlled by the energy-sensing PRKAA1 (protein kinase AMP-activated catalytic subunit alpha 1). We further confirmed the critical role of the autophagy-mediated proteolysis in the strong IL21 production in EC by using BECN1 gene silencing as well as protease, PRKAA1, and lysosomal inhibitors. Finally, we established that high autophagy-mediated proteolysis in EC fuels their cellular rates of mitochondrial respiration due to glutaminolysis. Our data confirm the critical role of autophagy in dictating the metabolic input, which is required not only to ensure protective cytotoxic CD8A T cell responses, but also to provide strong IL21 production among antiviral CD4 T cells.Abbreviations: AKG: alpha-ketoglutarate; ART: patients under antiretroviral therapy; ATG7: autophagy related 7; BaF: bafilomycin A1; BECN1: beclin 1; Chloro.: chloroquine; EC: elite controllers; EIF4EBP1: eukaryotic translation initiation factor 4E binding protein 1; FOXO3: forkhead box O3; GLS: glutaminase; GLUD1: glutamate dehydrogenase 1; HIVneg: HIV-1-uninfected control donors; IFNG/IFN-γ: interferon gamma; IL21: interleukin 21; MTOR: mechanistic target of rapamycin kinase; PBMC: peripheral blood mononuclear cells; PRKAA1: protein kinase AMP-activated catalytic subunit alpha 1; SQSTM1: sequestosome 1; TCA: tricarboxylic acid cycle; ULK1: unc-51 like autophagy activating kinase.

Keywords: Antiretroviral therapy; HIV-1; IL21; PRKAA1; autophagy-mediated proteolysis; elite controllers; glutaminolysis.


Conflict of interest statement

No potential conflict of interest was reported by the author(s).

Figures

Figure 1.
Figure 1.
Enhanced autophagy-mediated proteolysis in Mem from EC after cell activation. Mem from EC, ART, and HIVneg were either polyclonally or HIV-1 Gag-specifically activated for 6 h. Of note, HIV-1-specific Mem were identified at 6 h post-activation by their positive staining for IFNG. (A) The percentages of Mem, which expressed autophagic players such as BECN1, ULK1 and ATG7, were then determined by flow cytometry. (B) We also assessed the percentages of SQSTM1+ Mem when lysosomal activity was blocked by BaF during culture. A, activated and NA, non-activated culture condition. (C) Ultrastructural analysis of purified Mem from EC, ART, and HIVneg after 6 h of polyclonal activation. i. Representative micrographs to appreciate the numbers of active autolysosomes (ALs) (X 17,000). ii. Quantitative analysis of the number of ALs per Mem for all study groups. (D) Autophagy-mediated proteolysis determined in purified Mem after polyclonal activation (PA) or not (NA), and in the presence or absence of BaF, Chloro., or E64d/PepA, by using a pulse-chase approach. (E) We assessed in polyclonally activated Mem from all study participants the correlation between the levels of proteolytic degradation of long-lived proteins with the percentages of BECN1+ ULK1+ ATG7+ or SQSTM1+ cells. N = 6 for all experiments, except for (C) and (E) with n = 3 and 18 respectively. The error bars indicate standard deviations from the means. β, symbol used for paired t-test (comparison between treated Mem and untreated control). *, symbol used for Mann-Whitney test (comparison between study groups).
Figure 2.
Figure 2.
Enhanced PRKAA1-dependent autophagy-mediated proteolysis in Mem from EC after cell activation. Mem from EC, ART, and HIVneg were polyclonally activated for 6 h. (A) Levels of total and p-Thr172 PRKAA1 were determined on non-activated (NA) and polyclonally activated (PA) Mem by western blotting. i. Representative blots for all study groups. ii. Densitometric quantification of 6 independent experiments was performed using ImageQuant software (mean ± SD). Results shown represent the relative levels of p-Thr172 in PRKAA1 and were determined as follows: values for p-Thr172 PRKAA1/values in % of total PRKAA1. (B) i. Autophagy-dependent proteolysis determined in purified Mem form EC, ART and HIVneg with or without PRKAA1 inhibition (using compound C [comp. C]), and after 6 h of polyclonal activation (PA) or not (NA). ii. Confirmation of AMPK inhibition by compound C was determined by western blotting using polyclonally activated Mem from EC (representative blots of 3 independent confirmations). N = 6 for all experiments. The error bars indicate standard deviations from the means. β, symbol used for paired t-test (comparison between treated Mem and untreated control). *, symbol used for Mann-Whitney test (comparison between study groups).
Figure 3.
Figure 3.
Autophagy-mediated proteolysis is required for optimal IL21 production in Mem from EC. Autophagy-mediated proteolysis and IL21 production were both determined in activated Mem under specific BECN1 gene silencing (siRNA IDs: 137,198), or PRKAA1 (compound C), lysosomal (BaF or Chloro.), and protease (E64d-PepA) inactivation. (A) Levels of BECN1 were determined on Mem after 24 h of cell transfection with negative or BECN1 siRNAs by flow cytometry. i. Representative histograms of BECN1 expression in transfected Mem from EC. ii. Percentages of BECN1+ cells in Mem with or without specific BECN1 silencing for all study groups. % of BECN1 decrease was also indicated in bold for the EC’ and HIVneg’s groups. (B) Autophagy-mediated proteolysis assessed in polyclonally activated Mem with or without specific BECN1 gene silencing or chemical inhibitors. Levels of IL21 production in Mem that have then been either (C) i. polyclonally or (D) HIV-1-specifically activated for 6 h with or without specific BECN1 gene silencing or chemical inhibitors. (C) ii. Representative histograms of IL21 expression in polyclonally-activated Mem from EC with or without autophagy blockade. iii. Confirmation of PRKAA1 inhibition by compound C was determined by western blotting using polyclonally activated Mem from EC (representative blots of 3 independent confirmations). N = 6. The error bars indicate standard deviations from the means. β, symbol used for paired t-test (comparison between treated Mem and untreated control). *, symbol used for Mann-Whitney test (comparison between study groups).
Figure 4.
Figure 4.
Similar lipophagy levels in activated Mem. (A-C) Assessment of lipophagy activity for all study groups by using our recently developed ImageStream-based lipophagy assay. Of note, we included lipophagy induction in starved Huh7.5 hepatic cells as the experimental control. (A) Representative images of single Lyso-ID+ LipidTox+ Huh7.5 cells (with or without cell starvation) and Mem for all groups that have been polyclonally activated or not for 6 h. All culture conditions were conducted in the presence or absence of BaF (“cumulative” and “steady-state” conditions, respectively). BF, bright field. (B) Magnified images showing increased lysosomal content of endogenous lipids in BaF-treated cells, which is an indicator of lipophagy activity when compared to cells without BaF. (C) Quantification of lipophagy activity determined in Lyso-ID+ LipidTox+ Huh7.5 cells and Mem in EC, ART, and HIVneg. Lipophagy activity was determined by the formula: ΔBDS = (% of BDShigh cells with BaF) – (% of BDShigh cells without BaF). (D, E) Imaging-based assay to assess lipophagy activity. (D) Mean LipidTox puncta per Huh7.5 cells in cumulative state (after normalization with the related steady-state condition). (E) At 6 h of polyclonal activation, lipophagy activity was assessed in Mem from EC, ART and HIVneg. Results shown are the mean LipidTox puncta per activated Mem in cumulative state (after normalization with the related steady-state condition). N = 6, except for n = 2 for Huh7.5 controls. The error bars indicate standard deviations from the means. β, symbol used for paired t-test (comparison between treated Mem and untreated control). *, symbol used for Mann-Whitney test (comparison between study groups).
Figure 5.
Figure 5.
Mem from EC rather use autophagy-mediated proteolysis to support the release of free glutamine. (A-D) Intracellular levels of (A) total converted glutamine and (B,C) glutamate only in Mem at 6 h of cell activation. (A) Levels of total converted glutamine within Mem from EC, which have been or not polyclonally activated with or without PRKAA1-dependent autophagy-mediated proteolysis blockade (BaF, E64d-PepA, or compound C). (B) Validation of the glutamate bioluminescence-based measurement by using Mem from HIVneg that have been treated with BPTES to block any glutamate conversion during their cell activation. (C) Levels of glutamate in polyclonally activated Mem for all study groups with or without PRKAA1-dependent autophagy-mediated proteolysis blockade (BaF, E64d-PepA, or compound C). (D) Chromatograms of extracted ion counts representing area under the curve quantification of glutamate and glutamine in polyclonally activated Mem in all study groups. (E) Chromatograms of extracted ion counts representing area under the curve quantification of glutamate and glutamine in non-activated (NA) Mem in all study groups. (F) Relative expression of intracellular glutamine and glutamate in activated Mem in all study groups. Of note, polyclonally activated Mem from EC and HIVneg counts required 10x dilution to avoid saturating signals. N = 6. β, symbol used for paired t-test (comparison between treated Mem and untreated control). *, symbol used for Mann-Whitney test (comparison between study groups).
Figure 6.
Figure 6.
Blocking autophagy-mediated proteolysis or glutaminolysis in EC inhibits their cellular rates of mitochondrial β-oxidation. We polyclonally activated Mem from EC in the presence or absence of PRKAA1-dependent autophagy-mediated proteolysis (BaF, E64d-PepA, and compound C) or glutaminolysis (BPTES, and R162) blockade before assessing their mitochondrial respiration. (A) Representative respiratory kinetics of Mem from EC at 6 h post-polyclonal activation when cells have been treated with or without chemical inhibitors. OCR, oxygen consumption rate. (B) SRC and (C) ATP-linked respiration were determined for all culture conditions. N = 6. The error bars indicate standard deviations from the means. β, symbol used for paired t-test (comparison between treated Mem and untreated control).
Figure 7.
Figure 7.
Glutaminolysis is required to provide optimal IL21 production in Mem from EC. We polyclonally or HIV-1-specifically activated Mem from all study groups for 6 h in the presence or absence of glutaminolysis blockade (BPTES, and R162). Levels of IL21 production at 6 h of (A) polyclonal and (B) HIV-1 Gag-specific activation. Representative histograms of IL21 expression in EC were also shown on the right side for all culture conditions (polyclonal activation). N = 6. The error bars indicate standard deviations from the means. β, symbol used for paired t-test (comparison between treated Mem and untreated control). *, symbol used for Mann-Whitney test (comparison between study groups).
Figure 8.
Figure 8.
Schematic summary of the overall autophagy-mediated proteolysis metabolic advantage dictating the strong IL21 production in HIV-1-specific Mem from EC, which confers an effective HIV-1-specific CD8A T cells response. AKG, alpha-ketoglutarate; ALs, autolysosomes; AV, autophagic vacuoles; GLUD1, glutamate dehydrogenase 1; GLS, glutaminase; TCA, tricarboxylic acid cycle; OxPhos, oxidative phosphorylation; FAO, fatty acid beta-oxidation; CPT1A, carnitine palmitoyltransferase 1A).
Figure 9.
Figure 9.
Triggering the PRKAA1 with AICAR enhances autophagy-mediated proteolysis and glutamine/glutamate availability in ART. (A) Autophagy-mediated proteolysis assessed in polyclonally activated Mem for all study groups with or without the PRKAA1 activator AICAR. We also co-cultured Mem with AICAR and protease inhibitors E64d-PepA. (B) Levels of total glutamine/glutamate were determined within Mem from ART, which have been or not polyclonally activated with or without AICAR and AICAR + E64d-PepA (co-)treatments. (C) Chromatograms of extracted ion counts representing area under the curve quantification of glutamate and glutamine in polyclonally activated or not Mem, with/without AICAR or AICAR + E64d-PepA in ART patients. Of note, polyclonally activated Mem treated with AICAR only counts required 10x dilution to avoid saturating signals. N = 6. The error bars indicate standard deviations from the means. β, symbol used for paired t-test (comparison between treated Mem and untreated control). *, symbol used for Mann-Whitney test (comparison between study groups).
Figure 10.
Figure 10.
Triggering the PRKAA1-dependent autophagy-mediated proteolysis with AICAR in ART improves their cellular rates of mitochondrial β-oxidation and Mem-related IL21 production. (A-C) We polyclonally activated Mem from ART in the presence or absence of PRKAA1-dependent autophagy-mediated proteolysis (AICAR with or without BaF, and E64d-PepA) induction, before assessing their mitochondrial respiration. (A) Representative respiratory kinetics of Mem from ART at 6 h post-polyclonal activation when cells have been treated with or without PRKAA1-dependent autophagy-mediated proteolysis. OCR, oxygen consumption rate. (B) SRC and (C) ATP-linked respiration were determined for all culture conditions. (D) At 6 h of polyclonal and HIV-1-specific activation, we also monitored the intracellular levels of IL21 with or without AICAR and E64d-PepA treatments. N = 6. The error bars indicate standard deviations from the means. β, symbol used for paired t-test (comparison between treated Mem and untreated control). *, symbol used for Mann-Whitney test (comparison between study groups).

References

    1. Boucher CA, Bobkova MR, Geretti AM, et al. State of the art in HIV drug resistance: science and technology knowledge gap. AIDS Rev. 2018;20(1):27–42. - PubMed
    1. Dube MP, Sattler FR.. Inflammation and complications of HIV disease. J Infect Dis. 2010;201(12):1783–1785. - PubMed
    1. Warriner AH, Burkholder GA, Overton ET.. HIV-related metabolic comorbidities in the current ART era. Infect Dis Clin North Am. 2014;28(3):457–476. - PubMed
    1. Davenport MP, Khoury DS, Cromer D, et al. Functional cure of HIV: the scale of the challenge. Nat Rev Immunol. 2019;19(1):45–54. - PubMed
    1. Fonseca SG, Procopio FA, Goulet JP, et al. Unique features of memory T cells in HIV elite controllers: a systems biology perspective. Curr Opin HIV AIDS. 2011;6(3):188–196. - PubMed

Publication types