. 2021 Oct 8;7(41):eabi7511.
doi: 10.1126/sciadv.abi7511. Epub 2021 Oct 6.

Therapeutic targeting of SLC6A8 creatine transporter suppresses colon cancer progression and modulates human creatine levels

Affiliations

Therapeutic targeting of SLC6A8 creatine transporter suppresses colon cancer progression and modulates human creatine levels

Isabel Kurth et al. Sci Adv. .

Abstract

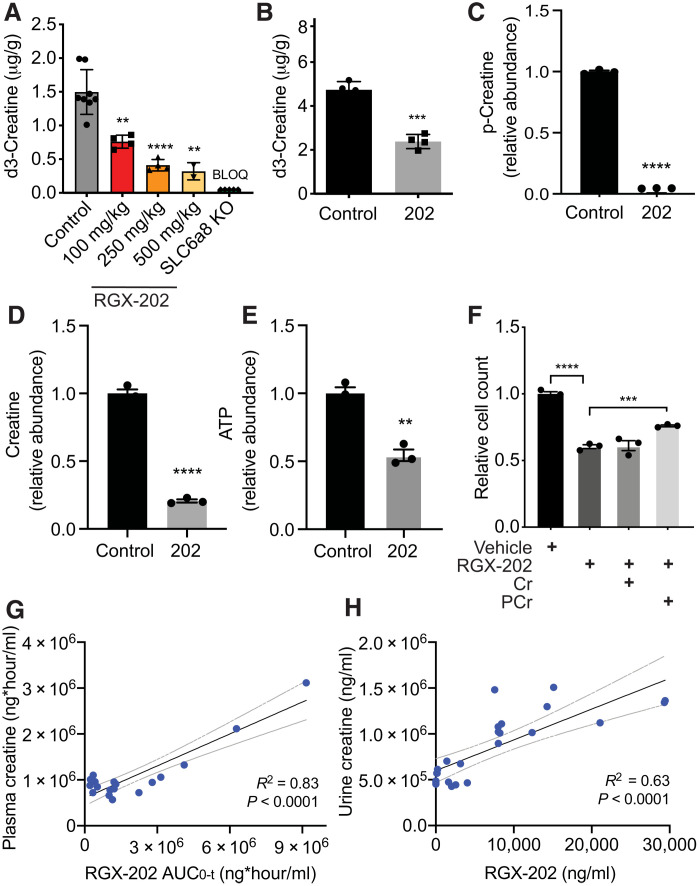
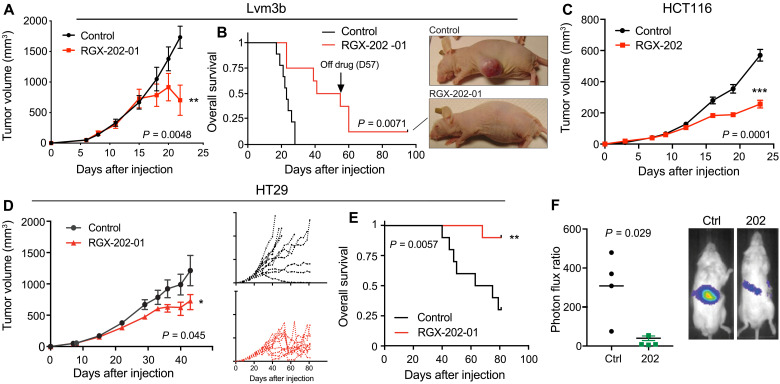
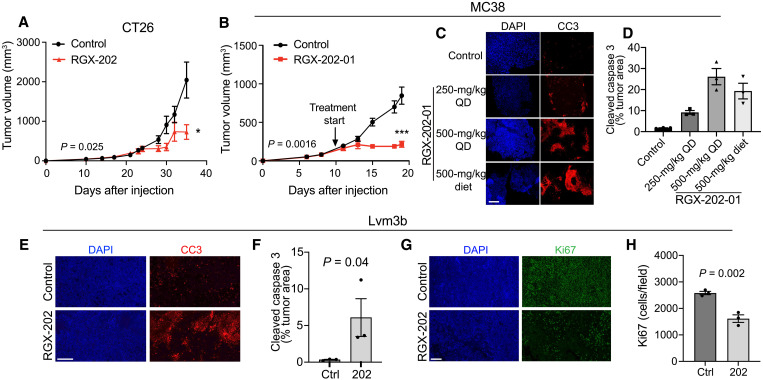
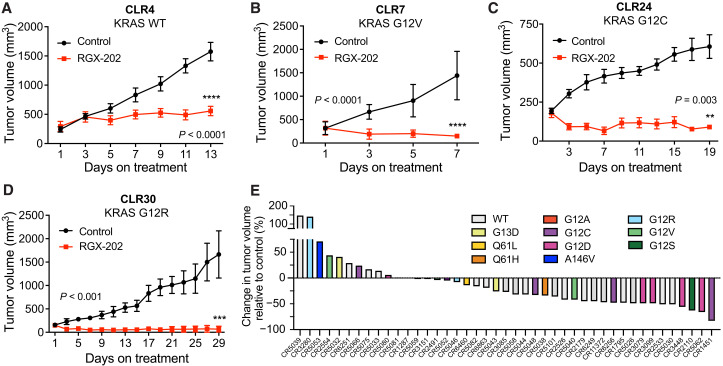
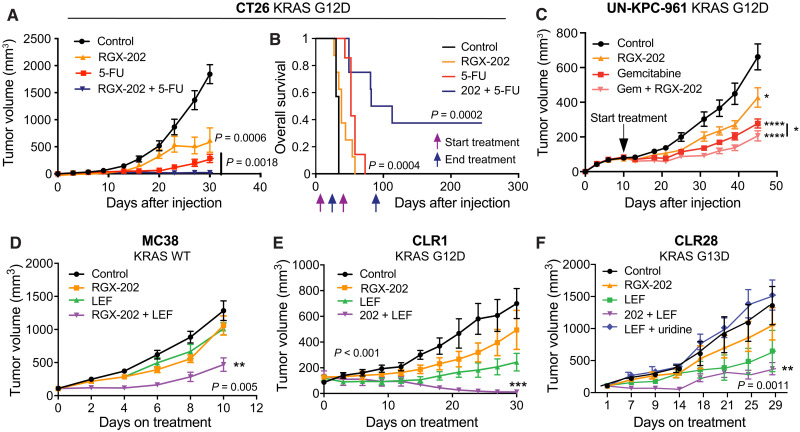
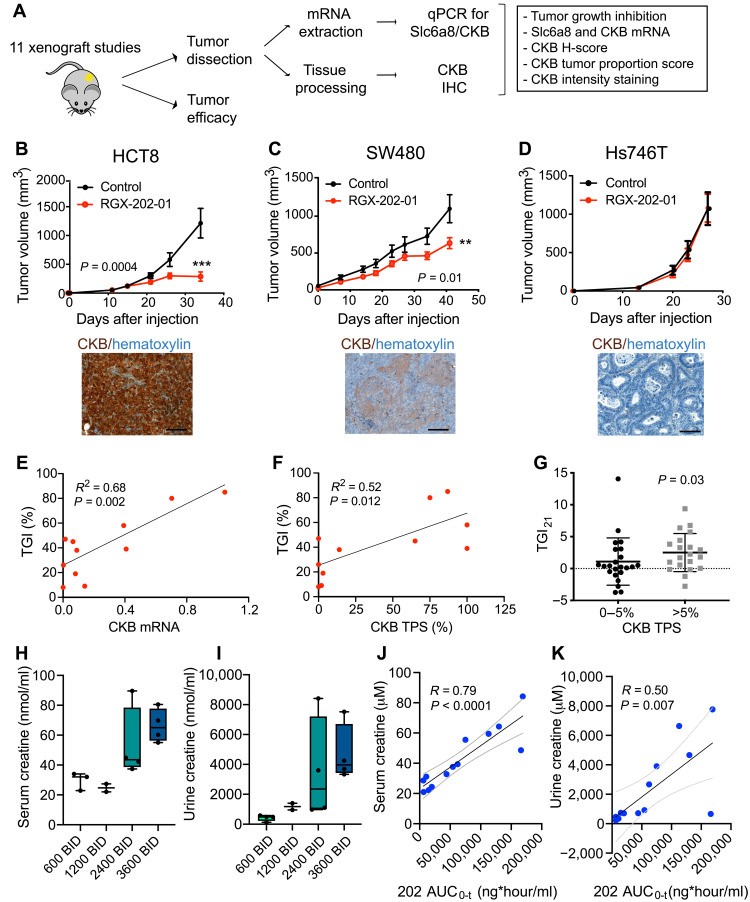
Colorectal cancer (CRC) is a leading cause of cancer mortality. Creatine metabolism was previously shown to critically regulate colon cancer progression. We report that RGX-202, an oral small-molecule SLC6A8 transporter inhibitor, robustly inhibits creatine import in vitro and in vivo, reduces intracellular phosphocreatine and ATP levels, and induces tumor apoptosis. RGX-202 suppressed CRC growth across KRAS wild-type and KRAS mutant xenograft, syngeneic, and patient-derived xenograft (PDX) tumors. Antitumor efficacy correlated with tumoral expression of creatine kinase B. Combining RGX-202 with 5-fluorouracil or the DHODH inhibitor leflunomide caused regressions of multiple colorectal xenograft and PDX tumors of distinct mutational backgrounds. RGX-202 also perturbed creatine metabolism in patients with metastatic CRC in a phase 1 trial, mirroring pharmacodynamic effects on creatine metabolism observed in mice. This is, to our knowledge, the first demonstration of preclinical and human pharmacodynamic activity for creatine metabolism targeting in oncology, thus revealing a critical therapeutic target.


Figures

Fig. 1.
Fig. 1.. RGX-202 reduces cellular and tumoral creatine and phosphocreatine levels.
(A) RGX-202 or vehicle control was administered to C57BL/6 wild-type or SLC6A8 knockout (KO) mice before injection of d3-creatine (1 mg/kg). Hearts were extracted and d3-creatine levels were quantified by LC-MS/MS; n = 3 to 8 independent experiments; P = 0.0016 (100 mg/kg), P < 0.0001 (250 mg/kg), and P = 0.0014 (500 mg/kg). BLOQ, below limit of quantification. (B) UN-KPC-961 pancreatic tumor-bearing B6129SF1/J mice were fed a control or RGX-202–supplemented diet (800 mg/kg) for 35 days. D3-creatine (1 mg/kg) was injected, tumors were extracted, and d3-creatine levels were quantified by LC-MS/MS; n = 4 per group. (C to E) Lvm3b cells (3 × 10⁵) were treated with vehicle control or 10 mM RGX-202 under hypoxia (0.5% O2) for 24 hours. Phosphocreatine (C), creatine (D), and ATP (E) levels were analyzed by LC-HRMS; n = 3; representative of three independent experiments. (F) Growth of Lvm3b cells incubated in hypoxia (0.5% oxygen) in the presence of RGX-202 (10 mM), creatine (Cr), or phosphocreatine (PCr) at 10 μM; n = 3 per group. P values are based on two-sided t test. Means ± SEM are shown (A to F). (G and H) Correlation analysis of plasma creatine and RGX-202 exposure (AUC0-t) (G) or average urine creatine and RGX-202 concentrations (H) measured over 24 hours in mice receiving either a control or RGX-202-01–supplemented diet at 100, 400, or 1200 mg/kg for 10 days; n = 6 mice per group. Gray lines denote 95% confidence interval.
Fig. 2.
Fig. 2.. SLC6A8 inhibition exhibits antitumor activity against primary and metastatic CRCs.
(A and B) Subcutaneous tumor growth (A) and Kaplan-Meier survival curves (B) by 1 × 10⁶ Lvm3b cells in athymic nude mice. Daily oral gavage of RGX-202-01 (200 mg/kg) started when tumors reached ~50 mm3; n = 8 to 9 per group. Pictures show a control and RGX-202-01–treated mouse. (C) Subcutaneous tumor growth by 0.5 × 10⁶ HCT116 cells in athymic nude mice, receiving a control or RGX-202–supplemented diet (800 mg/kg) starting when tumors became palpable; n = 5 per group. (D and E) Subcutaneous tumor growth (D) and Kaplan-Meier survival curves (E) by 2 × 10⁶ HT29 cells in athymic nude mice receiving a control or RGX-202-01–supplemented diet (800 mg/kg) when tumors reached ~55 mm3; insets represent individual tumor growth curves; n = 10 per group. (F) Bioluminescence plot of liver colonization by 5 × 10⁵ Lvm3b cells after intrasplenic injections into NOD-SCID mice imaged on day 14; n = 4 per group. Means ± SEM are shown (A, C, and D). P values are based on two-sided t tests (A, C, and D), log-rank Mantel-Cox test (B and E), or Mann-Whitney test (F). Photo credit: Celia Andreu-Agullo, Inspirna.
Fig. 3.
Fig. 3.. RGX-202 induces tumor cell apoptosis and inhibits proliferation.
(A) Subcutaneous tumor growth by 0.5 × 10⁶ CT26 cells in BALB/c mice receiving a control or RGX-202-01–supplemented diet (500 mg/kg) starting at a tumor size of ~100 mm3; n = 7 to 8 per group. (B) Subcutaneous tumor growth by 0.5 × 10⁶ MC38 cells in C57BL/6 mice receiving a control or RGX-202-01–supplemented diet (500 mg/kg) starting at a tumor size of ~150 mm3; n = 7 per group. (C and D) MC38 tumors treated with RGX-202-01 by oral gavage [once daily (QD), 250 mg/kg, P = 0.0011; 500 mg/kg, P = 0.0032] or through diet (diet, P = 0.0092) for 9 days were immunostained for cleaved caspase 3 (CC3) (C). Quantification of the percentage of tumor area stained with CC3; n = 4 per group ± SEM (D). (E to H) Representative images and quantification of Lvm3b tumors extracted from mice treated with either RGX-202-01 or control diet and immunostained for CC3 (E and F) or Ki67 (G and H) and counterstained with 4′,6-diamidino-2-phenylindole (DAPI); n = 3 tumors per group. Means ± SEM are shown; P values are based on two-sided t tests (D, F, and H) and one-sided t tests (D and F). Scale bars, 200 μm (C, E, and G).
Fig. 4.
Fig. 4.. RGX-202 inhibits growth of KRAS mutant and wild-type CRC PDXs.
(A to D) Subcutaneous tumor growth by ~25 mm3 PDX fragments implanted in athymic nude mice receiving a control or RGX-202–supplemented diet (800 mg/kg) starting at tumor sizes of ~100 mm3 (CLR4), 250 mm3 (CLR7), 200 mm3 (CLR24), and 150 mm3 (CLR30); n = 10 per group. (E) Waterfall plot of responses to RGX-202-01 across 43 colorectal PDX models; each bar represents an individual PDX, and colors represent KRAS mutations. Mice were treated with control or RGX-202-01–supplemented diet at ~400 mg/kg for 21 days. Means ± SEM are shown; P values are based on two-sided t tests (A to D).
Fig. 5.
Fig. 5.. RGX-202 synergizes with 5-FU and leflunomide.
(A and B) Subcutaneous tumor growth (A) and Kaplan-Meier survival curves (B) of 1.5 × 10⁵ CT26 cells in BALB/c mice receiving a control, RGX-202–formulated diet (800 mg/kg), 5-FU (50 mg/kg per week), or a combination of RGX-202 and 5-FU; n = 7 to 8 per group. (C) Subcutaneous tumor growth of 2.5 × 10⁶ UN-KPC-961 cells in B6129SF1/J mice receiving control, RGX-202–formulated diet (800 mg/kg, P = 0.021), gemcitabine (100 mg/kg, intraperitoneally, P < 0.0001), or a combination of RGX-202 and gemcitabine (P < 0.0001); n = 10 per group; *P (combination) = 0.04, one-tailed t test. (D) Subcutaneous tumor growth of 1 × 10⁶ MC38 cells in C57BL/6 mice receiving a control, RGX-202–supplemented diet (200 mg/kg), leflunomide (LEF) (2.5 mg/kg), or combination of RGX-202 and leflunomide; n = 10 per group. (E and F) Subcutaneous tumor growth by CLR1 (E) or CLR28 (F) PDX fragments implanted into athymic nude mice. Treatment with a control diet, RGX-202–supplemented diet (800 mg/kg), a combination of RGX-202 and leflunomide (7.5 mg/kg), or leflunomide and uridine [1 g/kg, (F)] started when tumors reached ~100 mm3; n = 6 per group. Means ± SEM are shown; P values are based on two-sided t tests (A, C, and D to F).
Fig. 6.
Fig. 6.. Tumoral CKB expression and creatine levels as predictive and pharmacodynamic biomarkers of SLC6A8 inhibition.
(A) Experimental design. (B to D) Tumor growth by 5 × 10⁶ HCT8 (B), 5 × 10⁶ SW480 (C), and 2 × 10⁶ Hs746T (D) cells subcutaneously injected into athymic nude mice receiving a control or RGX-202-01–supplemented diet (800 mg/kg). Pictures show IHC of CKB expression (brown) and hematoxylin (blue) in the control tumors; n = 8 to 10 per group. Means ± SEM are shown; P values based on two-sided t tests. (E and F) Linear regression analyses of TGI as a function of CKB mRNA (E) or CKB tumor proportion score (TPS) (F). Each dot represents the mean value of data points from one xenograft model; n = 5 to 7 tumors per model. (G) Nonparametric analysis of TGI on day 21 relative to control from the 43 PDX models, stratified into models with low (0 to 5%) or >5% CKB TPS. (H and I) Box-and-whisker plot representing the median of creatine concentrations in the serum (H) and urine (I) on day 15 of treatment; n = 2 to 4 patients per group. BID, twice daily. (J and K) Correlation analysis of serum (J) or urine (K) creatine concentration and RGX-202 blood exposure (AUC0-t). Dashed lines denote 95% confidence interval; n = 13 patients (H to K). Scale bars, 100 μm (B to D).

References

    1. Siegel R. L., Miller K. D., Goding Sauer A., Fedewa S. A., Butterly L. F., Anderson J. C., Cercek A., Smith R. A., Jemal A., Colorectal cancer statistics, 2020. CA Cancer J. Clin. 70, 145–164 (2020). - PubMed
    1. Bridgewater J. A., Pugh S. A., Maishman T., Eminton Z., Mellor J., Whitehead A., Stanton L., Radford M., Corkhill A., Griffiths G. O., Falk S., Valle J. W., O’Reilly D., Siriwardena A. K., Hornbuckle J., Rees M., Iveson T. J., Hickish T., Garden O. J., Cunningham D., Maughan T. S., Primrose J. N.; New EPOC investigators , Systemic chemotherapy with or without cetuximab in patients with resectable colorectal liver metastasis (New EPOC): Long-term results of a multicentre, randomised, controlled, phase 3 trial. Lancet Oncol. 21, 398–411 (2020). - PMC - PubMed
    1. Welch S., Spithoff K., Rumble R. B., Maroun J.; Gastrointestinal Cancer Disease Site Group , Bevacizumab combined with chemotherapy for patients with advanced colorectal cancer: A systematic review. Ann. Oncol. 21, 1152–1162 (2010). - PubMed
    1. Canon J., Rex K., Saiki A. Y., Mohr C., Cooke K., Bagal D., Gaida K., Holt T., Knutson C. G., Koppada N., Lanman B. A., Werner J., Rapaport A. S., Miguel T. S., Ortiz R., Osgood T., Sun J. R., Zhu X., McCarter J. D., Volak L. P., Houk B. E., Fakih M. G., O’Neil B. H., Price T. J., Falchook G. S., Desai J., Kuo J., Govindan R., Hong D. S., Ouyang W., Henary H., Arvedson T., Cee V. J., Lipford J. R., The clinical KRAS(G12C) inhibitor AMG 510 drives anti-tumour immunity. Nature 575, 217–223 (2019). - PubMed
    1. Patricelli M. P., Janes M. R., Li L. S., Hansen R., Peters U., Kessler L. V., Chen Y., Kucharski J. M., Feng J., Ely T., Chen J. H., Firdaus S. J., Babbar A., Ren P., Liu Y., Selective inhibition of oncogenic KRAS output with small molecules targeting the inactive state. Cancer Discov. 6, 316–329 (2016). - PubMed

Publication types

MeSH terms