. 2021 Oct 6;13(614):eabc0497.
doi: 10.1126/scitranslmed.abc0497. Epub 2021 Oct 6.

Targeting integrated epigenetic and metabolic pathways in lethal childhood PFA ependymomas

Affiliations

Targeting integrated epigenetic and metabolic pathways in lethal childhood PFA ependymomas

Pooja Panwalkar et al. Sci Transl Med. .

Abstract

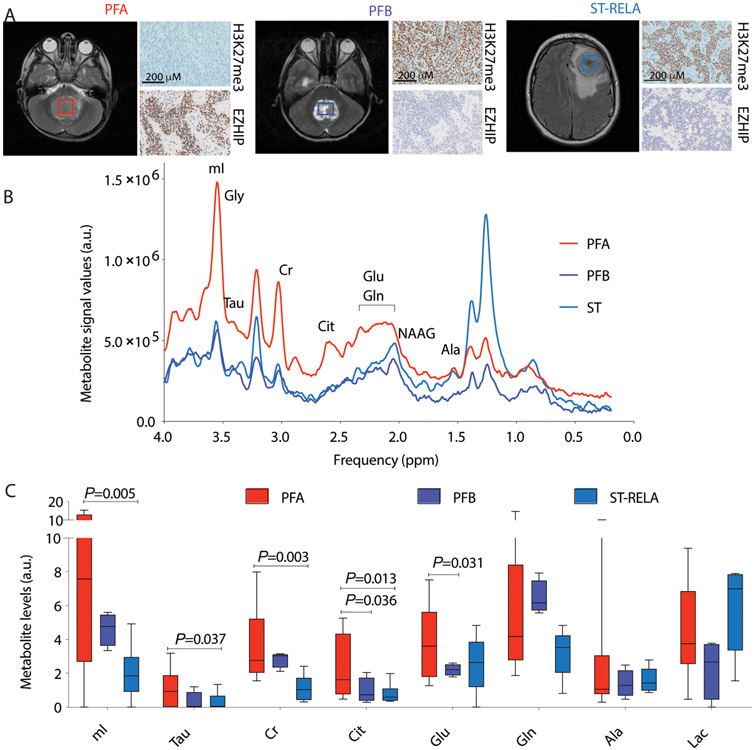
Childhood posterior fossa group A ependymomas (PFAs) have limited treatment options and bear dismal prognoses compared to group B ependymomas (PFBs). PFAs overexpress the oncohistone-like protein EZHIP (enhancer of Zeste homologs inhibitory protein), causing global reduction of repressive histone H3 lysine 27 trimethylation (H3K27me3), similar to the oncohistone H3K27M. Integrated metabolic analyses in patient-derived cells and tumors, single-cell RNA sequencing of tumors, and noninvasive metabolic imaging in patients demonstrated enhanced glycolysis and tricarboxylic acid (TCA) cycle metabolism in PFAs. Furthermore, high glycolytic gene expression in PFAs was associated with a poor outcome. PFAs demonstrated high EZHIP expression associated with poor prognosis and elevated activating mark histone H3 lysine 27 acetylation (H3K27ac). Genomic H3K27ac was enriched in PFAs at key glycolytic and TCA cycle–related genes including hexokinase-2 and pyruvate dehydrogenase. Similarly, mouse neuronal stem cells (NSCs) expressing wild-type EZHIP (EZHIP-WT) versus catalytically attenuated EZHIP-M406K demonstrated H3K27ac enrichment at hexokinase-2 and pyruvate dehydrogenase, accompanied by enhanced glycolysis and TCA cycle metabolism. AMPKα-2, a key component of the metabolic regulator AMP-activated protein kinase (AMPK), also showed H3K27ac enrichment in PFAs and EZHIP-WT NSCs. The AMPK activator metformin lowered EZHIP protein concentrations, increased H3K27me3, suppressed TCA cycle metabolism, and showed therapeutic efficacy in vitro and in vivo in patient-derived PFA xenografts in mice. Our data indicate that PFAs and EZHIP-WT–expressing NSCs are characterized by enhanced glycolysis and TCA cycle metabolism. Repurposing the antidiabetic drug metformin lowered pathogenic EZHIP, increased H3K27me3, and suppressed tumor growth, suggesting that targeting integrated metabolic/epigenetic pathways is a potential therapeutic strategy for treating childhood ependymomas.


Figures

Figure 1.
Figure 1.. PFAs exhibit elevated glycolysis and TCA-cycle metabolism compared to PFB ependymomas
(A) Schematic indicates epigenetic and clinical differences between PFA and PFBs. (B) To assess metabolic pathways upregulated in PFAs versus PFBs, we queried expression of a comprehensive set of 2,754 metabolic genes encoding all known human metabolic enzymes and transporters (19) in PF ependymomas from three independent, non-overlapping data sets: Bayliss et al. 2016 (PFA n=11, PFB n=4) (6), Witt et. al. 2011 (PFA n=18, PFB n=19) (2) and Pajtler et al. 2015 (PFA n=72 and PFB n=39) (1). Venn diagram illustrates intersection of upregulated genes in all three data sets. (C) Metabo Analyst pathway impact analysis was performed for the 53 commonly upregulated (in all three data sets) metabolic genes in PFA versus PFB ependymomas. (D) Simplified illustration of key metabolites and enzymes related to glycolysis, TCA-cycle and PPP metabolism is illustrated. Enzymes indicated in blue that were upregulated in all three data sets. (E) Single cell RNA-seq expression of HK2 and PDHB in PFA (n=20) versus PFB (n=3) ependymomas from Gojo et al. 2020 is indicated (18). (F) Key metabolites related to glycolysis, TCA-cycle and PPP were measured using liquid chromatography-mass spectroscopy (LC-MS run with technical duplicates) in patient tumor samples from PFA (n=14, red), PFB (n=3, blue), ST (n=3, light blue) and control non-pathologic human pediatric frontal cortex (purple, n=3) and cerebellum (orange, n=3). (G) Steady-state key metabolites related to glycolysis, TCA-cycle and PPP from EPD210 (PFA, red) and EP1NS (ST-RELA, light blue) ependymoma cell lines cultured in neurosphere serum-free conditions are shown (n=8 for all, except n=4 for Pyr, Lac, Cit, Isocit, Fum, Gln and Glu). (H) Metabo Analyst pathway impact analysis was performed using significantly upregulated metabolites from 1G. (I and J) Expression levels of genes in the glycolysis-KEGG (Kyoto Encyclopedia of Genes and Genomes) pathway in 91 PF ependymomas (I) or 55 PFA ependymomas (J) were segregated into high versus low glycolytic gene expression categories using unbiased K-means clustering. Kaplan-Meier analysis was then performed between high versus low glycolytic tumors to determine differences in overall survival. Data were analyzed by the Log rank test. Data represented as mean +/− SD or violin plots (with medians and interquartile ranges and ends of violin plots representing the highest and lowest observations). Statistical significance determined by 2-sided, unpaired, 2-tailed, t-test in 1E and 1G, and by ANOVA in 1F. (1,3-BPG, 1,3-Bisphosphoglyceric acid; 2-PG, 2-phosphoglycerate; 3-PG, 3-phosphoglycerate; ACO2, aconitase-2; Ala, alanine; Asp, aspartate; Cit, citrate; CoA, Coenzyme A; DHAP, Dihydroxyacetone phosphate; FBP, fructose-bisphosphate; FUM, fumarate; G-3-P or GAP, Glyceraldehyde 3-phosphate; GLC, glucose; GLN, glutamine; GLUL, glutamine synthetase; GLU, glutamate; GLUD1/2, glutamate dehydrogenase1/2; HK2, hexokinase-2; LAC, lactate; MAL, malate; Met, metabolism; PDH, pyruvate dehydrogenase; PEP, phosphoenolpyruvate; PGAM2, phosphoglycerate mutase 2; PYR, pyruvate; Ribul-5-P, ribulose-5-phosphate; Ribo-5-P, ribose-5-phosphate; Sed-7-P, sedoheptulose 7-phosphate; Suc, succinate; TCA-cycle, tricarboxylic acid cycle; TKT, transketolase; X-5-P, xylulose 5-phosphate)
Figure 2.
Figure 2.. Non-invasive in vivo MRS imaging shows elevated citrate and glutamate concentrations in PFA ependymomas
(A) Representative axial MRI images from patients with PFA, PFB and ST-RELA are shown. Boxes indicate region of MRS quantification. Representative images from H3K27me3 and EZHIP immunostaining performed on the corresponding tumors are illustrated. Scale bar=200μM. (B) Representative in vivo MRS spectra (TE = 35 ms, TR = 2 s; g) from PFA (red), PFB (blue) and ST (light blue) ependymomas are shown. (C) MRS quantification of myoinositol (mI), taurine (Tau), creatine (Cr), citrate (Cit), glutamate (Glu), glutamine (Gln), alanine (Ala) and lactate (Lac) from PFA (n=7, red), PFB (n=3, blue) and ST (n=5, light blue) patients are plotted. (A.U.- Arbitrary units). Data were analyzed by unpaired t test with Welch's correction and are presented as box and whisker plots.
Figure 3.
Figure 3.. EZHIP expression correlates with high H3K27ac, location in the fourth ventricle, and prognosis in PF ependymomas
(A) Representative images of EZHIP, H3K27me3 and H3K27ac immunostaining in PFA (two samples PFA #1 and PFA#2, illustrating range of EZHIP expression) and PFB ependymomas. Scale bar represents 100 μm. (B) Blinded quantification of EZHIP and H3K27ac in PFA (n=90, red) and PFB (n=65, blue) tumors and association of each marker with age: <10 years (n=78, orange) and >10 years (n=16, purple). (C) Overall and progression free survival in EZHIP low (n=30) versus EZHIP high (n=31, median cutoff) PFAs are indicated. (D) Representative MRI images from PF ependymomas associated with the lateral recess (LR, red arrows), roof (red arrows) and floor (red arrow) of the fourth ventricle (assessed by a radiologist in a blinded manner) are illustrated. (E and F) Representative images and blinded quantification of EZHIP associated with the lateral recess (LR, n=10), roof (n=15) and floor (n=17) of the fourth ventricle; H3K27me3 (LR, n=14), roof (n=25) and floor (n=17); and H3K27ac (LR, n=14), roof (n=25) and floor (n=17) in PF ependymoma are shown. Scale bar=200μm. Data represented as violin plots (with medians and interquartile ranges and ends of violin plots representing the highest and lowest observations). Statistical significance determined by 2-sided, unpaired, 2-tailed, t-test in 3B, Log-rank test in 3C, and by ANOVA in 3F.
Figure 4.
Figure 4.. EZHIP-WT versus EZHIP-M406K NSCs demonstrate higher H3K27ac enrichment at Hk2 and Pdh and exhibit enhanced glycolysis and TCA-cycle metabolism
(A) Mouse NSCs were stably transfected with FLAG-tagged EZHIP-WT, EZHIP-M406I or EZHIP-M406K. Representative WB for FLAG, H3K27me3, H3K27ac and total H3 are shown. (B) Bar plot of cell counts (cell numbers, Y-axis) in parental (par, light blue), EZHIP-WT (red) and EZHIP-M406K (blue) NSCs (n=4 with 2-3 technical replicates, each) is shown. (C) Super-enhancer (SE, enhancer rank X-axis) with increased H3K27ac enrichment (EZHIP-WT enhancer strength, Y-axis) in EZHIP-WT, but not EZHIP-M406K NSC is depicted. SE unique to EZHIP-WT that overlap with PFA-specific SE from Mack et al. 2018 (25) are indicated. (D) Representative heatmaps and H3K27ac enrichment (Y-axis) of genes (including both promoters/enhancers) enriched for H3K27ac in EZHIP-WT versus EZHIP-M406K NSC +/−5Kb from peak center (X-axis) are shown. (E) Representative H3K27ac ChIP-seq tracks at Hk2, Prkaa2/Ampkα-2, and Pdhx; gene loci in EZHIP-WT and EZHIP-M406K NSCs are indicated. (F) Representative heatmaps of genes (including both promoters/enhancers) enriched for H3K27ac in PFA versus ST +/−5Kb from peak center are shown. (G) Representative H3K27ac ChIP-seq tracks at HK2, PDHB, and PRKAA2/AMPKα-2 gene loci in PFA and ST ependymoma tumors are indicated. (H-I) Unbiased proteomic analysis (≤1% FDR with adjusted p-value < 0.05) was performed between EZHIP-WT and EZHIP-M406K NSCs. Heatmap illustrates differentially expressed proteins and bar graph shows GSEA pathway analysis of all upregulated proteins in EZHIP-WT compared to EZHIP-M406K NSC (n=3, each, I). (J) Bar graph represents steady state key metabolites related to glycolysis, PPP and TCA-cycle from EZHIP-WT (red) and EZHIP-M406K (blue) NSC (n=3, each). (K) Metabo Analyst pathway impact analysis is illustrated using significantly upregulated metabolites from 4J. Data are represented as violin plots (with medians and interquartile ranges and ends of violin plots representing the highest and lowest observations) or as mean +/− SD. Statistical significance determined by non-parametric, 2-sided, unpaired, 2-tailed, t-test (4J) or one-way ANOVA (4B). Data in C analyzed by the Log rank test.
Figure 5.
Figure 5.. Metformin suppresses TCA-cycle and PPP metabolism and downregulates EZHIP to increase global H3K27me3 in PFA cells
(A) Bar graph demonstrates PRKAA2/AMPKα-2 expression in PFA (n=11) and PFB (n=4) ependymoma tumor samples from Bayliss et al. 2016 (6). (B) Violin plots indicate PRKAA2/ AMPKα-2 expression in PFA (n=72) and PFB (n=39) from Pajtler et al. (1). (C) Violin plots of single cell RNA-seq expression of PRKAA2/ AMPKα-2 in PFA (n=20) and PFB (n=3) ependymomas from Gojo et al. 2020 are indicated (18). (D) Parental (light blue), EZHIP-M406K (blue), or EZHIP-WT (red) NSCs (n=4, with 2-7 technical replicates each) were plated in a 6-well plate (200,000 cells/well) and treated with vehicle or metformin (indicated doses in mM, X-axis). After 4 days, cells were counted (Y-axis) using Trypan blue exclusion assay. (E, F, and G) PFA cell lines EPD210, MAF928 (E) and MAF811 (F), and control ST01 (supratentorial non-fusion) and NHA (normal human astrocytic cells) (G) were plated in a 6-well plate (100,000 cells/well) and treated with vehicle or metformin (indicated doses, X-axis). After 6 days, cells were counted using Trypan blue exclusion assay (n=4, for all). Cell counts were normalized to untreated controls for the corresponding cell line (Y-axis). Unbiased proteomic analysis was performed in EZHIP-WT NSCs treated with vehicle (veh+, PBS, n=3) or metformin (met+, 4 mM, n=4) for 4 days. (H, I, J and K)Heatmap demonstrates differentially expressed proteins (H) and bar graph shows GSEA pathway analysis of all down-regulated proteins between metformin-treated and vehicle-treated EZHIP-WT NSC (I). Unbiased metabolomics using LC-MS was performed between EPD210 PFA cells treated with vehicle (veh+, PBS, n=4) or metformin (met+, 25 mM, n=3) for 4 days. Heatmap demonstrates differentially expressed metabolites (J). Metabolite enrichment analysis (using Metabo Analyst) was performed on downregulated metabolites between metformin-treated and vehicle-treated EPD210 cells (K). (L) Representative Western blots for phospho-AMPK (pAMPK), total AMPK (tAMPK), VINCULIN, H3K27me3 and Total H3 in EPD210 PFA cells cultured for 5 days with either vehicle (PBS), or metformin (25mM and 50 mM) are shown. (M) Representative Western blots for EZHIP and VINCULIN in EPD210 PFA cells cultured for 4 days with either vehicle (PBS), or AICAR (1mM), or metformin (25 or 50 mM) are illustrated. (N) Representative Western blots for FLAG, Gapdh, H3K27me3 and Total H3 in EZHIP-WT or EZHIP-M406K NSC cultured for 3 days with vehicle (PBS) or 25 mM metformin are shown. (O) Comparison of differential expression of proteins (Log 2 fold change) in EZHIP-WT/ EZHIP-M406K NSC versus Metformin/ Veh EZHIP-WT NSC is shown. Data represented as mean +/− SD or violin plots (with medians and interquartile ranges and ends of violin plots representing the highest and lowest observations). Statistical significance determined by 2-sided, unpaired, 2-tailed, t-test (5A-C), or ANOVA (5D) or Pearson’s correlational analysis (5O).
Figure 6.
Figure 6.. Metformin reduces tumor growth and EZHIP, and increases global H3K27me3, in vivo.
(A) Schematic illustrates treatment schedule with either metformin (250mg/kg, administered daily by oral gavage), or panobinostat (10mg/kg, administered 3 times/week intraperitoneally.), or both agents for four weeks in mice grafted with PFA PDXs (see also fig. S6, C and D, and fig. S9). Treatments were started after confirming tumor engraftment in each model. (SubQ, subcutaneous; BLI, Bioluminescence imaging). (B) Tumor volumes normalized to the initial tumor size (Y-axis) and plotted as a function of time (X-axis, days) in mice grafted subcutaneously with PFA-MAF928 PDX cells and treated with vehicle (DMSO, Veh, blue, n=5), metformin (Met, black, n=8), panobinostat (Pano, n=6, red) or both (Met+Pano, n=6, purple). (C) Kaplan-Meier analysis of percentage of PFA-MAF928 PDXs tumors receiving indicated treatment that grew three-fold in volume (Y-axis) are plotted as a function of time (X-axis, days). (D) NSG Mice were orthotopically implanted with PFA-EPD210 PDXs. Left panel shows representative bioluminescence images in mice before or after treatment treated with either vehicle (Veh, n=7), or metformin (met, n=7), or panobinostat (Pano, n=3) are shown. Right panel shows representative bioluminescence images in mice treated with vehicle or combination of both (Met+Pano, n=8). (E) Bar graph of normalized bioluminescence values in PFA-EPD210 orthotopic mice at 6-weeks post treatment is shown. (F) Kaplan-Meier survival analysis of mice with EPD210 PDXs receiving either vehicle or indicated treatments is indicated. (G and H) Representative images (G) and blinded quantification of EZHIP (H) immunostaining in PFA-EPD210 PDX orthotopic mice treated with vehicle (DMSO, Veh, blue, n=7), panobinostat (Pano, n=3, red), metformin (Met, black, n=5), or both (Met + Pano, n=7, purple) are shown. (I and J) Representative images (I) and blinded quantification of H3K27me3 (J) immunostaining in PFA-EPD210 PDX orthotopic mice treated with vehicle (DMSO, Veh, blue, n=7), panobinostat (Pano, n=3, red), metformin (Met, green, n=7), or both (Met + Pano, n=8, purple) are shown. Data represented as mean +/− SD. Statistical significance was determined by Log-Rank analyses (6C and 6F, P values in comparison with vehicle treated animals are indicated) or ANOVA (6B, 6E, 6H and 6J). Scale bar=50μM.

References

    1. Pajtler KW, Witt H, Sill M, Jones DT, Hovestadt V, Kratochwil F, Wani K, Tatevossian R, Punchihewa C, Johann P, Reimand J, Warnatz HJ, Ryzhova M, Mack S, Ramaswamy V, Capper D, Schweizer L, Sieber L, Wittmann A, Huang Z, van Sluis P, Volckmann R, Koster J, Versteeg R, Fults D, Toledano H, Avigad S, Hoffman LM, Donson AM, Foreman N, Hewer E, Zitterbart K, Gilbert M, Armstrong TS, Gupta N, Allen JC, Karajannis MA, Zagzag D, Hasselblatt M, Kulozik AE, Witt O, Collins VP, von Hoff K, Rutkowski S, Pietsch T, Bader G, Yaspo ML, von Deimling A, Lichter P, Taylor MD, Gilbertson R, Ellison DW, Aldape K, Korshunov A, Kool M, Pfister SM, Molecular Classification of Ependymal Tumors across All CNS Compartments, Histopathological Grades, and Age Groups. Cancer Cell 27, 728–743 (2015). - PMC - PubMed
    1. Witt H, Mack SC, Ryzhova M, Bender S, Sill M, Isserlin R, Benner A, Hielscher T, Milde T, Remke M, Jones DT, Northcott PA, Garzia L, Bertrand KC, Wittmann A, Yao Y, Roberts SS, Massimi L, Van Meter T, Weiss WA, Gupta N, Grajkowska W, Lach B, Cho YJ, von Deimling A, Kulozik AE, Witt O, Bader GD, Hawkins CE, Tabori U, Guha A, Rutka JT, Lichter P, Korshunov A, Taylor MD, Pfister SM, Delineation of two clinically and molecularly distinct subgroups of posterior fossa ependymoma. Cancer Cell 20, 143–157 (2011). - PMC - PubMed
    1. Mack SC, Witt H, Piro RM, Gu L, Zuyderduyn S, Stutz AM, Wang X, Gallo M, Garzia L, Zayne K, Zhang X, Ramaswamy V, Jager N, Jones DT, Sill M, Pugh TJ, Ryzhova M, Wani KM, Shih DJ, Head R, Remke M, Bailey SD, Zichner T, Faria CC, Barszczyk M, Stark S, Seker-Cin H, Hutter S, Johann P, Bender S, Hovestadt V, Tzaridis T, Dubuc AM, Northcott PA, Peacock J, Bertrand KC, Agnihotri S, Cavalli FM, Clarke I, Nethery-Brokx K, Creasy CL, Verma SK, Koster J, Wu X, Yao Y, Milde T, Sin-Chan P, Zuccaro J, Lau L, Pereira S, Castelo-Branco P, Hirst M, Marra MA, Roberts SS, Fults D, Massimi L, Cho YJ, Van Meter T, Grajkowska W, Lach B, Kulozik AE, von Deimling A, Witt O, Scherer SW, Fan X, Muraszko KM, Kool M, Pomeroy SL, Gupta N, Phillips J, Huang A, Tabori U, Hawkins C, Malkin D, Kongkham PN, Weiss WA, Jabado N, Rutka JT, Bouffet E, Korbel JO, Lupien M, Aldape KD, Bader GD, Eils R, Lichter P, Dirks PB, Pfister SM, Korshunov A, Taylor MD, Epigenomic alterations define lethal CIMP-positive ependymomas of infancy. Nature 506, 445–450 (2014). - PMC - PubMed
    1. Merchant TE, Current Clinical Challenges in Childhood Ependymoma: A Focused Review. J. Clin. Oncol 35, 2364–2369 (2017). - PubMed
    1. Pajtler KW, Wen J, Sill M, Lin T, Orisme W, Tang B, Hubner JM, Ramaswamy V, Jia S, Dalton JD, Haupfear K, Rogers HA, Punchihewa C, Lee R, Easton J, Wu G, Ritzmann TA, Chapman R, Chavez L, Boop FA, Klimo P, Sabin ND, Ogg R, Mack SC, Freibaum BD, Kim HJ, Witt H, Jones DTW, Vo B, Gajjar A, Pounds S, Onar-Thomas A, Roussel MF, Zhang J, Taylor JP, Merchant TE, Grundy R, Tatevossian RG, Taylor MD, Pfister SM, Korshunov A, Kool M, Ellison DW, Molecular heterogeneity and CXorf67 alterations in posterior fossa group A (PFA) ependymomas. Acta Neuropathol. 136, 211–226 (2018). - PMC - PubMed

Publication types